Interactively Visualizing Dynamic Social Networks with DySoN Georg Groh TU M¨unchen, Faculty for Informatics, Germany
[email protected]
Holger Hanstein TU M¨unchen, Faculty for Informatics, Germany
[email protected]
Wolfgang W¨orndl TU M¨unchen, Faculty for Informatics, Germany
[email protected]
as the dynamics of relation-type or relation-intensity) is a time-averaged view of a faster underlying relational dynamics. For example we might view the intensity of a friendship relation which is instantiated in time and space only four times in the last month as less strong in that month compared to a month where the same friendship was instantiated eight times. With a more fine granular time view (e.g. weeks or days), the four times of seeing your friend may be concentrated in a short time interval, e.g. two days, while the rest of the month there was no interaction at all, thus yielding high intensity in these two days and very low intensity for the other 28 days of the month. Thus the different underlying time granularities may give rise to the notions of social micro- and macro-dynamics and social micro- and macrocontexts respectively. In that view the social macro-context dynamics is determined by or at least strongly related to the the underlying social micro-context(s).
ABSTRACT
The dynamic social network visualizer “DySoN” (Dynamic Social Networks) aims at understanding patterns and structural changes in dynamic social networks that evolve over time via an interactive visualization approach. As an alternative and supplementation to the numerous other approaches to visualization of social network data and as an attempt to overcome some of the drawbacks of these approaches, DySoN interactively visualizes streaming event data of social interactions by an interactive three-dimensional model of interpolated NURBS ”tubes”, representing activity and social proximity within a given set of actors during a given time period by using three dimensions of temporal information mapping: spatial density (tube distance), tubecolor and tube-diameter. We use a self assembled large collaboration network of Jazz musicians with a straightforward semantics for the computation of relation strengths for the evaluation of the approach. We also discuss applications of the concept for awareness services in mobile peer to peer social networks, which exhibit a vivid measurable social micro dynamics in time and space.
With respect to a rather small time and space granularity, everybody has an idea of such social micro-contexts or dynamic social structures, at least unconsciously, because some of the mechanisms that organize mankind into groups and hierarchies can be observed in real life when people form changing patterns with their bodies in time and space while interacting socially. In order to get an abstract view of relationships and their instantiations between actors in a social network, one can build upon these ”physical patterns” which may be measured and modeled mathematically, especially when considering mobile interaction schemes with community- or social network platforms [32]. Besides such physical expressions of social relations a wealth of other highly dynamical features or indicators of social relations exist that may be modeled (see section ).
Author Keywords
Mobile Dynamic Social Networks, Awareness Services ACM Classification Keywords
H.5.2 Information Interfaces and Presentation: Miscellaneous—Optional sub-category MOTIVATION & OBJECTIVES
Social relations and social structures respectively are clearly of a dynamical nature. Many dynamical aspects of social relations investigated by social science are rather long term which is partly due to the properties of the investigation instruments such as questionnaires. In many cases the dynamic model of these properties of social relations (such
However dynamical the social network model or social context may be: One of the most basic awareness class service which can be built upon such a dynamic social network model is a visualization which allows to intuitively recognize social distance and group structures. There is a clear demand for methods and software tools, that are able to analyze and visualize the evolution of networks [50, p. 1208ff]. Limited by visual and geometric constraints, a few basic metaphors for temporal or dynamic graphs and networks have been developed so far, including line graphs with summary statistics, series or animations of 2D- or 3D-snapshots, graph overlays, node position tracing and 2,5D or 3D-models
Submitted for review to CHI 2009.
1
with a temporal z axis. But the requirements regarding the aspects of visualization in general once formulated by Brandes [5, p. 7ff] - substance, design and algorithm - can still not be regarded as solved issues and thus still need to be worked on. We aim at proposing a solution to dynamic social network analysis that on the hand maintains the mental map well over time and thus allows a quick overview of the dynamics of the relations in a set of people (thus avoiding the clutter of some older approaches) as well as an interactive UI that allows to focus on more specific aspects and analyze them in more depth.
based on all this previous work) some approaches on dynamic social network visualization (roughly related to our approach are e.g. [11, 10, 22, 52, 59, 46] have been proposed. We have compiled a more detailed review of the cited related work in [35].
Such a method should take the language of social patterns mentioned before and carry it forward into the temporal dimension, and it should combine the “big picture” with exact metrics of the development of a social network during a given period of time, following Ben Shneiderman’s “Visual Information-Seeking Mantra”: “Overview first, zoom and filter, then details-on-demand” [55]. Thus such an approach has to be able to adequately mediate between the social macro dynamics and micro dynamics.
Space-time path We apply Hgerstrand’s “space-time path” principle [33] to social networks. Euclidean distances in the two spatial dimensions are derived from social proximity data which in our Jazz musician network is deduced from co-recordings. Similar approaches are used in physics when visualizing world-lines of particles in special relativity theory.
PARADIGMS & DESIGN RATIONALS
In order to work towards the the goals defined in section , we will combine and adapt several existing techniques in a unique way and add some new ideas:
Force-directed layout Social structures in a given timeslice is visualized by a force-directed layout mechanism, as demonstrated for example by Krempel [41] [42] [43], Dekker [15] and others. We use a modified version of the Fruchterman-Reingold algorithm [28], which will be adapted to support our notion of the “crowd” metaphor following [48]. This original metaphor assumes that most activity within a large group takes place in an inner circle which is surrounded by the outer fringe with passive people. Important metrics for this arrangement are the diameter of the circle and the thickness of the ring, permeability and sharpness of the borders, and the space between rings, if there are several ones. This crowd metaphor can be assumed to apply to social micro-contexts (covering small space-time-”intervals”) as well as macro-contexts (covering larger space-time-”intervals”) and although it has been stated for groups, it can be used to intuitively visualize general social structures or networks.
The main objective of this paper is to discuss such an interactive visualization approach and to verify the suitability of the technology used and of its visual metaphor by case studies. The application should allow to inspect structures of social networks from the “connectedness perspective”, as defined by Brandes [5, p. 33]. It is intended to support awareness in communities and in (mobile) social networks with dynamically changing relations and to give quick visual answers to questions on varying time- (and thus space-)scales like the following: Which are central, important or prominent actors and which are peripheral? How does the centrality of actors develop over time? Are there long-lasting partnerships between actors? Are there visible structures in the network? How do structures evolve? How do actor attributes correlate with visible network structures?
Stacked graphs The inherent temporal graph structure is inspired by “combined”, “stacked” or “stratified” graph layout methods as shown by Erten et al. [23] [24] and Dwyer and Eades [20] [19] and others. Where time is represented by the third dimension of a 3D vizualization.
Proposing convincing approaches as possible solutions to these questions would allow a user to effectively analyze a social environment (e.g. personal or professional) and maintain an overview of the dynamics within such an environment. An interesting field of application are e.g. open innovation processes in dynamically evolving fields (such as life sciences) where many actors are involved and such questions can be asked with respect to e.g. co-invention-activities.
Mental map We use strategies from dynamic graph drawing inspired by solutions described by Branke [8], Diehl et al. [17][16] and Brandes [5] to minimize changes between subsequent layouts and to preserve the “mental map” [21] so that the evolution of structures can be followed through time. preserving the mental map between time slices is one of the key problems in dynamic graph visualization.
RELATED WORK
There are various approaches to graph drawing (see [47, 30] for a good overview) and social network visualization in general (classic examples are e.g. [36, 5, 15, 57, 43, 38, 31, 42]. Furthermore there are also many approaches to visualization of dynamic graphs (related to our work are e.g. [12, 13, 7, 17, 16, 8, 27, 6, 20, 23, 24, 14, 18, 1, 9, 25, 19, 29] and general time related data (good overview: [2])(related to our work are especially [45] and (as a general paradigm) Hgerstrands space-time-paths [33]) (works that are inspired by that paradigm: [44, 61, 60, 54, 49])). Furthermore (partly
Tube metaphor We introduce the “tube” metaphor, an enhancement of the “worm” metaphor, which was introduced by Mathews and Roze [45], and enhanced by Dwyer and Eades [20] [19] and Ware et al. [56] to implement the spacetime path. Instead of aggregated cones or simple inter-temporal edges we use tubular shapes extruded from interpolated NURBS curves to achieve a better compliance with the continuity principle of Koffka’s “Gestalt Theory” [40] (cited 2
after [37]).
and McFarland [4] [50]. We thus realize a simple way of mediating between social micro- and macro dynamics. For a more fine grained mediation the stack of rules for event aggregation need to be refined further and made adjustable to the specific social domain. Time-line and section view A simplified time-line-based approach is used to show two-dimensional layouts of individual “frames” or “time-slices”, similar to the “phase plot” mechanism by Bender DeMoll and McFarland [3].
(a) Stack of weighted (b) Straight intertempographs. ral edges.
Temporal attribute mapping One network-related attribute can be mapped to the nodes’ spatial coordinates (see above). Two additional syntactic or semantic actor attributes can be mapped to the temporal extension of the tubes, one by a continuous color gradient and the other by radius transition. Similar approaches have already been suggested [19, p. 101]. (c) Interpolated tertemporal edges.
in- (d) Tubular intertemporal edges.
Interactive GUI An interactive, explorative three-dimensional user interface built of a Java3D universe is used, combined with a tabular database view and a two-dimensional graph layout. Interactivity is a crucial feature of dynamic social network visualization since zooming and change of perspective are necessary in order to complete one’s overview of the development of a social structure. For a detailed discussion of the features of the GUI see [35].
Figure 1. 2.5D Graph stack without and with intertemporal edges. (Time-Dim.:in z-Direction)
Abstraction from nodes and edges The tube metaphor used will abstract completely from graph edges to prevent occlusion, to help focus on the structure and to reveal pure spatiotemporal movement (spatial proximity corresponds to social proximity). Omitting the edges for an increased overview is a quite common technique (see e.g. [51]).
(a) Tube-only display
DEFINITIONS, ASSUMPTIONS & REALIZATION
Our uni-modal dynamic social network model is a temporal multi-graph G(t) = (V, E(t)) with a set of actors V and an undirected, weighted time dependent set of edges E(t) which are known at discrete points in time E(ti ) and are then interpolated. Each G(ti ) is called a time slice. Each pair of nodes can be connected by an arbitrary number of edges. The weights of the edges are normalized to one via wnorm (e) = w(e)/wmax and will be interpreted as ”social proximity” values. Furthermore we assume that every node has a profile which can be modeled as an attribute value pair list. Such node profiles may contain attributes with slow dynamics (such as long term interests, fields of study, name, sex etc.) as well as attributes with fast dynamics (context parameters) such as location, current activity etc. From a more abstract point of view the edges also have a profile which contains such elements as the weight of the edge at a given point in time and the history of instantiation events of the underlying social relation over time. Thus the edge weights of a social macro-dynamics perspective are aggregated via domain specific rules from social micro-dynamics (specific social events or instantiations of social relations respectively).
(b) Color mapping
(c) Color and radius mapping Figure 2. Tube-only model without and with mapping of degree centrality onto temporal axis.
It is clear that that there are two main perspectives, which can be applied when analyzing social structures: the viewpoint of connectedness (relational view) and the viewpoint of profile (entity view) Brandes’ view [5, p. 32ff].
Continuous-time model Temporal attributes are represented by a simplified continuous-time model, where social events are aggregated according to rules, similar to (but admittedly not as flexible as) the model suggested by Bender DeMoll
The profile viewpoint is realized in our approach by the concept that two real valued attributes (if existing) can be additionally visualized in our ”‘tube-only” model via color and radius of the tubes. The connectedness perspective is at3
Fruchterman-Reingold application for the next slice at ti+1 . Other algorithms like Kamada and Kawai [39], would be less suited for us because of their usage of the graph-theoretical path distance. While Kamada-Kawai is in fact in use for social network visualization in some applications, the path length between two nodes is less obvious to interpret that the weight of the individual relation. We assume that the application domain for a dynamic social network visualization implies a highly directly connected social network where two nodes are very likely to be directly connected. In order to further preserve the mental map, we assume that a node should remain at it is current position as far as possible if its degree does not change substantially, so we introduce an additional attractive force from the nodes position during the FR-run to its position in the previous time slice with a strength proportional to its degree change. Using relative weight changes instead of degree changes (weights drop to / raise from zero) would be another possibility.
tributed in our approach through the weight of the edges, which corresponds to social proximity. There are numerous approaches in literature for computing social proximity, for example either by considering the number of different paths between two actors [34, ch. 7, p. 9], from the calculation of geodesic path length[34, ch. 7, p. 14] or as a combination of, e.g., weighted adjacency and geodesic distance [15]. The current version of DySoN assumes that the edge weights (w(e(ti )) (in the sense of a social macro-context) are be computed by accumulating social events (in the sense of a social micro-context) that take place in [ti−1 , ti ] involving the adjacent actors {vl , vm } of e. We assume that these events are situative instantiations of longer lasting social relations. Naturally, as has been discussed before, the domain of application dictates what a good distinction between the social micro context (social ”events”) and the social macrocontext (longer lasting social relations) should be. The nesting of social dynamic tiers can be broken down to very fine space and time granularities: E.g. from a precise modeling of single communication acts between two people on a party as elementary events of micro-context, continuing with a tier that aggregated the events from the previous layer and views the event of visiting the party alongside the events of visiting the zoo together two days later as elementary events and finally a layer that aggregates these events over a month and views months of intense interaction as elementary events. Each tier (coarser time / space granularity) aggregates relation instantiations (events) from a lower tier (finer time / space granularity). The investigation of this type of modeling is subject to current research of one of the authors. We aim at investigating the modeling assumption that the intensity and other aspects of higher tier relations can be readily deduced from the properties of lower tier relation events.
The original FR algorithm uses a ”spring-paradigm” between nodes to compute a suitable layout, which uses a repulsive force fr = −k 2 /δ and an attractive force fa = δ 2 /k between two nodes, where δ is the euclidean distance between them and k (being roughly analogous to the spring constant or ”natural length of the spring” is a simple function of the visualization canvas dimensions w and h and some experimental constant c). The forces are directed along the vector from node one to node two. We modify the original approach by several means. First we introduce our edge weights by proportionally strengthening the attractive force fa0 = fa ∗ w(e). The second modification introduces an additional attractive gravitational force (inspired by [26]) to the center of the slice canvas. This accounts for the effect occurring with pure FR, that isolated nodes are pushed to the canvas borders by the lack of attractive force. In order to emphasize the impact of centrality, our additional attractive gravitational force is fg = δ 2 ∗ (deg(v) + d)/k where deg(v) is the degree of v, δ its distance to the center and d an additional steering parameter.
It is possible to substitute social proximity with (profile)similarity depending on the application domain. Analogous to the nesting of social proximity with respect to time and space granularity (social micro- / macro-context) one can use for the similarity calculation profile parameters with high dynamics (such as current micro-location) or averaged variants of these (e.g. coarse area of usual ”residence”). Again as in the case of relational dynamics we assume that the macro-tier contains averages of the next lower microtier. Some Profile elements with very slow dynamics (such as name) that are not averaged versions of related profile elements with higher dynamics are often less useful for similarity calculations.
The complexity of the original FR algorithm has been stated as Θ(|V |2 + |E|) [28, p. 1138] and our complete layout algorithm can be shown [35] to have an overall complexity of O(|V |2 s) where s is the number of time slices. So our modifications to not add substantially to the overall time complexity. It may be worthwile to study the effects of introducing node ”inertia” for mental map preservance and using the result layout from the previous time slice as the starting layout for the modified FR algorithm in the current layout with respect to the number of iterations it takes the modified FR-Algorithm to converge in each time slice. One can expect a substantially decreased number of iterations, since we start from a ”good previous solution” and limit the ”node mobility”.
One of the main goals for the relative layout of the planar graphs corresponding to each time slice is that the layout of consecutive time slices is supposed to preserve the ”‘mental map” [21] as much as possible. This paradigm interferes with mapping the social distances as exactly as possible. We solve these conflicting demands by using a modified Fruchterman-Rheingold [28] (FR) layout algorithm for each slice as a compromise, also because it is easy to adapt to our purposes (edge weights as measures of social proximity). We furthermore use the standard approach of using the resulting layout of slice ti as initial layout for the
Having computed the positions of each node in each time slice, these points have to be interpolated with a suitable smooth curve (∈ C 2 (see [58] for an easy motivation)) which is the center of the tube for that particular node (actor). We evaluated interpolation polynomials, Bezier curves and sim-
4
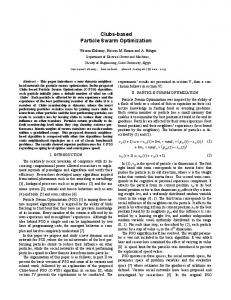
Figure 3. Decay of the Miles Davis Band in the early seventies.
ple B-splines for the purpose and found severe drawbacks for each [35] and arrived at NURBS (Non Uniform Rational BSplines) [53] of degree 3 as the best choice for our problem. See [35] on how we compute knot points and control points or these curves. We then build our tube surfaces as cylindrical NURBS surfaces around the interpolation curves.
contributions for a given time slice is the domain specific heuristic rule, which connects social micro-dynamics (broken down to individual instantiations of social ”co-recording” relations) and macro-dynamics (e.g. when applying a time slice of one year. Depending on the domain of interest these rules need to be adapted.
Concerning the ”profile” dimensions color and radius we chose (for the current prototype) to visualize node degree with color and radius, because n our paradigm the edges are missing completely. The color paradigm is to chose ”hot colors for (nodes) tubes with a high node degree (these are perceived to be ”socially active” in the given time slice) and also to give them larger radii the more connected they are. [35] describes the details of these calculations.
We made substantial efforts to avoid counting re-releases. The color corresponds to the node degree as explained before and the tube radius is also set to reflect the node degree to support the color coding. Figure 3, for example, depicts the breakup of a band which played together for some years. The involved musicians all started solo careers and their own band projects after one successful key recording with the band leader. You see the effect that tubes are crossing here, though the clique has not changed, which has to be addressed by improving the incremental layout algorithm. Figure 4 shows an actor, who has been central for some years before relations to the other participating actors break. This happened due to a couple of solo recordings, which do not provide the actor with high centrality. Our findings with several other examples were, that the system was able to meaningfully visualize phenomena in the Jazz scene over the last decades. A further evaluation would have to empirically manifest this claim by doing an extensive study with a set of Jazz experts. Future research will also investigate the assumption that the system’s basic design metaphors are also suitable for the vizualization of social relations on a shorter time scale (e.g. as part of awareness services in mobile social network appli-
STUDY: THE JAZZ-NETWORK
As a first step to verify the suitability of the approach we collected an extensive dataset on musical collaborations in Jazz and checked from our own pre-existing knowledge of the Jazz-scene whether the tool was able to fulfill the goals. We crawled on of the numerous publicly available, Wiki-style (socially crafted) discography data-base Discogs (www.discogs.com) with a snowball approach [34] and substituted missing biographical data of the musicians by a supplemental crawling process of Wikipedia. This resulted in 96798 musicians who played on 224173 tracks on 37773 albums. Thus the resulting social network is in fact a two mode network (mode one: musicians, mode two: albums). Each musical co-contribution of two musicians for a track is viewed as an event and accumulated to the temporal weight of the respective edge in the respective time slice. Adding up these 5
Figure 4. Actor with period of high degree centrality.
cations).
glect a fine grained dynamic social network model and, in general, the user has to take care for himself about modeling his social relations. Truly mobile social network models and services which are socially sensitive as well as context sensitive will allow for semi-automatic detection and modeling of social relations on all time / space scales (the social microand macro-contexts) and will make intimate use of the resulting ”multi-dynamic” social network. A possible service could be e.g. a ”socio-context-cast” communication service that allows to publish messages to certain combined social and physical contexts (”Send a message to all persons that attended Jim’s party yesterday”). Because of the highly dynamic nature of social micro-contexts, it is not reasonable to assume that continuously uploading such information to a central social networking platform is reasonable. Furthermore the more fine grained the collected social information is, the more pressing are the privacy issues connected with an unconstrained publication of such data. Instead of such an Orwellian central platform, one would switch to a decentralized social networking paradigm such as NoseRub. Clearly, awareness services are one of the key features of such a mobile P2P style social networking framework. DySoN can be used to visualize either social proximity (”what’s the (micro-/meso-/macro-dynamics of my ‘friendship’ relations?”) or social similarity (e.g. co-locatedness (”who is in my vicinity?”)) on all time scales. In order to do that, we have to work on heuristics that aggregate the events on the micro-scale into social relationship strengths (or proximity values) on the next higher level.
UI/PARAMETERS OF THE CURRENT DYSON APPLICATION
Besides several mainteneance UI elements (e.g. for manipulation the actor set), DySoN allows to interactively control and manipulate the visualization in order to analyze certain details. The user can turn and zoom the visualization in several ways. Furthermore the geometry of the tubes can be manipulated by e.g. setting the overall tube diameter (e.g. depending on the number of actors). Lighting and color models can also be adjusted: E.g. Degree Transparency is one approach to improve the readability of the model (especially those with high numbers of actors and thus a high density of tubes) by making those parts of the tubes transparent, that represent a time period with a degree of less than the value set by the Threshold slider. The amount of transparency can be adjusted by the Opacity slider. Furthermore the user can interactively determine the profile parameters that are mapped to the radius and color temperature. There a lot of other parameters which can be adjusted. See [35] for details. APPLICATION OF DYSON AS AWARENESS SERVICE ELEMENT IN MOBILE P2P SOCIAL NETWORKS
Existing social network platforms such as Facebook often are mainly focused on long term social relations, thus at the social macro-context. What is happening on a finer time scale (except for some aspects such as Online-awareness etc) is only covered by some platforms such as Twitter. But these platforms often tend to focus on the individual user and ne6
Proceedings of the 10th ACM Conference on Hypertext and hypermedia: returning to our diverse roots, pages 51–60, 1999.
SUMMARY, DISCUSSION AND FUTURE WORK
We discussed a novel method to visualize dynamic social networks. A case study of collaborating Jazz musicians revealed that the approach indeed matches the goals that were formulated in section . On a more general level an empirical user study would have to be conducted. Since it is very hard to measure the ”quality” of a visualization the design of such a study would have to involve standardized data and a comparison with other approaches which is difficult since every existing other approach aims at slightly different aspects. Since the dynamics of social networks is coming more more to the focus of attention (especially due to mobile interaction paradigms), the problem of useful dynamic social network visualization still remains an interesting topic for the future.
11. C. Chen and L. Carr. Visualizing the evolution of a subject domain: a case study. In VIS ’99: Proceedings of the conference on Visualization ’99, pages 449–452, Los Alamitos, CA, USA, 1999. IEEE Computer Society Press. 12. E. H. Chi. Web analysis visualization spreadsheet. Technical report, Xerox Palo Alto Research Center, Palo Alto, CA 94304, 1999. 13. E. H. Chi and S. K. Card. Sensemaking of evolving web sites using visualization spreadsheets. In INFOVIS ’99: Proceedings of the 1999 IEEE Symposium on Information Visualization, page 18, Washington, DC, USA, 1999. IEEE Computer Society.
REFERENCES
1. A. Ahmed, T. Dwyer, C. Murray, L. Song, and Y. X. Wu. Wilmascope graph visualisation. In INFOVIS ’04: Proceedings of the IEEE Symposium on Information Visualization (INFOVIS’04), page 216.4, Washington, DC, USA, 2004. IEEE Computer Society.
14. C. Collberg, S. Kobourov, J. Nagra, J. Pitts, and K. Wampler. A system for graph-based visualization of the evolution of software. In SoftVis ’03: Proceedings of the 2003 ACM symposium on Software visualization, pages 77–ff, New York, NY, USA, 2003. ACM Press.
2. W. Aigner, S. Miksch, W. M¨uller, H. Schumann, and C. Tominski. Visualizing time-oriented data – a systematic view. Computers + Graphics, 31(3):401–409, June 2007.
15. A. Dekker. Conceptual distance in social network analysis. Journal of Social Structure, 6(3), 2005. 16. S. Diehl and C. G¨org. Graphs, they are changing – dynamic graph drawing for a sequence of graphs. In Graph Drawing: 10th International Symposium, GD 2002, Irvine, CA, USA, August 26-28, 2002. Revised Papers, volume 2528/2002 of Lecture Notes in Computer Science, pages 23–30. SpringerLink, 2002.
3. S. Bender-deMoll and D. A. McFarland. Interaction, time, and motion: Animating social networks with sonia, 2004. 4. S. Bender-deMoll and D. A. McFarland. The art and science of dynamic network visualization. Journal of Social Structure, 7(2), 2006.
17. S. Diehl, C. G¨org, and A. Kerren. Preserving the mental map using foresighted layout. In Proceedings of the Joint Eurographics-IEEE TVCG Symposium on Visualization, VisSym, pages 175–184. Springer Verlag, Wien, New York, 2001.
5. U. Brandes. Layout of Graph Visualizations. PhD thesis, Universit¨at Konstanz, 1999. 6. U. Brandes and S. R. Corman. Visual unrolling of network evolution and the analysis of dynamic discourse. In INFOVIS ’02: Proceedings of the IEEE Symposium on Information Visualization (InfoVis’02), page 145, Washington, DC, USA, 2002. IEEE Computer Society.
18. T. Dwyer. A scalable method for visualising changes in portfolio data. In APVis ’03: Proceedings of the Asia-Pacific symposium on Information visualisation, pages 17–25, Darlinghurst, Australia, Australia, 2003. Australian Computer Society, Inc.
7. U. Brandes and D. Wagner. A bayesian paradigm for dynamic graph layout. In Proceedings of the 5th International Symposium on Graph Drawing (GD’97), volume 1353 of Lecture Notes in Computer Science, pages 236–247. Springer Verlag, 1997.
19. T. Dwyer. Two and a Half Dimensional Visualisation of Relational Networks. PhD thesis, University of Sydney, 2005. 20. T. Dwyer and P. Eades. Visualising a fund manager flow graph with columns and worms. In Proceedings of the 6th International Conference on Information Visualisation, IV02, pages 147–158. IEEE Computer Society, 2002.
8. J. Branke. Dynamic graph drawing. Lecture Notes In Computer Science, pages 228–246, 2001. 9. C. Chen. The centrality of pivotal points in the evolution of scientific networks. In IUI ’05: Proceedings of the 10th international conference on Intelligent user interfaces, pages 98–105, New York, NY, USA, 2005. ACM Press.
21. P. Eades, W. Lai, K. Misue, and K. Sugiyama. Preserving the mental map of a diagram. In Proceedings of Compugraphics, pages 34–43, 1991. 22. T. Erickson and M. R. Laff. The design of the ’babble’ timeline: a social proxy for visualizing group activity over time. In CHI ’01: CHI ’01 extended abstracts on
10. C. Chen and L. Carr. Trailblazing the literature of hypertext: author co-citation analysis (1989–1998). In 7
36. J. Heer. Exploring Enron – Visualizing ANLP Results, 2004.
Human factors in computing systems, pages 329–330, New York, NY, USA, 2001. ACM Press.
37. K. Hinum. Gravi++ - An Interactive Information Visualization for High Dimensional, Temporal Data. PhD thesis, Vienna University of Technology, Institute of Software Technology and Interactive Systems, Favoritenstrasse 9-11/186, A-1040 Vienna, Austria, December 2006.
23. C. Erten, P. J. Harding, S. G. Kobourov, K. Wampler, and G. Yee. Exploring the computing literature using temporal graph visualization, 2003. 24. C. Erten, P. J. Harding, S. G. Kobourov, K. Wampler, and G. V. Yee. Graphael: Graph animations with evolving layouts. In Graph Drawing, volume 2912 of Lecture Notes in Computer Science, pages 98–110. Springer Verlag, 2004.
38. M. H¨opner and L. Krempel. The politics of the german company network, September 2003.
25. C. Erten, S. G. Kobourov, V. Le, and A. Navabi. Simultaneous graph drawing: Layout algorithms and visualization schemes. Journal of Graph Algorithms and Applications, 9(1):165–182, July 2005.
39. T. Kamada and S. Kawai. Automatic display of network structures for human understanding. Technical Report 88-007, Department of Information Science, University of Tokyo, 1988.
26. A. Frick, A. Ludwig, and H. Mehldau. A fast adaptive layout algorithm for undirected graphs. In R. Tamassia and I. G. Tollis, editors, GD ’94: Proceedings of the DIMACS International Workshop on Graph Drawing, volume 894, pages 388–403, London, UK, 10–12 1994. Springer-Verlag.
40. K. Koffka. Principles of Gestalt Psychology. Harcourt, Brace, & World, 1935.
27. C. Friedrich and P. Eades. Graph drawing in motion. Journal of Graph Algorithms and Applications, 6(3):353–370, February 2002.
42. L. Krempel. Visualizing networks with spring embedders: Two-mode and valued graphs. Presented at the Joint Statistical Meetings of the American Statistical Association, August 1999.
41. L. Krempel. Simple representations of complex networks: strategies for visualizing network structure. Presented at the 3rd European Conference for Network Analysis, Munich, 1993.
28. T. M. J. Fruchterman and E. M. Reingold. Graph drawing by force-directed placement. Software Practice and Experience, 21(11):1129–1164, 1991.
43. L. Krempel. The language of networks. Presented at the Ars Electronica 2004, Linz, September 2004. 44. M.-P. Kwan and J. Lee. Geovisualization of human activity patterns using 3d gis: A time-geographic approach. In M. F. Goodchild and D. G. Janelle, editors, Spatially Integrated Social Science: Examples in Best Practice, chapter 3. Oxford University Press, Oxford, 2003.
29. M. Gaertler and D. Wagner. A hybrid model for drawing dynamic and evolving graphs. In S. Leonardi, F. M. auf der Heide, and D. Wagner, editors, Algorithmic Aspects of Large and Complex Networks, number 05361 in Dagstuhl Seminar Proceedings. Internationales Begegnungs- und Forschungszentrum fuer Informatik (IBFI), Schloss Dagstuhl, Germany, 2006.
45. G. Matthews and M. Roze. Worm plots. IEEE Computer Graphics and Applications, 17(6):17–20, November-December 1997.
30. R. T. I. G. T. Giuseppe Di Battista, Peter Eades. Graph Drawing - Algorithms for the Visualization of Graphs. Prentice Hall, 1999.
46. D. A. McFarland and S. Bender-deMoll. SoNIA (Social Network Image Animator), 2007.
31. P. Gleiser and L. Danon. Community structure in jazz. Technical report, Universitat de Barcelona, 2003.
47. D. W. E. Michael Kaufmann. Drawing Graphs Methods and Models. Springer, 2001.
32. G. Groh. Ad-Hoc-Groups in Mobile Communities Detection, Modeling and Applications. PhD thesis, 2005.
48. S. Milgram. The individual in a social world - Essays and Experiments. Series in social psychology. Addison-Wesley, Reading, Massachusetts, 1977.
33. T. H¨agerstrand. What about people in regional science? Papers of the Regional Science Association, 24:7–21, 1970.
49. H. J. Miller. Activities in space and time. In K. H. P. Stopher, K. Button and D. Hensher, editors, Handbook of Transport 5: Transport Geography and Spatial Systems. Elsevier Science, 2004.
34. R. A. Hanneman and M. Riddle. Introduction to social network methods, 2005.
50. J. Moody, D. McFarland, and S. Bender-deMoll. Dynamic network visualization. American Journal of Sociology, 110(4):1206–1241, January 2005.
35. H. Hanstein. Interactive visualization of dynamic social networks. Master’s thesis, Fakultt fr Informatik, Prof Schlichter, Technische Universitt Mnchen, Munich, Germany, 2007.
51. P. Mutton. Inferring and visualizing social networks on internet relay chat, 2004. 8
52. P. Mutton. Piespy social network bot – inferring and visualizing social networks on irc, 2006. 53. L. A. Piegl. On NURBS: A Survey. IEEE Computer Graphics and Applications, 11(1):55 – 71, January 1991. 54. S.-L. Shaw. Time geography for activity modeling with gps tracking data. Presentation at FHWA-sponsored Peer change and CSISS Specialist Meeting, Santa Barbara CA, October 10–11 2005. 55. B. Shneiderman. The eyes have it: A task by data type taxonomy for information visualizations. In IEEE Visual Languages, pages 336–343, College Park, Maryland 20742, U.S.A., 1996. 56. C. Ware. GeoZui4D – GEOreferenced Zooming User Interface 4D, 2007. 57. R. Wengenmayr. Thinking with your eyes. MaxPlanckResearch, 2:64–71, 2005. 58. Wikipedia. Nonuniform rational B-spline, July 2007. 59. R. Xiong and J. Donath. Peoplegarden: creating data portraits for users. In UIST ’99: Proceedings of the 12th annual ACM symposium on User interface software and technology, pages 37–44, New York, NY, USA, 1999. ACM Press. 60. H. Yu. Spatio-temporal gis design for exploring interactions of human activities. Cartography and Geographic Information Science, 33(1):3–19, 2006. 61. H. Yu and S.-L. Shaw. Revisiting h¨agerstrand’s time-geographic framework for individual activities in the age of instant access. In Proceedings of Research Symposium on Societies and Cities in the Age of Instant Access, Salt Lake City, Utah, November 10–12 2005.
9