ical blogs, the IMDB co-star network, and a dataset show- ing conflicting evidence ..... frequency of the term âObamaâ at time t â1 is 99 (or Ftâ1 = 99) and at time t is ..... 7. Conclusion. This paper presented TimeArcs, a novel visualization tech-.
Volume 35 (2016), Number 3
Eurographics Conference on Visualization (EuroVis) 2016 K-L. Ma, G. Santucci, and J. J. van Wijk (Guest Editors)
TimeArcs: Visualizing Fluctuations in Dynamic Networks T. N. Dang1 , N. Pendar2 , and A. G. Forbes1 1 University
of Illinois at Chicago
2 SurveyMonkey,
Inc.
Abstract In this paper we introduce TimeArcs, a novel visualization technique for representing the dynamic relationships between entities in a network. Force-directed layouts provide a way to highlight related entities by positioning them near to each other. Connected entities are brought closer to each other (forming clusters) by forces applied on nodes and connections between nodes. In many application domains, relationships between entities are not temporally stable, which means that cluster structures and cluster memberships also may vary across time. Our approach merges multiple force-directed layouts at different time points into a single comprehensive visualization, which provides a big picture overview of the most significant clusters within a user-defined period of time. TimeArcs also supports a range of interactive features, such as allowing users to drill-down in order to see details about a particular cluster. To highlight the benefits of this technique, we demonstrate its application to various datasets, including the IMDB co-star network, a dataset showing conflicting evidences within biomedical literature of protein interactions, and collocated popular phrases obtained from political blogs. Categories and Subject Descriptors (according to ACM CCS): H.5.2 [Information Interfaces and Presentation]: User Interfaces—Graphical user interfaces
1. Introduction Exploring relationships between entities collocated within an event or time period is a fundamental task for many visualization applications. Depending on the application domain, a relationship might occur when, for instance, two actors co-star in the same movie, two researchers co-author the same publication, or two proteins interact within a biological pathway. In many domains, relationships are timedependent. For example, an actor may co-star with hundreds of other actors during his or her career. Moreover, the relationship between any pair of actors can be quite varied: some actors appear together only in a single movie, some work together consistently in multiple movies over a short period of time, and some are reunited after not having worked together for decades. The complexities associated with representing a large number of elements with dynamic connectivity make visualizing relationship networks challenging. Bringing related entities close to each other allows the user to readily detect clusters within a large network. This provides a big picture view of entities and their temporal dynamics. For example, certain terms are mentioned together in multiple news articles to highlight a political event. In another example, a sudden increase in phone calls between a c 2016 The Author(s)
c 2016 The Eurographics Association and John Computer Graphics Forum Wiley & Sons Ltd. Published by John Wiley & Sons Ltd.
group of people within an hour coupled with monetary transactions might be a sign of a fraud taking place. Quickly identifying emerging patterns in local communities is a desired feature in many application domains, such as crime prevention. To address these challenges we developed TimeArcs, a novel visualization technique that makes it easy for a user to quickly identify patterns across time, and subsequently to analyze both how those patterns might have formed and also how they might evolve over time. Our technique utilizes constraints on a force-directed layout algorithm to automatically show patterns in text over time, as determined by a custom topic modeling algorithm or via features intrinsic to the original dataset. In this paper we introduce details about our interactive visualization technique for fluctuating dynamic networks, which: 1) presents the evolution of entities over time, 2) highlights temporal clusters of entities, and 3) supports various interactions that allow users to drill-down on a particular cluster or relationship of interest. Moreover, we provide demonstrations of the effectiveness of our technique through its application to three different real-world datasets, including: the collocated popular terms obtained from political blogs, the IMDB co-star network, and a dataset showing conflicting evidence within the biomedical literature of
T.N. Dang et al. / TimeArcs: Visualizing Fluctuations in Dynamic Networks
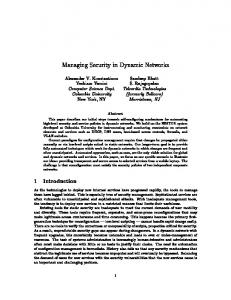
Figure 1: Visualizing collocated popular terms obtained from Wikinews in TimeArcs. Area graphs show how frequently the terms appear and are colored by term categorizations. Arcs highlight terms that appear together in the same articles. Interacting with the terms or arcs facilitates user exploration of temporal patterns within the topics that include those terms.
protein interactions. Fig. 1 shows an overview of TimeArcs applied to topics and terms extracted from Wikinews. 2. Related Work 2.1. Dynamic Network Visualization With the increasing availability of temporal data, dynamic graph visualization is growing as an active research field with many applications in various domains. In a recent survey, Beck et al. [BBDW16] provide an overview of the growing number of techniques for representing the evolution of relationships between entities in readable, scalable, and effective diagrams. This survey presents a high-level categorization of different types of dynamic graph visualizations as animated node-link diagrams, timeline-based static charts, or hybrids of these. While the former has been a dominant method for dynamic visualizations, timeline-based techniques that provide a time-to-space mapping are becoming increasingly popular. Greilich et al. [GBD09] propose a technique to visualize a weighted, dynamic compound digraph by drawing a sequence of node-link diagrams in a single view. Upward and downward edges are separated by using colored arcs. Horizontal alignment of nodes in the hierarchy at different time points are kept the same to facilitate comparison of the graphs in a sequence. This also represents a drawback of this technique: since horizontal alignment of nodes is constrained by the hierarchical structure, nodes cannot be reordered to minimize edge crossings. Parallel edge splatting [BVB∗ 11] takes a different approach by drawing side-by-side from left to right as a sequence of narrow stripes that are placed perpendicular to the
horizontal time line. The hierarchically organized vertices of the graphs are arranged vertically. In particular, a relationship from A to B at time t is presented as a link from A at time t to B at time t + 1. Consequently, the dynamic graph looks similar to a parallel coordinates plot. Parallel edge splatting encounters the problem of visual clutter that occurs when drawing many lines onto a small portion of the screen space. To improve scalability on time axis, Beck et al. introduce Rapid Serial Visual Presentation (RSVP) [BBV∗ 12] as a hybrid approach of animated and timeline-based graph diagrams. A radial version [BBW12] of the Parallel edge splatting approach is also introduced to achieve shorter links than in the Cartesian counterpart. However, curved links in the radial technique seem to be harder to follow. Another radial approach, Radial Layered Matrix [VBSW13], produces less visual clutter by using radially distorted pixels instead of explicit link representations. An obvious drawback of this approach is that it is can be difficult to identify trace connections between nodes. Based on the Gestalt principles of closure, proximity, and similarity, van den Elzen et al. [vdEHBvW13] present node reordering strategies to enable users to find temporal properties such as trends, periodicity, and anomalies in a network. The paper also introduces strategies to reorder nodes vertically, such as minimizing edge length or reducing block overlap. However, these are NP-hard optimization problems [GJS74]. Matrices can also be used to visualize the temporal changes in dynamic networks [BC02,MKF∗ 15,YES10]. Adjacency matrices are particularly effective when visualizing dense graphs [HdF06] since they avoid edge-crossing problem in node-link diagrams [DMF15, GFC05, KEC06]. c 2016 The Author(s)
c 2016 The Eurographics Association and John Wiley & Sons Ltd. Computer Graphics Forum
T.N. Dang et al. / TimeArcs: Visualizing Fluctuations in Dynamic Networks
TimeMatrix [YES10] displays a small temporal bar chart within each cell of the matrix to show the changes of edge weights for the two corresponding vertices. Instead of bars, gestaltmatrix [BN11] uses gestaltlines, intra-cell lines that encode different metrics using the angle and length. Individual time slices can be difficult to extract from matrix representations. Matrix Cubes [BPF14] stack adjacency matrices at each time step to form a space-time cube that can be decomposed into different 2D time slices or vertex slices. MultiPiles [BHRD∗ 15] presents the adjacency matrices (snapshots) side by side, then similar consecutive snapshots are piled together to provide a more compressed view of a temporal network. A common drawback of all matrix representations is that paths between nodes are difficult to identify and trace.
to positive or vice versa), the topic will switch the thread as well. Users can also select a time point and see the relationships between different topics by arcs, similar to the technique introduced in this paper. In storyline visualizations, each entity in the visualization is represented as a line. This constraint makes storyline visualizations unsuitable for many application domains. While, for example, characters in a movie can only appear once in each scene at every time point (which is suitable for storyline visualizations), researchers often collaborate with different people to publish multiple papers in a year, or an actor may film with different crews concurrently (which is not suitable for storyline visualizations). Our TimeArcs technique can highlight multiple relationships concurrently using arcs. 3. Design Decisions for the TimeArcs Visualization
2.2. Storyline Visualization Storyline visualization was inspired by Randall Munroe’s hand-drawn movie narrative charts† . Unique features of storyline visualization, compared to other timeline visualizations, are that each entity in the storyline visualization is represented as a line and that the relationships between the entities are encoded according to the relative distances between the associated lines over time. Storyline visualizations have applications in different domains, such as tracing changes in family relationships in genealogical data [KCH10], understanding the evolution of community structures in dynamic social networks [RTJ∗ 11], and visualizing relationships between evolving topics in text streams [CLT∗ 11, XWW∗ 13]. Tanahashi and Ma [TM12] propose a set of design considerations for generating storyline visualizations: (1) Reducing line crossings; (2) maximizing the straightness and continuity of the lines; (3) minimizing the wiggle distances to obtain a compact layout; and (4) minimizing the empty space that may cause an unbalanced layout. A visualization based on these design principles can automatically generate a storyline layout, albeit taking considerable time to compute. The StoryFlow [LWW∗ 13] approach improves the speed of generating the storyline layout by using an efficient hybrid optimization approach. Furthermore, it embeds a contextual information hierarchy into the layout using closed contours surrounding the events in the background. TextFlow [CLT∗ 11] analyzes various evolution patterns that emerge from multiple topics. The TextFlow visualization focuses on visually analyzing merging and splitting relationships between evolving topics. Xu et al. [XWW∗ 13] employed stacked graphs to display the time-varying competitiveness of topics on social media with a storyline style visualization. EvoRiver [SWL∗ 14] uses the same composite visual design, but separate the negative and positive threads. When there is a turn on competition power (from negative † https://xkcd.com/657/ c 2016 The Author(s)
c 2016 The Eurographics Association and John Wiley & Sons Ltd. Computer Graphics Forum
In this section, we present the motivation and design choices for our timeline-based technique that facilitates the identification and exploration of temporal communities of network vertices and that provides an overview of network dynamics over a given period of time. Given a set of entities and their relationships over time, TimeArcs was designed with the following visualization goals, drawn largely from the existing literature on timeline visualization (design goals were synthesized from the references provided after each of the goals): G1. Display the evolution of entities as they change over time [BW08, FAHL11, DGWC10, XWW∗ 13]. G2. Highlight related entities by positioning them close to each other [CLT∗ 11, TM12]. This allows users to quickly identify temporal communities. G3. Reduce line/arc crossings that may lead to occlusion and visual clutter [TM12, LWW∗ 13]. Additionally, we also want to increase the legibility of text (i.e. entity labels) by minimizing the occlusion between texts and links. Ahn et al. [APS14] identifies a task taxonomy for network evolution analysis across three dimensions: entity, property, and temporal feature. TimeArcs specifically supports node/link level (G1) and group level (G2) entity analysis. Regarding the property dimension, TimeArcs supports both structural properties (edge connectedness is used to organize entities as described in G2) and domain attributes (nodes/links are colored based on their categorizations). On the third dimension, TimeArcs focuses on the temporal features of individual events. More specifically, our work aims to make it easy to discover at what point in time an entity, relationship, or group activity appears or disappears. To satisfy the design criteria introduced above, we made the following design decisions: D1. The time axis is aligned horizontally from left to right. This design is widely used when visualizing time series data [HHWN02, Wat05, BW08].
T.N. Dang et al. / TimeArcs: Visualizing Fluctuations in Dynamic Networks
D2. Each entity is represented as a straight line. Previous research has indicated that reducing the crossing between entity representations is the most important metric to reduce visual clutter [LWW∗ 13,Pur97]. It is easier to trace a straight line (to visualize the temporal relationships associated to an entity) than to trace a curve [MD12]. Moreover, a CloudLines style visualizations [KBK11,LYK∗ 12] can be overlaid to highlight the evolution of entities over time (design goal G1). D3. Arcs are used to connect related entities. The forces applied on the arcs bring connected entities closer together on the vertical axis (design goal G2). Force-directed layouts are very useful in highlighting cluster structure without requiring the use of additional clustering algorithms. Furthermore, by bringing connected entities together we reduce the crossings between arcs of different temporal clusters (design goal G3). Overall, TimeArcs can be considered a hybrid visualization that arranges CloudLines vertically in order to highlight the evolution of entities over time. The CloudLines are pulled closer together if these entities are connected at some time points using a force directed layout. Finally, arc diagrams are used to connect related entities at each time point. Additional optimization strategies augment our design choices and generate visual output that is both more aesthetically pleasing and more legible. In TimeArcs, entities that appear closer together vertically are considered to be more related than entities at a distance from each other. The relatedness between entities is defined by: (1) the total number of connections at different time points, such as those that are between terms mentioned together multiple times; and (2) the weight (and strength) of the connections at particular points, such as those that are between terms mentioned together many times on a particular day (consequently connected by a thicker and stronger arcs). We apply these factors onto the force-directed layouts to maximize the neighborhood of more related entities. Since each entity in TimeArcs is represented as a straight line, an entity label can appear anywhere along this line. For example, an entity label can appear where the entity is frequently mentioned or where the entity is highly connected. After selecting the intended location for an entity label, we check if there are any self-occlusions between texts and arcs of the same entity. If there are, we continue moving the label to the left until we find a position without self occlusions. Notice that this strategy removes any self-occlusions of individual entities but does not guarantee the removal of all occlusions in the graph. To guarantee the removal of all occlusions, we can move all of the text labels to the left of the layout. An entity label can be drawn repeatedly at different points along the time axis in order to reduce tracing time from users.
4. Computing the TimeArcs Visualization In this section we describe the primary components of the TimeArcs visualization (also depicted in Fig. 2). These include the main components for computing the visual elements that represent the temporal evolution and relationships of ranked entities, as well as the interactive elements to facilitate different ways of filtering by time or search terms: • Computing the evolution of entities: This step counts the frequency of occurrences of entities at each time point across the entire temporal range and subsequently ranks them (Section 4.1). • Computing the relationship of ranked entities: This step determines the relationship between entities. Two entities are considered to be related if they are collocated within the same contexts (Section 4.2). • Selecting highly connected entities: This step identifies important entities among the highly ranked entities in the network (i.e., nodes that have high degree of centrality) and highlghts them in the visualization. (Section 4.3). • Filtering entities: This step facilitates user-driven filtering to interactively explore details of the data. TimeArcs supports multiple ways to filter entities, such as filtering by time, or by a search term. Entity ranking and entity relationships are recomputed based on filtering conditions (Section 4.4).
Figure 2: A schematic showing the main components of TimeArcs: computing the evolution of input entities, computing the relationships of ranked entities, selecting highly connected entities, and filtering entities.
4.1. Computing the Evolution of Entities Input entities are available from input files, such as names of authors in publications, or actors in movies. However, in other cases, we need to preprocess the data to generate these entities, such as frequent terms/phrases extracted from documents/blogs/news. In such cases, we performed named-entity recognition on the text documents, which allowed us to identify names of people, places, organizations and miscellaneous and calculated their frequencies and cooccurrence afterwards. Fig. 3 illustrates two typical examples of entity evolution visualizations: stacked graphs and small multiples. The data c 2016 The Author(s)
c 2016 The Eurographics Association and John Wiley & Sons Ltd. Computer Graphics Forum
T.N. Dang et al. / TimeArcs: Visualizing Fluctuations in Dynamic Networks
for these graphs were retrieved from political blogs in the 10-year period from 2005 to 2015. The top 50 terms that appeared in these blogs are highlighted by category: green for person, red for location, blue for organization, and yellow for miscellaneous. Primary benefits of using a stacked graph include its compactness and its ability to providing a comprehensive overview. Small multiples make it easier to trace and compare the evolutions of different terms over time (design goal G1).
more significant than the term “Obama” even though the frequency of “Ebola” at time t is relatively small compared to that of “Obama.” This measure aims to detect entities which suddenly draw a lot of attention (and are usually connected with a particular event in the time series) rather than entities which are more consistently popular. 4.2. Computing the Relationships between Entities This step computes the relationships between pairs of entities. In applications where the set of entities is large, such as the number of actors in IMDB database or the number of terms/phrases extracted from political blogs (our algorithm extracted 418,641 terms from 90,811 blogs spanning 10 years), computing relationships between all pairs is computationally expensive. We therefore rank the input entities based on their frequency or sudden attention score and only compute the relationships between highly ranked entities, for example, only the 1,000 top-ranked entities. The relationships between entities are defined differently in various applications. In researcher collaboration networks, two researchers are related if they are co-authors of the same papers while in a “money trail” inspection, two people are related if they communicate by phone or email or if they transfer money. The strength of a relationship is computed based on the number of collocations of two entities at a particular time point and encoded in our visualization by the thickness of the link connecting the two entities.
Figure 3: Popular techniques to visualize entity evolutions: (a) stacked graph and (b) small multiples. Here, entities are terms extracted from political blogs and color-coded by category: green for person, red for location, blue for organization, and yellow for miscellaneous data. The two above graphs are implemented in D3.js. In addition to showing the frequency data of entities over time, we propose the use of time series features to discover terms associated with events within the time series, such as sharp increases or drops [SJA∗ 06, DW13], the sudden increase followed by a sudden drop [BAP∗ 05], and serial periodicities [CK98]. In particular, we define a sudden attention measure for entities, referring to a sharp increase in frequency. Let F1 , F2 , . . . , Fn be the frequency of an entity at n different time points. Instead of ranking an entity based on its raw time series (F1 , F2 , . . . , Fn ), we derive the sudden atten(F +1) tion series (A1 , A2 , . . . , An ): At = (F t +1) . For example, the t−1 frequency of the term “Obama” at time t − 1 is 99 (or Ft−1 = 99) and at time t is 199 (Ft = 199). Then the attention of term (F +1) “Obama” at time t is Ai = (F t +1) = 200 100 = 2. As another t−1 example, the frequency of the term “Ebola” at time t − 1 is 0 (or Ft−1 = 0) and at time t is 10 (Ft = 10). Then the atten(F +1) tion of term “Ebola” at time t is Ai = (F t +1) = 11 1 = 11. t−1 Therefore at time t, the term “Ebola” is considered much c 2016 The Author(s)
c 2016 The Eurographics Association and John Wiley & Sons Ltd. Computer Graphics Forum
4.3. Selecting Highly Connected Entities Among highly ranked entities, we further identify and select the most highly connected entities. In other words, we want to include nodes with a high degree of centrality in the network. In social networks, nodes with a high degree of centrality represent the most influential people. Fig. 4 shows an example of most influential authors in the IEEE VIS in the last five years. In particular, each graph is a snapshot of collaboration between these researchers in one year. We keep the nodes in the same positions and fade out unconnected nodes to help the viewer see the differences between these five snapshots. However, when the number of nodes and/or the number of snapshots increase, visualizing the dynamics of the network becomes difficult. Using TimeArcs, we combine the five force-directed layouts into one. Besides the forces applied on links to pull connected entities together, we add two more kinds of forces into the layout: (1) Pull vertices representing the same entity at different time points to the same horizontal line, thus maintaining the mental association a user would create between line and entity (design choice D2); (2) Pull and align vertices onto the middle vertical line to resolve any inconsistency between different clusters at multiple time steps. Finally, vertices are pinned to their corresponding horizontal coordinate on the time axis (to ensure design choice D1).
T.N. Dang et al. / TimeArcs: Visualizing Fluctuations in Dynamic Networks
Figure 4: Visualizing the IEEE VIS publication co-authorship network of the top 50 researchers between 2010 and 2014.
Fig. 5 shows TimeArcs applied to the same data as seen in Fig. 4.
“Munzner, T.” from 1995 to 2014. In this visualization, we have ordered entities by the time when they are first connected to the search entities (along with other constraints in TimeArcs layout). This ensures that arcs appearing first have a smaller distance to the focused entity (“Munzner, T.” in this case) than the ones appearing after to avoid crossings (design goal G3). Thicker arcs connect researchers having multiple publications with “Munzner, T.” in one year. Notice that “Tory, M.” (in the highlighted box) had multiple publications with “Munzner, T.” in 2003, 2007, 2010, and 2013.
Figure 5: The TimeArcs visualization applied to the IEEE VIS publication co-authorship network of the top 50 researchers from 2010 to 2014 (i.e., the same data in Fig. 4).
Figure 6: Visualizing collaboration networks for “Munzner, T.” over the past 20 years (green for the InfoVis conference, red for VAST, and blue for SciVis).
4.4. Filtering Entities
5. Applications
TimeArcs additionally supports multiple ways to filter data, including: (1) filtering connections by strength, (2) filtering by a time interval, and (3) focusing on a specified entity. As depicted in the TimeArcs schema (Fig. 2), once users apply a filtering condition, both the ranking of entities and the entity relationships need to be recomputed. For example, when users input a new search term using a dataset of news items, term frequencies and their co-occurrences are recomputed based on the articles containing that search term. When users search for the collaborations of researchers within a different range of years (using the co-authorship network), the degree of centrality of the vertices in the network may change completely and thus need to be recomputed.
To demonstrate the usefulness and effectiveness of the TimeArcs visualization, we describe its application to three different datasets: one containing blog postings about political events, the IMDB co-star database, and a biomedical database providing evidences in the literature of protein interactions.
Fig. 6 shows an example of the collaboration networks of
5.1. Exploring Topics and Events in Political Blogs We collected 90,811 political blog posts over a ten-year period from 2005 to 2015 from seven different sources, including AMERICAblog, Huffington Post, and ProPublica. We then ran text analysis on these blogs and generated terms that were classified into four different categories. These terms c 2016 The Author(s)
c 2016 The Eurographics Association and John Wiley & Sons Ltd. Computer Graphics Forum
T.N. Dang et al. / TimeArcs: Visualizing Fluctuations in Dynamic Networks
were then input into TimeArcs. We first computed the sudden attention measure (see Section 4.1) for each term and then to computed the relationships between the top 1,000 terms. We filtered relationships of strength at least 15 (i.e., terms that were mentioned together in at least 15 blogs in one month). Finally, the top 100 terms with a high degree of centrality were plotted in the layout depicted in Fig. 7. This layout provides an overview of major political events in the past 10 years in one display. In Fig. 7, notably, the name “Petraeus” appears at two different time points (Box A and Box B). In Box A, the term “Petraeus” is connected with “Baghdad” when he (Petraeus) was the Commanding General in the Iraq War during the troop surge of 2007. Box B highlights his involvement in 2012 Benghazi attack. We can also easily see the repeated pattern of two entities in box C. The term “Edward Snowden” and “NSA” suddenly became highly correlated when he (Snowden) was the principal source of disclosures about top-secret National Security Agency programs in June 2013 [GBM13]. The relation fades out within a year. Viewers can read related blogs by mousing over a term or relationship.
5.2. Finding Patterns in the IMDB Co-Star Network The data is available on IMDB website‡ . We went through 9,963 movies rated 8 stars or higher from 1980 to 2014 across three genres: comedy, action, and drama. In total, our dataset contained 66,182 actors. Fig. 8 shows TimeArcs for the top 200 actors. In particular, the arcs connect co-actors in the same movies. In this use case, we color the arcs by movie genres: green for comedy, red for action, blue for drama. TimeArcs helps viewers to quickly identify temporal communities of actors. Each horizontal line represents one actor and connects his or her first through last appearances in highly rated movies. This helps to highlight actors with long careers and many good movies, such as, for example, the voice actor Michael Bell (at the red arrow in Fig 8). The horizontal lines can be replaced by CloudLines-style graphs on demand. By brushing any actors’ name, we can immediately visualize his or her co-star network to see how it changes over time. Continuously repeated cliques of actors (as in the highlighted boxes A, B, and C of Fig. 8) usually indicate that they have appeared together in multiple seasons of a television series. For example, Box B shows “The Chaser Election Specials”, an Australian comedy TV series which appeared in 2001, 2004, 2007, and 2010. Box A highlights Marin Mandir’s movies, such as “Police, Follow that Car” (2001) and “Facebook dvojnik” (2012). Marin Mandir also acts in his own movies. Box C contains shows “ReBoot”, an
‡ http://www.imdb.com/interfaces c 2016 The Author(s)
c 2016 The Eurographics Association and John Wiley & Sons Ltd. Computer Graphics Forum
Figure 7: Overview of political events in the past 10 years using TimeArcs. The top 100 terms were selected based on their sudden attention and degree centrality. Terms are color-coded by category: green for person, red for location, blue for organization, yellow for miscellaneous category.
action-adventure television series that originally aired from 1994 to 2001. Though by default we initially limit our visualization to the top 200 actors, we can easily add more entities into the visualization, similar to the way items are added into a spreadsheet. This avoids text occlusion that can occur in standard force-directed layouts. Simple mouse scrolling can help users to navigate through the list easily, an advantage of laying entities vertically. 5.3. Evidence in Biological Pathway Literature In this case study, we explore evidences from the biomedical literature describing protein interactions, retrieved from the Pathway Commons database§ . The data contains the publication information (such as publication year, author, and textual evidence) of interactions between pairs of proteins, as well as their specific interaction type. Fig. 9 shows new discoveries in protein interaction networks from 2002 to 2014. An arc connects two proteins at the times when the interaction was jointly described in a publication together. The colors encode interaction types: green for adds_modi f ication, red for removes_modi f ication, blue for translocation, orange for binds, and pink for increases. A thicker black arc § http://www.pathwaycommons.org/
T.N. Dang et al. / TimeArcs: Visualizing Fluctuations in Dynamic Networks
tionality or that are often found together in a biochemical process.
Figure 9: Visualizing the publication of new discoveries in protein interaction networks from 2002 to 2014. The colors encode different types of biochemical interactions.
Figure 8: Visualizing the IMDB co-star network of the top 200 actors from highly rated movies from 1980 to 2014. Arcs connect co-stars and are colored green for comedy, red for action, and blue for drama. Boxes A, B, and C highlight actors who appear together in multiple seasons of a series.
When there are multiple arcs connecting two proteins, it falls into one of the two circumstances. If they have the same color, these arcs indicate that there is supporting evidence in different publications which confirm the interaction between two elements. On the other hand, if they have the different colors, the more recent appearance provides either more detailed knowledge about the interaction or shows a conflict between different articles regarding the way in which these proteins interact.
indicates multiple interactions between two proteins that were discussed jointly in the same year. The horizontal lines connect multiple occurrences of the same proteins across different publications in different years. Clusters in the visualization tend to contain proteins which have similar func-
In Fig. 10, TimeArcs visualizes interactions between PCAF protein complex and other biomolecules. In particular, above the PCAF timeline we can see there is new evidence from 2013 that supports the interaction“PCAF binds p300 and KAT3A”, which was first discovered in 2011. Similarly under PCAF timeline, there are 3 later evidences supporting “PCAF binds MAML” in 2008, 2011, and 2013. On c 2016 The Author(s)
c 2016 The Eurographics Association and John Wiley & Sons Ltd. Computer Graphics Forum
T.N. Dang et al. / TimeArcs: Visualizing Fluctuations in Dynamic Networks
Figure 10: TimeArcs visualization for interactions around PCAF protein. (1), (2), and (3) in the figure are supporting evidences in literature of “PCAF binds MAML”.
these cases, users can use sliders to interactively filter out the weaker relationships between entities. To show all relationships between entities in dense dynamic networks, matrix representations, such as Matrix Cubes [BPF14] and MultiPiles [BHRD∗ 15], are more appropriate. 7. Conclusion
the other hand, in Fig. 11 TimeArcs depicts interactions between the OPSD protein and the K+ protein. Here we can see that the 2003 and 2012 publications are in conflict. Contradictorily, OPSD and K+ appear to both positively and negatively regulate each other.
Figure 11: TimeArcs visualization for interactions around OPSD protein. (1) and (2) are conflicting evidences of OPSD and K+ interaction in 2003 and 2012 publications.
6. Implementation and Scalability TimeArcs is implemented in D3.js. The application, source code, and sample data are provided via our GitHub project repository, located at https://github.com/ CreativeCodingLab/TimeArcs. The most computationally expensive algorithm in our application involves determining the relationship (connectivity) between entities. In the data preprocessing step, we store relations between entities in a hash map; therefore, the complexity of computing all relations between n selected entities is O(n2 ). TimeArcs can render thousands of entities in the browser without dipping below interactive rates. Please review the supplementary video (also available on the project’s GitHub repository) for an example showing TimeArcs applied to a dataset with thousands of entities. Since TimeArcs utilizes force-directed layouts as primary way to group related entities and minimize arc crossings, it thus shares some common features with it. (1) Gravity of the layout and repellents between vertices ensure that important vertices (having a high-degree of centrality) end up at the vertical center of the TimeArcs layout, while vertices with a low-degree centrality end up toward the top or bottom of the TimeArcs visualization. For example in Fig. 7, the term “Sarah Palin” is located in the center of both layouts while “Boston marathon” and “Dzhokhar Tsarnaev” are isolated and move away from the both centers. (2) TimeArcs is more suitable for sparser and fluctuating dynamic networks (which have temporal clusters changing over time). For denser graphs, force-directed layouts become “hairballs”. In c 2016 The Author(s)
c 2016 The Eurographics Association and John Wiley & Sons Ltd. Computer Graphics Forum
This paper presented TimeArcs, a novel visualization technique that facilitates the identification of temporal patterns of activity between collocated entities. The dynamics of these interconnected elements can be interactively investigated through simple mouse and keyboard interactions. A main contribution of the paper is our novel use of forcedirected layouts to automatically create temporal clusters that are constrained to horizontal regions across the display. We demonstrated TimeArcs on a diverse range of datasets, indicating its general usefulness across multiple domains. The technique is appropriate for data that has been explicitly preprocessed to identify relevant topics or categories, as well as for exploring a dataset in terms of particular facets inherent in the data itself. Here, our technique is presented primarily as a tool for the exploration of complex dynamics within temporal datasets. Future work will conduct user studies to provide empirical evidence on the effectiveness of the technique compared to earlier timeline-based techniques such as Massive Sequence Views [vdEHBvW13] and investigate how TimeArcs can be integrated in visual analytics application to aid in predictive textual analyses. Acknowledgments This work was funded by the DARPA Big Mechanism Program under ARO contract WF911NF-14-1-0395. References [APS14] A HN J.- W., P LAISANT C., S HNEIDERMAN B.: A task taxonomy for network evolution analysis. IEEE Trans. Vis. Comput. Graph. 20, 3 (2014), 365–376. 3 [BAP∗ 05] B UONO P., A RIS A., P LAISANT C., K HELLA A., S HNEIDERMAN B.: Interactive pattern search in time series. In Proc. SPIE (2005), vol. 5669, pp. 175–186. 5 [BBDW16] B ECK F., B URCH M., D IEHL S., W EISKOPF D.: A taxonomy and survey of dynamic graph visualization. Comput. Graph. Forum (2016). 2 [BBV∗ 12] B ECK F., B URCH M., V EHLOW C., D IEHL S., W EISKOPF D.: Rapid serial visual presentation in dynamic graph visualization. In Proc. IEEE Symp. on Visual Languages and Human-Centric Computing (2012), pp. 185–192. 2 [BBW12] B URCH M., B ECK F., W EISKOPF D.: Radial edge splatting for visualizing dynamic directed graphs. In Proc. Int. Conf. on Information Visualization and Applications (2012), pp. 603–612. 2 [BC02] B RANDES U., C ORMAN S. R.: Visual unrolling of network evolution and the analysis of dynamic discourse. In IEEE Symp. on Information Visualization (2002), pp. 145–151. 2
T.N. Dang et al. / TimeArcs: Visualizing Fluctuations in Dynamic Networks [BHRD∗ 15]
BACH B., H ENRY-R ICHE N., DWYER T., M AD T., F EKETE J.-D., G RABOWSKI T.: Small MultiPiles: Piling time to explore temporal patterns in dynamic networks. In Comput. Graph. Forum (2015), vol. 34, pp. 31–40. 3, 9 HYASTHA
[BN11] B RANDES U., N ICK B.: Asymmetric relations in longitudinal social networks. IEEE Trans. Vis. Comput. Graph. 17, 12 (2011), 2283–2290. 3 [BPF14] BACH B., P IETRIGA E., F EKETE J.-D.: Visualizing dynamic networks with matrix cubes. In Proc. ACM Conf. on Human Factors in Computing Systems (2014), pp. 877–886. 3, 9 [BVB∗ 11] B URCH M., V EHLOW C., B ECK F., D IEHL S., W EISKOPF D.: Parallel edge splatting for scalable dynamic graph visualization. IEEE Trans. Vis. Comput. Graph. 17, 12 (2011), 2344–2353. 2 [BW08] B YRON L., WATTENBERG M.: Stacked graphs – Geometry & aesthetics. IEEE Trans. Vis. Comput. Graph. 14, 6 (2008), 1245–1252. 3 [CK98] C ARLIS J. V., KONSTAN J. A.: Interactive visualization of serial periodic data. In Proc. ACM Symp. on User Interface Software and Technology (1998), ACM, pp. 29–38. 5 [CLT∗ 11] C UI W., L IU S., TAN L., S HI C., S ONG Y., G AO Z., Q U H., T ONG X.: TextFlow: Towards better understanding of evolving topics in text. IEEE Trans. Vis. Comput. Graph. 17, 12 (2011), 2412–2421. 3 [DGWC10] D ORK M., G RUEN D., W ILLIAMSON C., C ARPEN DALE S.: A visual backchannel for large-scale events. IEEE Trans. Vis. Comput. Graph. 16, 6 (2010), 1129–1138. 3 [DMF15] DANG T. N., M URRAY P., F ORBES A. G.: PathwayMatrix: Visualizing binary relationships between proteins in biological pathways. BMC Proceedings 9, 6 (2015), S3. 2 [DW13] DANG T., W ILKINSON L.: TimeExplorer: Similarity search time series by their signatures. In Proc. International Symp. on Visual Computing (2013), pp. 280–289. 5 [FAHL11] F ORBES A. G., A LPER B., H ÖLLERER T., L EGRADY G.: Interactive folksonomic analytics with the Tag River visualization. In IEEE Workshop on Interactive Visual Text Analytics (2011). 3 [GBD09] G REILICH M., B URCH M., D IEHL S.: Visualizing the evolution of compound digraphs with timearctrees. In Proc. Eurographics Conf. on Visualization (2009), pp. 975–990. 2
[KCH10] K IM N. W., C ARD S. K., H EER J.: Tracing genealogical data with timenets. In Proc. Int. Conf. on Advanced Visual Interfaces (2010), pp. 241–248. 3 [KEC06] K ELLER R., E CKERT C. M., C LARKSON P. J.: Matrices or node-link diagrams: Which visual representation is better for visualising connectivity models? Inf. Vis. 5, 1 (2006), 62–76. 2 [LWW∗ 13] L IU S., W U Y., W EI E., L IU M., L IU Y.: StoryFlow: Tracking the evolution of stories. IEEE Trans. Vis. Comput. Graph. 19, 12 (2013), 2436–2445. 3, 4 [LYK∗ 12] L UO D., YANG J., K RSTAJIC M., R IBARSKY W., K EIM D.: Eventriver: Visually exploring text collections with temporal references. IEEE Trans. Vis. Comput. Graph. 18, 1 (2012), 93–105. 4 [MD12] M C G EE F., D INGLIANA J.: An empirical study on the impact of edge bundling on user comprehension of graphs. In Proc. Int. Working Conf. on Advanced Visual Interfaces (2012), pp. 620–627. 4 [MKF∗ 15] M A C., K ENYON R. V., F ORBES A. G., B ERGER W OLF T., S LATER B. J., L LANO D. A.: Visualizing dynamic brain networks using an animated dual-representation. In Proc. Eurographics Conf. on Visualization (2015), pp. 73–77. 2 [Pur97] P URCHASE H. C.: Which aesthetic has the greatest effect on human understanding? In Proc. International Symp. on Graph Drawing (1997), pp. 248–261. 4 [RTJ∗ 11] R EDA K., TANTIPATHANANANDH C., J OHNSON A., L EIGH J., B ERGER -W OLF T.: Visualizing the evolution of community structures in dynamic social networks. In Proc. Eurographics Conf. on Visualization (2011), pp. 1061–1070. 3 [SJA∗ 06] S HMUELI G., JANK W., A RIS A., P LAISANT C., S HNEIDERMAN B.: Exploring auction databases through interactive visualization. Decis. Support Syst. 42, 3 (2006), 1521– 1538. 5 [SWL∗ 14] S UN G., W U Y., L IU S., P ENG T., Z HU J. J. H., L IANG R.: EvoRiver: Visual analysis of topic competition on social media. IEEE Trans. Vis. Comput. Graph. 20, 12 (2014), 1753–1762. 3 [TM12] TANAHASHI Y., M A K.-L.: Design considerations for optimizing storyline visualizations. IEEE Trans. Vis. Comput. Graph. 18, 12 (Dec 2012), 2679–2688. 3
[GBM13] G ELLMAN B., B LAKE A., M ILLER G.: Edward Snowden comes forward as source of NSA leaks. http:// www.washingtonpost.com, 2013. 7
[VBSW13] V EHLOW C., B URCH M., S CHMAUDER H., W EISKOPF D.: Radial layered matrix visualization of dynamic graphs. In Proc. Int. Conf. on Information Visualisation (2013), pp. 51–58. 2
[GFC05] G HONIEM M., F EKETE J.-D., C ASTAGLIOLA P.: On the readability of graphs using node-link and matrix-based representations: A controlled experiment and statistical analysis. Inf. Vis. 4, 2 (2005), 114–135. 2
[vdEHBvW13] VAN DEN E LZEN S., H OLTEN D., B LAAS J., VAN W IJK J.: Reordering massive sequence views: Enabling temporal and structural analysis of dynamic networks. In Proc. IEEE Pacific Visualization Symp. (2013), pp. 33–40. 2, 9
[GJS74] G AREY M. R., J OHNSON D. S., S TOCKMEYER L.: Some simplified np-complete problems. In Proc. ACM Symp. on Theory of Computing (1974), pp. 47–63. 2
[Wat05] WATTENBERG M.: Baby names, visualization, and social data analysis. In Proc. IEEE Symp. on Information Visualization (2005), pp. 1–7. 3
[HdF06] H ENRY N., D . F EKETE J.: MatrixExplorer: A dualrepresentation system to explore social networks. IEEE Trans. Vis. Comput. Graph. 12, 5 (2006), 677–684. 2
[XWW∗ 13] X U P., W U Y., W EI E., P ENG T.-Q., L IU S., Z HU J., Q U H.: Visual analysis of topic competition on social media. IEEE Trans. Vis. Comput. Graph. 19, 12 (2013), 2012–2021. 3
[HHWN02] H AVRE S., H ETZLER E., W HITNEY P., N OWELL L.: ThemeRiver: Visualizing thematic changes in large document collections. IEEE Trans. Vis. Comput. Graph. 8, 1 (2002), 9–20. 3
[YES10] Y I J. S., E LMQVIST N., S EUNGYOON L.: TimeMatrix: Analyzing temporal social networks using interactive matrixbased visualizations. Int. J. Hum. Comput. Int. 26, 11-12 (2010), 1031–1051. 2, 3
[KBK11] K RSTAJIC M., B ERTINI E., K EIM D.: CloudLines: Compact display of event episodes in multiple time-series. IEEE Trans. Vis. Comput. Graph. 17, 12 (2011), 2432–2439. 4 c 2016 The Author(s)
c 2016 The Eurographics Association and John Wiley & Sons Ltd. Computer Graphics Forum