1Department of Computer Science, University of Illinois at Chicago, USA. 2Department ... design that combines enhanced node-link diagrams and distance matrix layouts to assist ..... that it could help build a potential path between functionally.
Eurographics Conference on Visualization (EuroVis) (2015) E. Bertini, J. Kennedy and E. Puppo (Editors)
Short Papers
Visualizing Dynamic Brain Networks Using an Animated Dual-Representation Chihua Ma1 , Robert V. Kenyon1 , Angus G. Forbes1 , Tanya Berger-Wolf1 , Bernard J. Slater2 and Daniel A. Llano2
2 Department
1 Department of Computer Science, University of Illinois at Chicago, USA of Molecular and Integrative Physiology, University of Illinois at Urbana-Champaign, USA
Abstract Dynamic network visualization has been a challenging topic for dynamic networks analysis, especially for spatially embedded networks like brain networks. In this paper, we present an animated interactive visualization design that combines enhanced node-link diagrams and distance matrix layouts to assist neuroscientists in their exploration of dynamic brain networks and that enables them to understand how functional connections relate to the spatial structure of the brain. Our visualization also provides the ability to observe the evolution of a network, the change in the community identities, and node behavior over time. Categories and Subject Descriptors (according to ACM CCS): H.5.0 [Information Interfaces and Presentation]: General—
1. Introduction Social network analysis (SNA) has been presented as a useful approach to modeling neurobiology, helping neuroscientists explore their data in new ways. When applying SNA to brain networks, a node usually represents a sub-region of the brain, such as a single neuron or a group of neurons, while an edge represents a physical or functional connection between two nodes. Node-link diagrams and the matrix layouts are the two most common visual representations used for visualizing social networks. The node-link diagram is more useful for path finding tasks and tends to be more effective for small sparse graphs. Alternatively, the matrix representation is good for large dense graphs, and avoids the visual clutter associated with overlapping nodes and edges crossings [GFC05]. When applying SNA to the study of neural networks, both of these properties are desirable. Neuroscientists need to explore the functional connectivity within the brain and also to understand how this functional connectivity is related to its spatial structure. The node-link diagram efficiently models the spatial structure of the brain while the matrix layout can enable some tasks that are more difficult using a node-link diagram, i.e., finding the most-connected node or comparing the distance between nodes [HF06]. However, standard SNA is not sufficient for solving real world problems since most of the networks are dynamic in nature. In dynamic network analysis (DNA), detecting the c The Eurographics Association 2015.
DOI: 10.2312/eurovisshort.20151128
evolution of communities can reveal important changes in network structure over time. A dynamic community is defined as a time-series of sets of nodes that tend to interact with their home communities most of the time [Was94], and that do not change their home community affiliation too often [BHKL06]. To develop our visualization tool, we worked closely with neuroscientists at a large research university who use a dynamic community identification algorithm [BWTK10, TBW09] in the context of exploring the change in connections and community identities over time within the brain. According to the concept of dynamic community identification, each node (neuron) has two community identification codes: Home Community, identifying the community that the neuron belongs to; and Temporary Community, identifying the community that the neuron currently visits. Thus, there are four possible statuses for each neuron at a certain time step: 1) the neuron stays in its home community, 2) the neuron visits a temporary community, 3) the neuron is active but unobserved, and 4) the neuron is non-active. We interviewed neuroscientists to get a better understanding of their visual analytics needs. These neuroscientists have been analyzing time-series images from mouse brain slices in which neurons have relevant spatial relationships. Based on the conversation with our collaborators, we were able to identify four tasks that are of interest to them, and
74
Ma et al. / Visualizing Dynamic Brain Networks Using an Animated Dual-Representation
for which visualization tools are not readily available that fit their precise needs: Task 1: Discover how functional connections between neurons are related to their spatial layouts; Task 2: Explore metrics related to the path between indirectly connected neurons (such as distance). Task 3: Explore how the network structure (i.e., brain connectivity) changes over time; Task 4: Track the change of community identities over time. In this paper, we present an animated dual-representation consisting of both representations, following the idea of Henry and Fekete [HF06]. Based on the analysis of the tasks for effective analytics of dynamic brain networks, we create an interactive prototype that combines what we call “enhanced” node-link diagrams that incorporates information about community status with a matrix representation. This dual-representation of the brain network features the use of integrated animated transitions to explore the dynamics of brain networks as they change over a series of time steps. Our visualization allows the operator to use the matrix view or the node-link view as a controller when exploring the brain network structures in the other view. Feedback from a domain scientist illustrates how this visualization can aid neuroscientists in exploring the evolution of communities and behaviors of individual nodes in small dynamic brain networks.
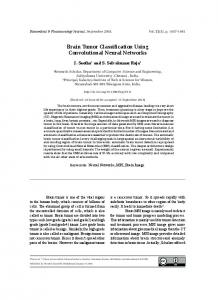
rize visualization techniques for dynamic graphs. Khairi et al. [RTJ∗ 11] and Vehlow et al. [VBAW14] work on visualizing the evolution of communities within dynamic networks. Although a number of dynamic networks visualizations exist, none is effective for our goal, which is to integrate spatial and non-spatial features of dynamic networks for the tasks defined above. 3. Visualization Design Our visualization design provides an interactive exploration of dynamic networks within the brain using a integrated combination of an enhanced animated node-link diagram along with an animated distance matrix representation. Again, our main goal in developing this tool is to help neuroscientists understand: how the functional connections in the brain change over time, how the community identities of neurons change over time, and to help promote an understanding of how these connections and community identities are related to the spatial structures of the brain. Figure 1 shows a screenshot of our visualization, containing the coordinated views of the node-link diagram and the matrix layout, along with a timeline-based graph.
2. Related Work Useful tools for visualizing brain connectivity have been introduced, including BrainNetVis [CSTT11] and BrainNet Viewer [XWH13]. In addition, several novel visualization techniques have been introduced. Al-Awami et al. [HAAB∗ 14] investigate a subway map metaphor for visualizing nanoscale neural connectivity in their NeuroLines technique. Sorger et al. [SBS∗ 13] introduce neuroMap to render the brain and its interconnections. Alper et al. [ABHR∗ 13] compare an augmented node-link with adjacency matrix visualizations to explore effective ways to visualize brain connectivity data. Ghoniem et al. [GFC05] state that the matrix-based visualization outperforms the nodelink diagram on most tasks, except for pathfinding tasks. Henry and Fekete present MatLink [HF07], an enhanced matrix-based graph visualization that has significant advantages for path-related tasks. They also implement MatrixExplorer [HF06], consisting of two parallel representations that provide users with the freedom to choose the most suitable representation for a task. In visualizing dynamic networks, Moody et al. [MMBd05] introduce techniques for temporal representations, and Forbes et al. [FHL10] introduce a framework for dynamic data visualization. Gephi [BHJ∗ 09], a visualization tool, allows a user to “play” a dynamic network as a movie sequence. Both Archambault et al. [APP11] and Ghani et al. [GEY12] discuss the use of animation for visualizing dynamic graphs. Bach et al. [BPF14] presents a Matrix Cube representation that maps time to a third dimension. More recently, Beck et al. [BBDW14] summa-
Figure 1: Screenshot of our visualization tool showing the coordinated dual-representation of dynamic network data. Here we show calcium imaging data obtained from 40 cells in the mouse thalamus at a particular time step. 3.1. Enhanced Node-link Diagram For spatially embedded networks like brain networks, the node-link diagram is considered to be more intuitive compared to other representations when exploring the relationship between spatial structures and network structures. The layout of the node-link diagram is based on the actual physical structure of the nodes. As described in Section 1, we visualize the four states of a node using what we are called the “Square-Circle” model, using a glyph that is made up of colored circle surrounded by a colored square. The color of the circle represents Home Community, while the color of the square shows the node’s Temporary Community (Figure 2). c The Eurographics Association 2015.
Ma et al. / Visualizing Dynamic Brain Networks Using an Animated Dual-Representation
75
Figure 2: Four possible status: (a) stay (b) visit, (c) unobserved, and (d) non-active. Since the physical structures of the brain do not change over time, the positions of nodes in the node-link diagram are fixed. We use animation to visualize how the connections between nodes and the community identity of the nodes change over time. However, one weakness of the animation is that the user has to memorize the previous state if they want to compare two time steps. We employ a technique, inspired by Alper et al. [ABHR∗ 13], that encodes the information of the previous state in the Square-Circle representation as transitions. The upper part of the Square-Circle representation shows the state in the previous time step, while the lower part shows its state in the current time step. Figure 3 lists all the possible cases for a node displaying both its home and temporary community identifications across two time steps, offering a clear way to see the transitions over time. The enhanced node-link diagram with animation is designed mainly for tasks 1, 3, and 4.
Figure 3: All the possible cases showing the transitions of community identification between two time steps.
Figure 4: Snapshots at three different time steps with three representations: node-link diagrams (left), adjacency matrices (middle), and distance matrices (right). the adjacency matrix. The distance is encoded by a gradient color in the distance matrix. The darker the cell, the shorter the distance. We see an edge between node C and node E appears at time t, which does not exist at time t − 1. Correspondingly, in both of the matrix representations, the change of the color of the cell at the intersection of node C and node E indicates the decrease in distance between C and E. However, the change of the distance between node A and node E cannot be retrieved from the adjacency matrices since node A and node E are not neighbors.
3.2. Animated Distance Matrix
Figure 5: (a) The distance decreases from time t − 1 to t, (b) the distance increases from time t − 1 to t, and (c) no changes.
Adjacency matrices are often used for the analysis of dense networks. However, one weakness of the adjacency matrix is that it only shows the direct connection between two nodes. To better understand how nodes connect with each other (directly or through other nodes) in dynamic networks we use the distance matrix instead of the adjacency matrix for task 2, and we map time using animation to show the change of the distances between two nodes over time.
To reveal the change of the distance between two nodes across two time steps, we use the idea of inner and outer squares division [ABHR∗ 13]. Figure 5 presents three examples of these transitions. With this representation, the user can easily tell if a node chooses a different path to connect another node, as in Figure 5 (a) and (b). Figure 5 (c) indicates the distance does not change.
Figure 4 shows a simple example of a dynamic network consisting of five nodes with fixed positions at three time steps. They are visualized using node-link diagrams on the left, adjacency matrices in the middle, and distance matrices on the right. An edge is encoded by a colored cell in c The Eurographics Association 2015.
3.3. Interaction When interacting with the nodes and edges in the distance matrix, the node-link diagram is synchronized by selection. Moving the mouse over the circles on the top or left of the
76
Ma et al. / Visualizing Dynamic Brain Networks Using an Animated Dual-Representation
matrix highlights the corresponding node in both the matrix and node-link diagram. Clicking the circle draws only the edges between that node and its immediate neighbors in the node-link diagram. Clicking on a matrix cell draws only the shortest path between the two nodes that intersect at the cell. if the inner color of the selected cell is different from its outer color, the current shortest paths are drawn in black and previous shortest paths in red. Clicking on a node in the node-link diagram has the same effect as interacting with the node in the distance matrix. In addition, the user can drag a node around to avoid overlapping with other nodes. Play/Pause/Stop buttons are used for operating the animation. A time slider provides users the option to jump to a particular time step based on the information gained from the timeline graph below it. The timeline graph plots the total number of edges in the network over time by default. It is used to instead plot the number of neighbors of a certain node over time when a node is selected, or plots the change of distance over time when a pair of nodes is selected. The on-line version of our visualization tool can be found at http://brainviz.github.io/DyNetViz.
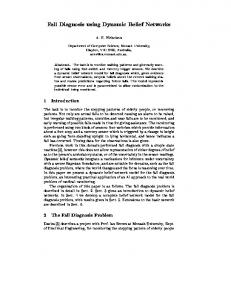
green community connects neuron 32 in the red community through two neurons at current time, one of which stays in the green community currently but stays in the red community at previous time. After using the visualization tool, the neuroscientist found the node-link view to be useful in identifying the other nodes that are functionally connected to an index node. The main utility in the node-link diagram is in its ability to show correlated cell activity at various locations linking cell responses and morphology and to show how this activity is functionally connected to other cells in known locations. He found that the Square-Circle model is also useful to see transitions over time. The value in seeing the transition is that it may assist the neuroscientist to determine if the network is changing functional connectivity with respect to a stimulus or to a behavior. However, he indicated that the helpfulness of the matrix view is weaker compared to the node-link view, though admitting that this may partly be due to his unfamiliarity with this kind of network representation. He points out that the distance could be useful to the extent that it could help build a potential path between functionally distant nodes. Nonetheless, we were pleased by this initial, mainly positive response which indicates some potential for coordinated, animated views for the application of SNA to dynamic networks in the domain of neuroscience. 5. Discussion and Future Work
Figure 6: In (a) the red edge shows the red node (32) and green node (13) connecting through an intermediate neuron at t − 1. The black lines indicate the connectivity at t. (b) shows the intersection of the two neurons (the circled cell). (c) plots the distance between the two neurons over time. 4. Case Study To validate the usefulness of our visualization design, we asked our neuroscientist collaborator to use the visualization tool to study his domain data and collected feedback on its current and potential utility. Specifically, we were interested in knowing if our visualization techniques can help neuroscientists to analyze domain problems related to our identified tasks more effectively. The neuroscientist used calcium imaging data obtained from 40 cells in the mouse thalamus (as shown in Figure 1). The thalamic cells were stimulated synaptically by placing an electrode in the auditory midbrain. Figure 6 (a) shows the connections between neuron 13 and neuron 32 at two time steps when clicking on the intersection (the circle cell) of the neurons in the distance matrix in Figure 6 (b). We can see that neuron 13 in the
Our visualization design is effective for small networks containing less than 100 neurons. When scaling to larger datasets, we plan to let the user interactively investigate subnetworks of interest. We found that animation is effective to show change over time, at least in small networks; it provides an overview of the evolution of networks and communities which enables neuroscientists to identify critical time steps. Future work will evaluate the use of animation in more complex scenarios. Although the half Square-Circle glyph is currently used to show the changes between two consecutive time steps, we plan to provide users with the ability to choose any two time steps for comparison in the future, which could also mitigate some of the issues with perceiving information via animation. Currently the distance matrix is ordered arbitrarily by a neuron ID number. A future improvement is to develop effective matrix ordering algorithms that enable the user to order the matrix by a particular statistic, such as node degree, node consistency, or the size of community. In this paper we presented an interactive visualization system consisting of coordinated node-link diagrams and distance matrices for visualizing dynamic brain networks. With this visualization, a user can observe the simultaneous evolution of both the communities in the networks over time as well as the behavior of individual nodes,. revealing the relationship between the spatial structures of the brain and their functional connectivity. Feedback from a domain scientist indicate that our technique enables researchers to gather visual evidence, generate new hypotheses, and more effectively explore their data. c The Eurographics Association 2015.
Ma et al. / Visualizing Dynamic Brain Networks Using an Animated Dual-Representation
References [ABHR∗ 13]
A LPER B., BACH B., H ENRY R ICHE N., I SEN T., F EKETE J.-D.: Weighted graph comparison techniques for brain connectivity analysis. In Proceedings of the SIGCHI Conference on Human Factors in Computing Systems (2013), ACM, pp. 483–492. 2, 3 BERG
[APP11] A RCHAMBAULT D., P URCHASE H. C., P INAUD B.: Animation, small multiples, and the effect of mental map preservation in dynamic graphs. Visualization and Computer Graphics, IEEE Transactions on 17, 4 (2011), 539–552. 2 [BBDW14] B ECK F., B URCH M., D IEHL S., W EISKOPF D.: The state of the art in visualizing dynamic graphs. In Proceedings of the Eurographics Conference on Visualization (EuroVisâA˘ Z´ 14)– State of The Art Reports (2014). 2 [BHJ∗ 09] BASTIAN M., H EYMANN S., JACOMY M., ET AL .: Gephi: an open source software for exploring and manipulating networks. ICWSM 8 (2009), 361–362. 2 [BHKL06] BACKSTROM L., H UTTENLOCHER D., K LEINBERG J., L AN X.: Group formation in large social networks: membership, growth, and evolution. In Proceedings of the 12th ACM SIGKDD international conference on Knowledge discovery and data mining (2006), ACM, pp. 44–54. 1 [BPF14] BACH B., P IETRIGA E., F EKETE J.-D.: Visualizing dynamic networks with matrix cubes. In Proceedings of the 32nd annual ACM conference on Human factors in computing systems (2014), ACM, pp. 877–886. 2 [BWTK10] B ERGER -W OLF T., TANTIPATHANANANDH C., K EMPE D.: Dynamic community identification. In Link Mining: Models, Algorithms, and Applications. Springer, 2010, pp. 307– 336. 1 [CSTT11] C HRISTODOULOU E. G., S AKKALIS V., T SIARAS V., T OLLIS I. G.: Brainnetvis: an open-access tool to effectively quantify and visualize brain networks. Computational intelligence and neuroscience 2011 (2011). 2 [FHL10] F ORBES A. G., H OLLERER T., L EGRADY G.: Behaviorism: A framework for dynamic data visualization. Visualization and Computer Graphics, IEEE Transactions on 16, 6 (2010), 1164–1171. 2 [GEY12] G HANI S., E LMQVIST N., Y I J. S.: Perception of animated node-link diagrams for dynamic graphs. In Computer Graphics Forum (2012), vol. 31, Wiley Online Library, pp. 1205– 1214. 2 [GFC05] G HONIEM M., F EKETE J.-D., C ASTAGLIOLA P.: On the readability of graphs using node-link and matrix-based representations: a controlled experiment and statistical analysis. Information Visualization 4, 2 (2005), 114–135. 1, 2 [HAAB∗ 14] H ADWIGER M., A L -AWAMI A., B EYER J., S TRO BELT H., P FISTER H., K ASTHURI N., L ICHTMAN J.: Neurolines: A subway map metaphor for visualizing nanoscale neuronal connectivity. 2 [HF06] H ENRY N., F EKETE J.-D.: Matrixexplorer: a dualrepresentation system to explore social networks. Visualization and Computer Graphics, IEEE Transactions on 12, 5 (2006), 677–684. 1, 2 [HF07] H ENRY N., F EKETE J.-D.: Matlink: Enhanced matrix visualization for analyzing social networks. In Human-Computer Interaction–INTERACT 2007. Springer, 2007, pp. 288–302. 2 [MMBd05] M OODY J., M C FARLAND D., B ENDER - DE M OLL S.: Dynamic network visualization1. American Journal of Sociology 110, 4 (2005), 1206–1241. 2 c The Eurographics Association 2015.
77
[RTJ∗ 11] R EDA K., TANTIPATHANANANDH C., J OHNSON A., L EIGH J., B ERGER -W OLF T.: Visualizing the evolution of community structures in dynamic social networks. In Computer Graphics Forum (2011), vol. 30, Wiley Online Library, pp. 1061– 1070. 2 [SBS∗ 13] S ORGER J., B UHLER K., S CHULZE F., L IU T., D ICK ˘ Tinteractive ˇ SON B.: neuromapâA graph-visualization of the fruit fly’s neural circuit. In Biological Data Visualization (BioVis), 2013 IEEE Symposium on (2013), IEEE, pp. 73–80. 2 [TBW09] TANTIPATHANANANDH C., B ERGER -W OLF T.: Constant-factor approximation algorithms for identifying dynamic communities. In Proceedings of the 15th ACM SIGKDD international conference on Knowledge discovery and data mining (2009), ACM, pp. 827–836. 1 [VBAW14] V EHLOW C., B ECK F., AUWÄRTER P., W EISKOPF D.: Visualizing the evolution of communities in dynamic graphs. In Computer Graphics Forum (2014), Wiley Online Library. 2 [Was94] WASSERMAN S.: Social network analysis: Methods and applications, vol. 8. Cambridge university press, 1994. 1 [XWH13] X IA M., WANG J., H E Y.: Brainnet viewer: a network visualization tool for human brain connectomics. PloS one 8, 7 (2013), e68910. 2