interaction, like Facebook and Twitter, present new sites for the production, collection and ...... Special thanks to information designer Alessandro Brunetti.
Interface Methods Renegotiating relations between digital research, STS and the sociology of innovation Noortje Marres, Sociology, Goldsmiths, University of London Carolin Gerlitz, Media Studies, University of Amsterdam To appear in: Sociological Review, 20 February 2015
Abstract This paper introduces a distinctive approach to methods development in digital social research called “interface methods.” We begin by discussing various methodological confluences between digital media, social studies of science and technology (STS) and sociology. Some authors have posited significant overlap between, on the one hand, sociological and STS concepts, and on the other hand, the ontologies of digital media. Others have emphasised the significant differences between prominent methods built into digital media and those of STS and sociology. This paper advocates a third approach, one that a) highlights the dynamism and relative under-determinacy of digital methods, and b) affirms that multiple methodological traditions intersect in digital devices and research. We argue that these two circumstances enable a distinctive approach to methodology in digital social research – thinking methods as ‘interface methods’ - and the paper contextualizes this approach in two different ways. First, we show how the proliferation of online data tools or ‘digital analytics’ opens up distinctive opportunities for critical and creative engagement with methods development at the intersection of sociology, STS and digital research. Second, we discuss a digital research project in which we investigated a specific ‘interface method’, namely co-occurrence analysis. In this digital pilot study we implemented this method in a critical and creative way to analyse and visualise ‘issue dynamics’ in the area of climate change on Twitter. We evaluate this project in the light of our principal objective, which was to test the possibilities for the modification of methods through experimental implementation and interfacing of various methodological traditions. To conclude, we discuss a major obstacle to the development of ‘interface methods’: digital media are marked by particular quantitative dynamics that seem adverse to the methodological commitments of sociology and STS. To address this, we argue in favour of a methodological approach in digital social research that affirms its mal-adjustment to the research methods that are prevalent in the medium. 1. Introduction As John Law and others (2011) have argued, digital social media do not only enable new ways of organising social life, but also of analysing it. Popular technologies for social networking and interaction, like Facebook and Twitter, present new sites for the production, collection and analysis of social data (Beer & Burrows, 2007). But their increasing prominence in social life 1
also has methodological implications for social research (Savage, 2009; Rogers, 2013). To those seeking to take empirical advantage of social media platforms, it quickly becomes clear that such platforms do not present us with raw data, but rather with specially formatted information: social media data tend to be organised in ways that favour highly particular modes of analysis, such as the investigation of people’s ‘networks’, the ‘influence’ of actors, the ‘reach’ of content or the ‘currency’ of certain words at certain moments in time (Marres & Weltevrede, 2013; see also Gitelman, 2013). On the one hand, as social media enable social actors to engage through predefined activities, they render their activities analysable. On the other hand, social media mediate social activities through standardised data forms, which lend themselves to some forms of analysis and not others. Some of the ‘methodological biases’ of social media are fairly obvious, such as the way in which Facebook explicitly facilitates acts like friending, liking or submitting a complaint, but not contesting and critiqueing, and therebye favours a particular, highly partial type of social analysis (Gerlitz and Helmond, 2012; Bucher, 2012; Crawford and Gillespie, 2014). However, in this article we would like to discuss some more ambiguous and fluid forms of ‘methodological bias’ in social media research, and discuss their wider possible implications for social research. Social media research may call into question the relations between agencies of research, including those between its subjects and objects, as well as the assumed hierarchies between these agencies in social research. For example, when doing network analysis with Facebook, is it really the researcher that here ‘decides’ to use this method, or is this decision rather informed by the object of study with its associated tools and metrics? Insofar as they raise such questions, social media also invite us to consider in more detail the similarities and differences between the methods that are ‘built into’ online media, and our ‘own’ social research methods (Beer, 2012; Beer and Burrows, 2007; Marres, 2012). To continue the example highlighted above: How do the methods, measures and techniques of network analysis enabled by a for-profit technology company like Facebook compare to our ‘academic’ ways of analysing ‘socio-technical’ networks in social and cultural research (see on this point also Langlois and Elmer, 2012)? To pose such questions might be taken to confirm a distinction between ‘us’ and ‘them’ – between for-profit and not-for-profit forms of research, between academic and applied forms of data analysis, and knowledge-making more broadly. However, as
2
we have discussed in other work, social media research practices can equally be understood as a site where such known divisions of labour in social research are usefully opened-up for questioning (Marres, 2012; Rogers, 2009; Jirotka et al, 2013; Wouters et al, 2012). In this article, we like to take up this proposition in a particular way. Social media research, we suggest here, brings into focus a variety of methodological resemblances and affinities, which make solid boundaries within and beyond social research ever harder to establish. We are interested in both the similarities and differences between methods built into social media, popular online tools for data analysis and some of the techniques and methods that are currently practiced in sociological research (Beer, 2012; T. Venturini, 2010). Instead of fixing the provenance and purposes of methods, we suggest that digital research requires us to embrace their multifarious character. Hence, instead of asking what the capacities of social digital methods are, and deciding with which agendas they are and are not in alignment, we advocate experimental inquiry into what makes their deployment productive for social inquiry. By way of an example, we explore a particular method for the analysis of content dynamics, which is practiced both in sociological research as well as in other practices of online data analysis: issue mapping. Issue mapping can be loosely defined as the use of computational techniques for the detection, analysis and visualisation of public contestation over topical affairs (Marres, forthcoming; Marres and Rogers, 2005).1 The approach can be called inherently interdisciplinary, as it has been taken up and developed across the social sciences, computing as well as the more ‘applied’ contexts of advocacy research, digital journalism and design. The rise of digital social media has given a new impulse to issue mapping research, as the broad uptake of Facebook and Twitter across social and public life has been accompanied by a growing range of easy-to-use software tools for the analysis and visualisation of online data, which are amenable to issue mapping (see on this point also demoscience.org, and Gerlitz and Helmond, 2013). This includes freely available tools for the analysis and visualisation of live data, such as Infomous2 which
1
For an overview of recent case studies and recipes of issue mapping online, see the wiki www.issuemapping.net developed by ourselves as part of the ESRC-funded project Demonstrating the Relevance of Issue Mapping for Participatory Research. 2 http://infomous.com
3
creates bubble networks of issue terms or MentionMapp3, which shows hashtag popularity per location among others. One important feature of these data tools is that they invoke and ‘cross’ multiple analytic traditions: they implement measures of computational textual analysis and are not unlike the techniques of issue mapping developed in social and cultural research from the 1980s onwards. The prominence of such tools in our view points to a wider problematic: digital analytics invoke a methodological uncanny for social research. The tools mentioned above closely resemble the techniques and methods deployed in social inquiry, but we can certainly not call them ‘our own’. ‘Not our own’ because in second instance the methods built into popular tools often prove to have more alien disciplinary provenances, and to serve the objectives of digital platforms rather than those of research. This raises the following question: Should it be our aim to clear up the methodological ambiguities opened up by digital analytics, and differentiate between the journalistic, commercial, everyday, governmental use and the sociological implementation of these tools? Or is there something productive about these very resonances and suggested affinities? We will propose that there are decisive advantages to affirming the ambivalence of digital analytics – according to which data tools are both similar and different from sociological research techniques. We then develop a specific response to the methodological uncanny which we call ‘interface method’ and which focuses on embracing such ambiguities. We outline this approach below through a project of methods development in issue mapping online, in which we used a technique of computational textual analysis, ‘co-occurrence analysis,’ to map issues with Twitter. 2. Analysing ‘happening content’: the encounter between sociology, STS and digital research Recent debates about the implications of digitization for social research have focused on methods, and sociologists from various backgrounds have highlighted methodological affinities of various kinds between digital methods, broadly defined, and social research (Beer & Burrows, 2007; Latour, Jensen, Venturini, & Boullier, 2012; Ruppert, Law, & Savage, 2013; Rogers, 2013). Some of these authors have flagged that the methods that are currently built into 3
http://mentionmapp.com
4
professional and popular tools of digital analytics are not unlike the methods of network and textual analysis on which academic sociologists have long relied (Beer, 2012; Marres, 2012). Faced with these apparent affinities, some sociologists have insisted on the divergences between the analytical aims and objectives of digital analytics vis-à-vis classical sociological research (for a discussion see Savage and Burrows, 2007). In this article, we propose that this assumption of assumed divergence may hamper the further development of digital social inquiry, something which can become clear when we consider not the general debate about the “fate” of sociological methods in the age of digital analytics, but engage with more specific discussions about the fate of specific methods at the intersection of digital culture and sociology, such as those of issue mapping. As outlined in the introduction, with the label ‘Issue Mapping’ we refer to an interdisciplinary set of practices that have been developed across science and technology studies, sociology, journalism, activism, policy research and information visualisation, and which deploy computational methods for the detection, analysis and visualisation of topical affairs (Rogers & Marres, 2000; Venturini, 2010; Marres, in press). In applied social and political research, the approach draws on long-standing practices of ‘debate mapping’ – in which controversies or ‘current issues’ are communicated to publics through the visual representation of relevant actors, factions and discursive positions (for a discussion, see the Emaps blog4). In the social and political sciences, issue mapping builds further on the analysis of public controversies, an approach has been elaborated in political sociology (Chateauraynaud, 2009; Beck and Kropp, 2011) and science and technology studies (Latour, 2005; Collins and Pinch, 1998). In the latter field, methods of issue mapping facilitate the implementation of an empiricist, processual approach to studying the relations between society, technology, science and nature (see for a discussion, Marres forthcoming). By empirically tracing the emergence and unfolding of public controversies around issues like climate change, GM food and mobile phone antenna’s, the argument goes, we can gain insight into how social, scientific, technological and environmental entities are entangled in practice. Over the last ten years or so, digital methods have been taken up as key instruments for furthering the methodological and intellectual agendas of controversy analysis and issue mapping, as in research on the Social Life of Issues (Marres & Rogers, 2000, 4
http://www.emapsproject.com/blog
5
2005; see also Eklof and Mager, 2013) and the Mapping Controversies project (Latour, 2008; Venturini, 2010), as well as in work on “issue analytics” (Thelwall, Vann, & Fairclough, 2006). And much of this digital work has found its declared starting point in what are perceived to be special affinities between digital analytics and social methods. A variety of scholars in the social sciences have directed attention at a particular convergence between social methods and digital methods: both focus on the analysis of “happening content”. Perhaps most visibly, Bruno Latour and colleagues have proclaimed a strong resemblance between the ontologies of digital media and those of actor-network theory, an approach that in the words of Latour allows sociologists to ‘feed off controversies” in their efforts to describe the composition of society. In recent papers, Latour and colleagues (2012) have argued that digitization allows for the generalization of the methods of actor-network theory. Measures of network analysis figure centrally in this argument, as it is in the associationist principle – according to which entities can be defined by their relations to other entities – that Latour locates the convergence between digital platforms and ANT: this principle, in his account, is both central to the architecture of digital platforms which set out to create relations amongst people and digital objects, and to ANT. On this basis Latour and colleagues declare that a heterogeneous and dynamic ontology – a central assumption of actor-network theory as well as of controversy analysis – is now ‘hard-wired’ into the Web (Latour et al, 2012). Others seeking to develop issue mapping as a digital method, including ourselves, have equally posited affinities between digital and social methods – but here the perceived, general similarities provide an occasion to establish more specific, pertinent differences between social methods and digital methods for the analysis of dynamic content (Marres and Rogers, 2001; see also Thelwall et al, 2006). For example, computational methods of citation analysis and content analysis that have been deployed in social studies of science, technology and society from the 1980s onwards are remarkably similar to the methods of hyperlink analysis and computational linguistics that are central to the operations of digital platforms like Google and Twitter (Scharnhorst and Wouters, 2006; Brin and Page, 1998). However, as we already mentioned in the introduction, at the same time it is not very difficult to differentiate between the measures built into prevailing digital media platforms and related sociological methods for the study of networks and textual data. For instance, tools like Mentionmapp are focused on capturing which
6
actors are influential on Twitter at a given moment, while methods of content analysis developed in STS were precisely focused on detecting issues that were not (yet) popular but only just emerging as relevant (Callon et al, 1983). Furthermore, tools like Infomous and Mentionmap are focused on capturing which terms are most active in the present moment, while sociological research has long focused on longitudinal analysis, including on how the terms and categories that organise knowledge change over time (Bowker & Star, 2000; Uprichard, 2011). Such differences between the ‘logics’ of prominent digital platforms and social research methods informed earlier work by one of us on the online analysis of ‘issue networks’ (Marres and Rogers, 2000). While prevailing search engines (at the time) defined the relevance of a source in terms of the number of authoritative sources that link to it – what we dubbed ‘seeing stars’-, issue network analysis privileged thematic associations between sources on the Web – offering a theme-based or issue-specific measure of relevance. Generalizing somewhat, we could say that the analytics built into digital platforms tend to uphold actor-centred notions of reputation, for which issue-centred understandings of relevance developed in STS and sociology present an alternative (Marres & Rogers, 2008). However, while it is certainly important to recognize such differences between digital and social research methods, it also has its problems as a starting point for digital social research. The risk, briefly put, is that we end up essentializing the differences between the “methods of the medium” and “our own” methods, in ways that do not sufficiently appreciate the appropriability and instability of boundaries between digital and social research methods. In this paper we would therefore like to explore a third approach to navigating the methodological uncanny between methods of digital platforms and social research, one that does not so much fixate on establishing the similarities and differences between digital and social methods, but one that recognizes and affirms their relative instability and indeterminacy. A key characteristic of the methodological uncanny is, that it is not necessarily clear, which analytic purposes digital tools may serve, what research objectives they may align with or what disciplinary agendas they enact. One of us has previously characterised social research tools as ‘multifarious instruments’ which have the capacity to serve multiple purposes, which may not always be clearly distinguished, and which require some form of experimental test in order to be established (Marres, 2012). Harvey, Reeves and Ruppert (2013) have proposed that
7
socio-technical devices should not be understood as mere gadgets, but as “complex and unstable assemblages that draw together a diversity of people, things and concepts in the pursuit of particular purposes, aims, and objectives” (see also Van der Velden, ms). Accordingly, digital tools of data analysis may enable or ‘activate’ a variety of different agencies of research in different settings, and they may serve to enact a range of different forms of research, as well as political, for-profit and ethical agendas. Tools for the analysis of online content dynamics, it seems to us, may well fall in this category of multifarious instruments. While it is possible to identify specific similarities and differences between these tools and sociological research techniques, this does not mean that we can decide on formal grounds whether their analytic purposes are aligned, or not, as this equally depends on the context of use, and their particular deployment. With some adjustments, an aggregated approach like that assumed in MentionMapp may be adapted to enable longitudinal analysis (Uprichard, 2011). Indeed, much of the debate about digital methods in social media studies has focused on the possibility of the re-purposing of digital devices (Rogers, 2009). Sociologists have drawn attention to the instability and under-determinacy of digital research methods themselves, proposing notions such as plastic methods (Lury, 2012) and live methods (Back & Puwar, 2012). Multifarious purposes, furthermore, can equally be ascribed to social media platforms themselves, as the settings of these platforms change frequently, and they cater to a changing set of actors, having to interface and negotiate the multiple interests of divergent user groups, advertisers, third parties and developers (Langlois & Elmer, 2013). Both social media platforms and methods can then be characterized as ‘multi-valent’: they may serve a multiplicity of analytic and normative purposes which are not necessarily transparent, nor do they have to be realised at the same time, nor are they accessible to all actors involved (Gerlitz, 2012; Marres, 2011). Such a perspective further calls the notion of disciplinary provenance in digital research into question: If a tool can serve multiple purposes, it cannot be simply defined as a sociological tool or method, but can only become so through its deployment and in assembly with research questions, objectives and narrativation. In this paper we would like to push this debate about the dynamism of digital media and methods further by proposing that it enables a distinctive approach to methodology development in digital social research, which we call “interface methods”. We provisionally define interface
8
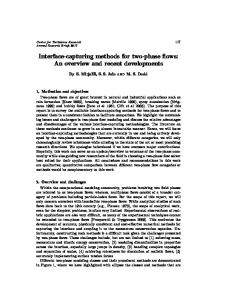
methods as emerging methods that we – as social and cultural researchers - can’t exactly call our own, but which resonate sufficiently with our interests and familiar approaches to offer a productive site of empirical engagement with wider research contexts, practices, and apparatuses.5 Appreciating the interfacing capacities of digital media and methods allows us to recognize their multifarious purposes and to experimentally determine the epistemic opportunities opened up by the methodological uncanny in digital research. However, rather than elaborating such a general definition of interface methods, we would like to develop our account of it by empirical means. 3. Co-occurrence as an interface method Let us return to the abovementioned online tools of data analysis and discuss what we understand as their ‘methodological uncannyness’ in more detail. Online tools for real-time data analysis like Infomous, do something broadly similar to some famous studies in the sociology of knowledge and innovation: they seek to detect what are emergent or ‘happening issues’ by analysing the changing relations between words in the live content of specific media platforms. Twitter Streamgraph is another freely available online software tool that enables the analysis and visualisation of Twitter data in so-called real-time. Enter ‘climate change’ and the Streamgraph will provide a curve of the activity associated with that word on Twitter over a specific period of time, visualised by way of a literal ‘stream’, which shows the key words and their frequency associated with the query term, ‘climate change’ (see Figure 1).
5
The term is partially derived from the work of Lucy Suchman (2005), Celia Lury (2004) and Alexander Galloway (2012), all of whom have drawn attention to interfaces as key sites for the negotiation of epistemic divisions of labour. As an in-between, interfaces allow for dynamics of multi-valence, in which tools, data and methods can be connected in various ways and to enable various analytic and normative purposes.
9
Figure 1: Twitter Streamgraph for keyword ‘Climate Change’
Twitter Streamgraph, like Infomous, then measures the ‘co-occurrence’ of terms in realtime – detecting which words prominently occur together in a selected media stream, in this case Twitter, and showing how these word relations change over time. In Infomous, when more words are significantly connected, a cluster takes shape; in the Streamgraph, the stream widens when more words occur together. Applying this measure of co-occurrence to detect ‘what’s happening’ these tools are not dissimilar to a method championed in STS, and more particularly, actor-network theory, namely co-word analysis. This method was developed in the 1980s by the sociologist of science, technology and society, Michel Callon and colleagues to detect emerging or innovative topics in the scientific literature (Callon et al., 1983; see also Danowski, 2009; Marres, 2012). Co-word analysis elaborates on a measure of textual analysis, ‘co-occurrence’, which detects which words occur together (in the same sentence, usually) in a given text. It detects word pairs - words that occur in each others’ vicinity - and assigns a value to the relation between these words based on the distance between them: a word distance of say 3, 4 or 5 words. It then proceeds by weighing these word relations by assigning them values in terms of both the proximity of co-occurrence and the quantity of connections (Callon et al, 1983; Danowski, 2009). This method was advocated by Callon and colleagues as a way of detecting the emergence of topics - or so-called “pockets of innovation” - in a corpus of texts. Co-word analysis, the argument went, makes it possible to detect changes in topical associations over time without 10
having to rely on previously defined categories, and their implied criteria of relevance. Co-word analysis manages this by rendering text amenable to network analysis, whereby empirically occurring associations among words in a giving data-set provide an immanent criterion of relevance. Arguably, in applying measures of co-occurrence to analyse live content, online tools for data analysis such as Infomous or Steamgraph offer a method not unlike that of the co-word method developed in the 1980s: in both cases the aim is to detect ‘happening topics’ by analysing word relations and their changes over time (see also Marres & Weltevrede, 2013). However, when scrutinizing the measures implemented in online data tools more closely, their similarity with the methods championed in the sociology of innovation appears rather less robust: online data tools measure only the frequency of words co-occurring as opposed to the strength of their connections. This focus on frequency is different from co-word analysis, which also detects the varying strength of the relations between words (based on their spatial proximity). However, rather than placing co-word and co-occurrence analysis “in their distinct and disciplinary place”, we want to emphasise that the very resonances between sociological methods and digital analytics techniques also open up a zone of undecideability, in which we can interrogate the characteristics and capacities of methods anew. Digital analytics equally provides an opportunity for us to reconsider the status of our “own” methods developed in the sociology of innovation, that of co-word analysis. On first sight, co-word analysis can appear a solidly sociological method. As mentioned, this method includes in a rudimentary form the core principle of what was later to be called “actor-network theory”: it is concerned with the detection of the changing relations between heterogeneous entities over time (Latour, 2005). However, co-word analysis does not necessarily “belong” to the sociology of innovation that was developed in Paris in the 1980s. A survey of a wider literature on co-word analysis reveals that this computational method has been taken up in fields as diverse as scientometrics, software engineering and communication studies (Coulter et al, 1998; Danowski, 2009). And in this literature co-word analysis is associated not just with the sociology of innovation, but equally with the more specialist and inter-disciplinary field of scientometrics. What is of critical importance for us, at this juncture, is that our ‘own’ methods come to appear rather less solidly anchored into familiar scholarly traditions. Online tools for
11
data analytics invoke a methodological uncanny: they resonate with methods that are familiar to us, but they equally remind us that we can’t exactly call these methods our ‘own’. Digital analytics tools highlight the multifarious provenance of social methods. However, when comparing digital techniques and social research methods, it will not do to consider only the formal features of analytic measures themselves. If we want to establish what these techniques are capable of, we also need to attend to the contexts of their application, to the different questions, concerns and aspirations they are used to address and to the modes of valuation they enable. As Weltevrede and Marres (2012) discussed, online data tools such as Infomous and Steamgraph address a highly specific context: they are part of the continuously evolving infrastructure that enables the real-time web and wider ‘update cultures’ which need to be continuously informed of ‘what is happening right now’. The tools are implicated in the valorisation of live content, popularity or ‘currency’: they are participants in a wider digital economy invested in real-time analytics (Back & Puwar, 2012). Here, what is of value is the detection of topical variation in the moment in which it occurs. The analytic context in which coword analysis sought to intervene in the 1980s was a different one: this method was designed to identify what Callon and colleagues called not only ‘pockets of innovation’ but also ‘dynamics of problematization’ (Callon et al, 1983). Rather than focusing on countable trends of the now, the aim was to detect the emergence of ‘happening’ research problems and topics at the intersection of disciplinary categories – innovations which went undetected in then predominant forms of scientometric analysis, like citation analysis. The attempt was to develop alternative metrics that could theoretically inform innovation policy. These contextual differences might help to shift our attention from the formal features of methods – from what they are – to how methods can become intellectually relevant through specific deployments. While frequency of co-occurrence seems a suitable indicator if the aim is to find out what is becoming current, the detection of “areas of problematisation” requires a more fine-grained sense of which terms are being brought into relation in new ways in a given area.. However, such contextual accounts of computational methods also suggests that such methods are not necessarily ‘transparent’. While tools like Infomous or Twitter Streamgraph are relatively straightforward in some regard – indeed, in presenting this work, on several occasions
12
statisticians in the audience pointed out that these measures are “basic”6 – they are at the same time part of an emerging analytic complex of practices, which are not necessarily straightforward. With their application of co-occurrence analysis, online data tools equip practices for the detection of what is becoming current, and as such, they participate in the valorization of ‘liveness’ (Lury, 2012; Lury & Wakeford, 2012): which word are currently popular on Twitter? Which news article gets the most links or retweets? Which actor is mentioned most often? This orientation arguably facilitates a distinct political economy of information – where value is derived from a quick, momentary expansion in the circulation of terms in the present moment (Bucher, 2012; Back & Puwar 2012, Hansen et al, 2011). For this reason, it seems naïve to us to define online tools for data analysis and visualisation purely in terms of the measures they implement. The context of implementation is at least as strong a determinant of ‘method’ as the implemented measures. We are dealing then not with ‘naked’ measures: data tools format analytic practice and in doing so contribute to what we have called methodological uncanny. We should actively interrogate these contexts of application: Can users delineate the data set or does the tool do that for them? When we query a given media stream for key-words, how does that limit the type of questions we can ask of it? (Crawford and boyd, 2012, Gerlitz and Rieder, 2013) Data tools make active contributions to the configuration of analytic practices through their sampling techniques, options for analysis and modes of visualisation, which in turn help to concretize regimes of valuation. This valuation is further informed by the questions asked and the ways in which results are reflected and contextualised. Taking into account the alignment of research objectives, data, tools, media and analytical purpose, we can conclude that digital research metrics can be called ‘thick’ provided we take the research context into account: they are propositions that suggest particular ways to equip, organise, and valuate practices and knowledges. While the measures built into online data tools are arguably rather ‘thin’ indeed, the socio-technical apparatus they enable – the detection of currency (for free!) - is much ‘thicker’: it integrates the analysis of live data into digital practices, and as such helps to realize
6
For us, this shed some interesting light on the obstacles that currently make it difficult to address, negotiate and contest ontological assumptions in digital research: such assumptions are considered too ‘basic’ to warrant detailed interrogation.
13
informational societies orientated towards liveness. For this reason, we think of co-occurrence, or at least its implementation in data tools online, as a highly ‘interested method’ (Asdal, 2014). These initial explorations of co-word analysis raise a particular critical question: Can we envision a digital apparatus for the analysis of ‘happening content’ which furthers other agendas than those of currency-driven analytics? Can we imagine an implementation in digital social research that would assemble digital tools and metrics in such a way to enable the detection of relevance? While we have just argued that digital analytics entails much more than the implementation of analytic measures only, we wonder if we can deploy or interface such measures for a different purpose, that of issue analysis. We would then like to treat online methods of co-word analysis as interfaces. Drawing on the concerns that informed the development of co-word analysis, our question is: is it possible to deploy co-word analysis to detect not so much what’s live, but what is lively, to highlight not what terms are becoming current, but which are becoming active (Marres & Weltevrede, 2013)? We will say more about the different between liveness and liveliness below, but we want to emphasise that this ‘brief’ for methodological experimentation is informed by our engagement with, and concern about, the context and objectives of digital analytics, and the interests and agendas currently informing the development of the wider socio-technical apparatus of digital research. To approach co-word analysis as an interface method is then to treat our implementation of this computational social method as an opportunity to engage critically and creatively with the wider deployment of similar methods in digital culture, to shift attention from what its disciplinary provenances to how its purposes can be configured. Here interface methods draw inspiration but also deviates from the digital methods approach outlined by Rogers (2013): while our approach seeks to re-purpose ‘natively digital’ methods, we are interested in engaging critically and creatively with the re-mediation of social research methods in digital culture. That is, we want to emphasise the uncertain, multiple provenances of digital social methods – both as they are implemented in digital culture and in academic social and cultural research - and seek to take advantage of this methodological ambivalence for purposes of social inquiry, Before further developing this general account of our methodological tactics, we would like to present some initial results of our efforts to execute the above ‘brief’ and implement co-word analysis online.
14
5. Implementing co-word analysis: climate change on Twitter In our methodological experiment then, we seek to explore co-word analysis not as method for detecting trends but for the analysis of ‘happening content’ or issues online. In doing so, we engage critically and creatively with tools and measures for online content analysis that are available online and which are mostly concerned with popularity or liveness (Marres and Weltevrede, 2013). Focusing on trending topics offers a popular but restrictive operationalization of ‘happening content’, and we therefore would like to develop a technique for detecting so called liveliness instead of liveness: to determine not which terms are becoming popular, but which are becoming active, in terms of their relations to other terms shifting through time, inspired by early forms of co-word analysis advocated by Callon. To be sure, our ambition is a precarious one: issue dynamics have long been conceived of in terms of the ‘rise and fall’ of keywords in the media (Downs, 1972), and we would be foolish to think that this ‘vertical dimension’ of issue activity – increase and decreases in the frequency of mentioning - could somehow be rendered irrelevant. What we are after, then, is to formulate assemblies of tools and measures for the detection of issue dynamics in online media which combine such basic proportional figures of thought and measurement with other ‘associationist’ measures, which define relevance in terms of the formation of connections between previously un-connected terms. Put differently, we seek to interface frequency and associationist measures. To develop and test our technique, we decide to focus on Twitter data. Twitter data are relatively easy to obtain, via the Twitter’s Search and Streaming APIs. To capture and analyse tweets, we worked with the Twitter Capture and Analysis Toolkit (TCAT) developed by the Digital Methods Group at the University of Amsterdam.7 As our aim is to implement co-word analysis in digital research, we focus on words, including keywords and hashtags, rather than other Twitter objects, such as URLs or usernames. Twitter data are suitable for co-word analysis, as the 140-character ‘tweet’ provides a workable data unit within which to detect co-occurrence relations. As noted by Callon et al. (1983), co-word analysis works especially well on relatively short fragments of formatted data, such as scientific abstracts: this type data already structured to demonstrate relevance. However, our initial decision to rely on this conventional demarcation of
7
DMI-TCAT is developed by Erik Borra and Bernhard Rieder. The stream capture scripts are already available at https://github.com/bernorieder/twitterstreamcapture.
15
the data unit – the tweet - within which to determine co-word relations, is not without consequences. For instance, it means that we dispense, at least initially, with the possibility of specifying the “strength” of the co-word relation within tweets, as in its initial formulation by Callon et al. For our analysis of ‘happening content,’ we decide to focus on a fairly general issue term, namely climate change, and include in our data set all Tweets using this term for a period of almost three months – from March 1st 2012 to June 15, 2012, adding up to a total of 204795 tweets, a workable, medium-sized data set. We focused on this broad issue area as it was familiar to us through previous work on online issue mapping (Rogers & Marres, 2000; Niederer, 2009). During various workshops in London and Amsterdam,8 we conducted pilot studies with different more granular keywords (including sustainable living or climate action) and alternating intervals, but it seemed to us that we needed a rather broad issue area and a sufficient timespan/number of intervals in order to capture interpretable topical variation.9 After delineating our dataset, our next question is: which terms to focus on? Our discussion about different possible initial selection criteria demonstrates how deeply engrained the proportional conception of relevance is in online media practices: To select our initial ‘focus words’ for further analysis, we initially reached for the ‘top 5/10/20’ keywords based on frequency measures. We then decided to test an alternative measure, namely co-occurrence analysis: would it make a difference, if we did consider not how often a word was mentioned on Twitter, but how connected it is to other words? Before answering this question, however, we had to deal with an equally vexed issue: do we focus on words or hashtags (words preceded by #)? As our wider aim is to do content or issue analysis with Twitter, it surely would be preferable to focus on the actual content, i.e. words, rather than hashtags, which function like key-words and are generally used to identify topics, demarcate conversations and render tweets searchable based on the hashtag (Bruns & Stieglitz, 2012). Hashtags are rather general, or generalizing words, and as such seem not the most useful when it comes to identifying what makes issues ‘happen’ on the level of content rather than on the level of ‘disciplinary’ or ‘publicitary’ classification. In addition, previous research has shown
8
This includes the Issue Mapping Online and Co-Word Machine workshops held at Goldsmiths, University of London in May 2012 - both funded by the ESRC Digital Social Research Programme - as well as the Digital Methods Summer School held at the University of Amsterdam in July 2012. 9 Also note that our data set does not exclude re-tweets.
16
that only a small percentage of tweets actually contain hashtags (Gerlitz and Rieder, 2013). However, computational logistics intervened: performing co-word analysis on our climate change data set at the early stages of our project would take a number of hours. This has since been resolved through new hardware, but at the time this made our choice very simple: it was cohashtag, not co-word, analysis that we would concentrate on.
Figure 2: Top hashtags based on word frequency of mention (left) and co-word connections (right) based on six 2 weekly intervals. Dataset: climate change on Twitter.
Figure 2 shows the top hashtags based on word frequency (left) and on co-word connections or degree range (right), and how these change across intervals.10 The column on the left shows the hashtags that are mentioned most often in our data set for each interval, and how 10
For both frequency and co-word, we first determined the overall ranking of terms (across all intervals) before determining (co-)occurrence per interval. We excluded the query words ‘climate change’ ‘climate’ and ‘change’ as these do not add anything to our analysis.
17
this set of top hashtags changes over time. The column on the right shows which hashtags in our data set appear most often with other hashtags in our data set for each interval.11 The results differ quite strongly: frequency and co-word measures brings into focus different ‘top’ hashtags in our data-set. In the frequency column, hashtags referring to institutions and events, like #cop16 or #auspol, are more prominent, and so are hashtags referring to campaigns such as #savethearctic. Applying co-occurrence, substantive hashtags appear as more prominent, including #economics, #flood, #co2, #health. The figure also provides some insight into the difference between the liveness and liveliness of issues. Hashtags that are frequent overall are more subject to hype-like dynamics: they appear quickly, gain high frequencies through short retweets activity and then disappear, such as in the case of #cleancloud and #newbedon. Top frequency hashtags also seem more ‘twitter specific’, as they include words like #qanda (question & answer) or #newbedon12, though co-word does brings up #dt (donated tweet). Wellconnected words are more likely to persist across intervals, demonstrating endurance, including #environment, #tcot (topconservatives), and #drought. The figure then provides some initial empirical support for the claim that proportional measures (frequency) are more likely to direct our attention to medium-specific dynamics (bursting; hyping), while relational measures (connectedness) can help to foreground more substantive dynamics. That is also to say, the choice of measure may drive the analysis more into the direction of ‘studying medium dynamics or ‘studying issue dynamics’, even if any one study will always be doing both (see on this point, Marres, forthcoming). Furthermore, looking at the most connected hashtags also draws attention to a specific hashtag user practice, focusing on tweet content with more than one hashtag and combination hashtags (Gerlitz and Rieder, 2013). Finally, when it comes to detecting the liveliness of issues, this initial figure leaves one important question unanswered. The figure gives an indication of the number of co-word connections of a given hashtag, but it does not tell us anything about the variation of connections: how the words change that these hashtags are associated with. The degree range of hashtags, that is their connections, hence only offers limited insight into the happening of content. 11
The precise measure used here was ‘average weighted degree’, that is the weighted degree of connections between a hashtag and other hashtags. 12 Regarding #newbedon, its appearance seems to indicate a twitter specific phenomenon: the term refers to oppositional figures in the united arab emirates who had been stripped of their nationality, and this hashtag was used to raise awareness. The hashtag must have been kidnapped, perhaps by spammers.
18
6. Detecting liveliness? The heuristic of the associational profile To briefly sum up what we established so far, three things seem especially important to us. First, operationalizing co-word analysis for the analysis of Twitter data, the distinction between proportional (frequency) and relational (co-occurrence) measures of relevance was not only affirmed, but also unsettled. In exploring our data with these measures, we encountered a number of the different ways in which a preoccupation with frequency is embedded into digital media practices themselves. It is not just a feature of predominant tools of data analytics, platform metrics and practices themselves are to extend oriented towards the production of proportional effects. For instance, the prominence of re-tweets reminded us that ‘frequency of mention’ is actively sought after – and produced - as a publicity tactic on Twitter: re-tweeting is a way of getting messages picked up by the system. Second, in operationalizing co-word analysis for online research, our own approach did not remain unaffected by its context of implementation, but was interfaced by these ‘assumptions of the medium’: In adopting the tweet as the relevant unit of analysis, we also opted for the measurement of co-occurrence rather than co-word analysis (by focusing on the unit of a tweet at the dispense of Callon’s relational measure of the relative strength of ties, a prime characteristic of co-word analysis). However, at the same time, in engaging with the apparatus of Twitter research, we gained more clarity about our own methodological objectives. It became clear to us, that if we want to detect the liveliness of issues with Twitter, then we need to develop an additional heuristic to identify what are not only relevant occurrences but relevant shifts in word associations. One of the problems with co-occurrence analysis is that it is an ‘expansive’ measure: processing textual data, the technique detects more and more relations between words, and changing word relations, without necessarily providing any clear way for summing up or differentiating among these changes and estimating their significance.13 To begin addressing this problem, we decided that rather than expressing these associations through measures and metrics, we needed to render them visually and to this end developed the heuristic of the ‘associational profile’. This heuristic is loosely based on the idea of an actor-network, according to which an entity can be defined through the entities it is associated with (Callon, Law, & Rip, 1986; Latour, 13
Callon’s measure of ‘strength of tie’ helped to address this problem.
19
2005). Similarly, the associational profile of a hashtag is made up of the other entities with which it connected (through co-occurrence). We can consider different types of entities to profile a hashtag: what other hashtags it is associated with, but also, which URLs it is co-occurs with, and which users deploy it.14 Our notion of the associational profile thus recognizes medium-specific ontologies of association, in contrast to Latour et al (2012). To explore the usefulness of this heuristic, we decided to produce three types of profiles for some of the key hashtags we had previously identified in our Twitter climate change data set: actor profiles, user profiles, and hashtag profiles. In this exercise, we focused initially on the more explicitly political hashtags in our data set - namely #ows (occupy wall street) and #tcot (top conservatives) – assuming that such polarized hashtags would be more likely to have distinctive profiles, and our analysis indeed showed some clear differences between these hashtags. We established the actor profiles for our hashtags by determining which URLS figure prominently in the tweets containing the hashtag in question, and found that #ows is primarily associated with political and organisational websites and with social media and news outlets.15 By contrast, #tcot is mainly associated with news & general media outlets, and in later intervals, increasingly with blogs and the progressive organisation thingprogress.org. The profile of the broadly progressive hashtag #p2 is dominated by organisations, rather than political sites, with thinkprogress.org as most mentioned reference, but is also heavy on news and media. Overall, there seem to be especially significant differences between #ows and #tcot actor profiles: Tcot is primarily focused on news, ows is focused on campaigns; tcot also appears to be more diversified in terms of the sources referenced than ows.16 In a second profiling exercise, we considered associations between users and hashtags. This proved interesting for a variety of reasons, one being that it brought into relief the
14
According to the same principle in which the tweet provides the site and means of connection: if two entities are tied to the same tweet, they are connected 15 Especially prominent are majority.fm and savetheartic.org, a political whistleblowing site and a campaign site 16 We can make sense of this in terms of the data: A close reading of tweets associated with these two hashtags reveals that, within the climate change data set at least, a significant number of tweets containing #tcot commented on conservatism. A comment like this by @DukeMaximum may be considered typical: “Wow the climate change field went from legitimate scientific inquiry to a doomsday cult in the blink of an eye didn't it? #tcot”. These tweets were not always conservative in orientation themselves, but offered comments on conservatism a preoccupation with the news makes sense. Indeed, #tcot is described as the hashtag for following top conservatives on twitter http://www.topconservativesontwitter.net [accessed July 16 2013. By contrast, it seems that contributions containing #ows are more likely to be of activist orientation themselves.
20
heterogeneity of entities implicated in climate change on Twitter.17 When working on this project during the Digital Methods Summer school in Amsterdam, a number of participants decided to examine what types of users figured in our Twitter data set, and they soon settled on the difference between human from non-human users (bots) as the most significant distinction. As discussed by Niederer and Van Dijck (2010), bots play a significant role in the organisation of public discourse on social media platforms. This does, however, not only raise questions of identification (on the Internet, can you tell who’s what?), along the lines of the famous Turing experiment. The relevant question is just as much how bots inform the organisation of public discourse of climate change on Twitter? This second question is different from the first: in the second case, here, it is not about the differentiation of human from non-human discourse, or the possibility of doing so. Rather, the aim is to detect the properties of the public discourse facilitated by the platform insofar as it implicates a variety of both human and non-human entities, i.e. insofar as implies a certain composition of bots and humans (see on this point also Wilkie et al, ms). However, to assess the inflection of climate change discourse
17
Note that the profiling methods above each institute a high degree of homogeneity in the data, ie. in first instance we focused on relations between hashtags only, in second instance between hashtags and URLS within tweets – all other entities were disregarded. For a discussion, see Marres, 2012.
21
Figure 3: Humans versus bots: user profiling #ows, #tcot and #p2 in relation to climate change
on Twitter by bots, it is still necessary to identify these non-human users, and the methods used during our Summerschool project to differentiate between the two was a decidedly experimental one (see figure 3). Users were selected using a frequency measure (only 60 users wrote at least 100 tweets), and they were manually categorised into human users/bots based on profile description, tweet activity, tweet content and links used.18 One of our findings was that there were a lot of generic bots, that is bots which post content this is not at all specific to the hashtag used (climate change). It seems that these bots appear to take advantage of the relative currency of hashtags in order to find audiences, no matter the substantive context. The presence of bots can therefore only very indirectly be taken as an indicator of issue activity in relation to climate change on Twitter: their presence suggests that the hashtag in question has currency, but insofar as these are generic bots, currency here figures as a feature of the medium, and not the issue. We 18
Bot tweets often have a very regular pattern, showing similar tweet structure and the repeated use of spammy or the same URL. We also considered whether humans or bots have a topic focus emerging from their profile bio or the content of the tweet, and even among bots it is possible to find thematically focused accounts.
22
may thus also have to make a distinction between liveliness that is more specific to the medium (changing associations between hashtags and bots), as opposed to issue-specific liveliness, which is driven by variation of substantive associations within the issue space (such as organisations vs news). Finally, we returned to our earlier questions about the connections between hashtag themselves. Here, we wanted to use the heuristic of the associational profile to detect changes in relevant associations over time: instead of an ontological view on what associations compose (the profile of) a given entity at a given moment, we are interested in changes in hashtag profile composition as an indicator of issue variability, or liveliness. With which hashtags are our selected hashtags connected in each interval? How do these associations change from interval to interval? With the help of programmers and designers, we devised a technique to determine associational profiles: to detect, for a given focus word, the hashtags associated with it per interval, and create a visualisation that shows the variation of these associations across intervals (a figure we provisionally called a ‘hashtag lifeline’). Such a hashtag profile depicts the intensity with which hashtags form connections with other hashtags over time (see figure 4, for the profile of #drought). In these first profiles, we distinguished new hashtag connections (the black words) and discontinued connections (red words), as we speculated that changing connections might indicate topical shifts and drifts. Colour indicates endurance and change: blue and green lines show stable connections, while red lines towards the end of the interval indicate ending connections. These initial visualisations thus present not only a rise and fall but also changes in issue associations: what are the principal other terms that compose the hashtag’s profile and how do these change over time? Asking this question, it seems to us, does give us a way to narrate the ‘life’ or ‘liveliness’ of an issue term: the hashtag profile of #drought, for instance, indicates a number of issue-related events, such as the rise to prominence of the Yorkshire floods in first interval (Figure 4). This had initially seemed an anomaly to us, but John Bloomfield, of the British Geological Survey, pointed out it’s significance: in the summer of 2012, the occurrence of floods during what had been defined as a period of drought posed institutional challenges, both in terms of the public communication of these seemingly contradictory ‘weather events’ as well as in terms of engrained assumptions about drought modelling. Finally, we also noted a
23
moment of near-total issue re-composition in the #drought profile, as in the last interval summitrelated language is almost completely replaced by Africa-specific terms.
Figure 4: Hashtag profile for #drought.
Finally, on a more general level, these profile visualisations can be read as offering ‘signatures’ or ‘fingerprints’ of a hashtag, as the lifelines display both granularity (how multiplous is the pattern of incoming and outgoing hashtags?) and volatility (How dramatic are the changes in hashtag composition over time)? #Environment, for example, has a far more diversely composed profile than drought, which many more forking and re-branching (see the comparison in Figure 5). Expanding such a comparison, we can detect different types of profiles, and indeed, between live hashtags and lively ones: some have meandering connections, others are more bursty; some are more heterogeneous in their connections, others less so. Those
24
hashtags which show periodic change in enduring, heterogeneous associations we deem especially lively.
Figure 5: Associational profiles for #ows (right) versus #environment (left).
7. Conclusion: the case for interface methods Our experiment with associational profiling has resulted in the development of a functional prototype tool (Marres, Gerlitz, Weltevrede, Borra and Rieder, 2013), but in the conclusion of this paper we would like to discuss what our experiment so far can tell us about interface methods. As noted, our aim was to experimentally determine the capacities of co-word analysis as a digital method, and thus to refrain from deciding – or artificially fixing – on formal grounds what the features of this analytic are. We found that what analysis can be produced with co-word measures partly depends on its specific socio-technical assembly and the medium in which it is implemented: Twitter provides a very different setting and context than for instance scientific abstracts. While we started to work with co-word analysis because it presents a relational method, our decision to work with Twitter data forced us to attend to various proportional, frequency-based effects. We like to mention two reasons why this was so. First, we constantly encountered proportional effects in our data, for instance in the form of retweet activity producing bursty hashtags or that of bots hijacking hashtags. In conducting Twitter analysis, then, the ‘ontology’ that emerges from the platform data, its specific format and associated use
25
practices cannot just be ignored by our method, and indeed, seems to have contaminated it to an extend. In this sense, the methodological uncanny works both ways: while initially we were captured by the resemblances between digital analytics and social research methods, in second instance their mutual strangeness was more apparent. To adopt an ‘interface methods’ approach, however, means that we do not seek to decide which of these two states is more true - affinity or alienation – on general grounds. Rather we must determine what is the most productive relation between media and method. On the one hand, we explicitly recognize that social media data come in specific form, format and are informed by distinct use practices - which may steer social inquiry into specific directions, here that of proportional forms of analysis. On the other hand, adopting an interface methods approach means that we do not necessarily need to go along with these media effects: we can deploy our methodology to work against this type of bias, for example by privileging the formation of new relations in our analysis. Secondly, in attempting to implement a sociological approach to the analysis of ‘happening content’ with Twitter, our research project staged an encounter between different analytic traditions in social and cultural research. We initially came to co-word analysis with a specific interest in issue mapping, and relational methods for the study of ‘happening content’ which was primarily informed by the well-established use of these methods in social studies of science and technology. However, in seeking to implement co-word analysis in online social research, these methods were brought into conversation with related but slightly different methods, most importantly, with co-occurrence analysis, and its application in online content analysis, and digital social research more broadly (Beer, 2012). While current applications of the latter method are partly informed by co-word analysis, they provide a different translation of what we formally called ‘the analysis of word relations.’ As mentioned, co-occurrence analysis focused on frequency of co-connection and does not consider the strength of relations between terms. Here, the Twitter format of the tweet serves as the relevant unit of analysis, and not the less medium-dependent - ‘word cluster’ consisting of terms with varying word distances. In opting for this implementation, however, we came to know our own methodological proposition and the associated media-effects much better. It is certainly not the case that the analysis of Twitter data is in and of itself limited to a proportional framework, and through our study we learnt a great deal about the affordances and constraints that digital media place on
26
‘associationist methods’. We would like to emphasise one key advantage of Twitter data, and this is that prestructured heterogeneities that may be used to construct associational profiles: these may the URLs or users, and could also include language, device and platform used for posting, as well as type of tweet (@reply, tweet, retweets etc.). Such prestructured heterogeneity might provide a great way to further specify the profiles objects on Twitter and their liveliness. We also want to just flag that the demarcation of the data set in terms of the ‘whole medium’ – as we did in focusing on all tweets mentioning climate change - directs the analysis towards the detection of medium-specific effects. Finally and most importantly, we learned about the importance of the maladjustment of methods to medium, and the need to create a number of well-chosen adjustments in order to identify and undertake selected maladjustments, and to work with, rather than suspend the methodological uncanny between method and medium. This might as well serve as a working definition of contestational analytics or more simply put, ‘intervention.’ As we brought our social research method to ‘interface’ with the analytic and technical practices of Twitter research, we ended up implementing a method that assembles different analytical objectives and media effects. The question is: what did we gain in welcoming such interface effects? In our empirical projects we tried to create informed connections between our method, data and context of analysis, such as the sociology of knowledge and digital analytics, the specificity of Twitter and the analysis of issue dynamics. While we certainly did not succeed in all respects to establish such connections, we did gain insight in the more or less determinate ways in which these are necessarily not adjusted to one another: Twitter practices may reintroduce a focus on frequency through retweets peaks, but the analysis of happening content may re-introduce a focus on the production of relations between entities. We then draw two main conclusions from our methodological experiment. On the one hand, we have argued against the temptation to identify particular methods and tools with specific disciplines because these become sociological – or as the case may be, non-sociological - through their deployment and context of use. Second, we argue for a holisitic understanding of digital social research, which recognizes that its analytic capacities derive from the assembly of methods, data, tools, user practices, context of application and so on. Insofar as each of these are oriented towards different objectives and are ‘interested’ in different ways, the configuration of
27
an apparatus of digital social research then inevitably involves interfacing with divergent analytical objectives. It is then not a sign of weakness or failure that our efforts to introduce relational forms of analysis into online research forced us to renegotiate the role of proportional measures in our social analysis. Instead of hanging onto an either-or distinction between relational and proportional measures this push-back of the medium against our method, directed our attention to the interplay between platform and issue dynamics, and this is what in our view especially requires further interrogation. We began by recognizing the relative open-endedness of tools and measures, but in order to develop forms of social analysis at the interface between medium and methods, it may important not only to seek for their alignment, but also to recognize the possible mal-adjustment of the different constitutional components of our research apparatus. We then understand interface methods as a process of the assembly of different components of the digital social research apparatus: research technique, medium, data, user practice and context of application, and this process asks for attentiveness towards both the alignment and the misalignment of the analytical capacities of each of these components. Acknowledgements We thank the participants in the ‘Issue Lifelines’ project during the Digital Methods Summer School at the University of Amsterdam in 2012: Albrecht Hofheinz, Colleen Reilly, David Moats, Diego Dacal, Esther Weltevrede, Jill Hopke, Johannes Paßmann, Kalina Dancheva, Sara Kjellberg and Tally Yaacobi-Gross. Special thanks to information designer Alessandro Brunetti. We are also grateful for the contributions of participants in the Issue Mapping Online and CoWord Machine workshops at Goldsmiths, University of London in the Spring and Fall of 2012, including Esther Weltevrede, Marieke van Dijk, Richard Rogers, Sabine Niederer, Anne Helmond, Bernhard Rieder, Emma Uprichard, Erik Borra, Lucy Kimbell, Astrid Mager, Sam Martin, Esteban Damiani and Ea Ryberg Due, and to Simeon Smith for his reading of Twitter data as a summer research assistant. Our final thanks is to the STS Kitchen at the University of Frankfurt including Endre Danyi, Andreas Folkers and Torsten Heinemann who provided helpful comments on a draft versions of this piece.
28
Funding The paper was made possible by a demonstrator grant awarded by the ESRC Digital Social Research Programme (ES/J010103/1) and additional funding from the ESRC DSR community funding programme 2012-2013. Bibliography Asdal, K. (2014). From climate issue to oil issue: offices of public administration, versions of economics, and the ordinary technologies of politics. Environment and Planning A, 46(9), 2110-2124. Back, L., & Puwar, N. (2012). A manifesto for live methods: provocations and capacities. The Sociological Review, 60, 6–17. Beck, G and C Kropp (2011) Infrastructures of risk: a mapping approach towards controversies on risks. Journal of risk research 1 (14): 1-1 Beer, D. (2012, August 31). Using Social Media Data Aggregators to Do Social Research. Sociological Research Online. Bowker, G. C., & Star, S. L. (2000). Sorting Things Out: Classification and Its Consequences (p. 389). MIT Press. Bruns, A., & Stieglitz, S. (2012). Quantitative Approaches to Comparing Communication Patterns on Twitter. Journal of Technology in Human Services, 30(3-4), 160–185. doi:10.1080/15228835.2012.744249 Bucher, T. (2012) Want to be on the top? Algorithmic power and the threat of invisibility on Facebook. New Media & Society, 14(7): 1164–1180. Burrows, R. and Beer D. (2007, September 30). Sociology and, of and in Web 2.0: Some Initial Considerations. Sociological Research Online. Callon, M., Courtial, J.-P., Turner, W. a., & Bauin, S. (1983). From translations to problematic networks: An introduction to co-word analysis. Social Science Information, 22(2), 191–235. Callon, M., Law, J., & Rip, A. (1986). Mapping the dynamics of science and technology: sociology of science in the real world. Chateauraynaud, F. (2009) 'Public controversies and the Pragmatics of Protest: Toward a Ballistics of collective action', Working Paper EHESS, Paris. Collins, H. M., & Pinch, T. (1998). The golem: What you should know about science. Cambridge University Press.
29
Coulter, N and I Monarch, S Konda (1998) Software engineering as seen through its research literature: a study in co-word analysis. Journal of the American Society for Information Science 49(13):12061223 Boyd, D., & Crawford, K. (2012). Critical questions for big data: Provocations for a cultural, technological, and scholarly phenomenon. Information, Communication & Society, 15(5), 662-679. Crawford, K., & Gillespie, T. (2014). What is a flag for? Social media reporting tools and the vocabulary of complaint. New Media & Society, 1461444814543163. Danowski, J. (2009). Inferences from word networks in messages. In K. Krippendorff & M. A. Bock (Eds.), The content analysis reader (pp. 421–429). Thousand Oaks, CA: SAGE Publications. Downs, A. (1972) 'Up and down with Ecology: the Issue Attention Cycle,' The Public Interest 28: 38. Eklof, J and A Mager (2013). Technoscientific promotion and biofuel policy: How the press and search engines stage the biofuel controversy Media Culture Society 4 (35) 454-471 Galloway, A. R. (2012). The Interface Effect. Cambridge: Polity. Gerlitz, C. (2012). Continuous Economies. Goldsmiths, University of London.: PhD thesis. Gerlitz, C., & Helmond, A. (2013). The Like economy: Social buttons and the data-intensive web. New Media & Society. Gerlitz, C. & Rieder, B., (2013). Mining One Percent of Twitter : Collections, Baselines, Sampling. M/C Journal, 16(2), pp.1–18. Gitelman, L. (Ed.). (2013). Raw Data Is an Oxymoron. MIT Press. Hansen, L. K., Arvidsson, A., Nielsen, F. Å., Colleoni, E., & Etter, M. (2011). Good friends, bad newsaffect and virality in twitter. In Future Information Technology (pp. 34-43). Springer Berlin Heidelberg. Harvey, P, M. Reeves, and E Ruppert (2013). Anticipating Failure:Transparency devices and their effects, Journal of Cultural Economy 3 (6) :294-312 Jirotka, M., Lee, C. P., & Olson, G. M. (2013). Supporting Scientific Collaboration: Methods, Tools and Concepts. Computer Supported Cooperative Work (CSCW), 1-49. Langlois, G., & Elmer, G. (2013). The Research Politics of Social Media Platforms. Culture, 14, 1–17. Latour, B., Jensen, P., Venturini, T., & Boullier, S. G. D. (2012). The Whole is Always Smaller Than Its Parts’ A Digital Test of Gabriel Tarde’s Monads. British Journal of Sociology, forthcoming. Law, J., Ruppert, E., & Savage, M. (2011). The Double Social Life of Methods. CRESC Working Paper Series, 44(95), 1–12. Lury, C. (2004). Brands. The logos of the global economy. London and New York: Routledge.
30
Lury, C. (2012). Going live: towards an amphibious sociology. The Sociological Review, 60(2012), 184– 197. Lury, C., & Wakeford, N. (2012). Inventive Methods: The Happening of the Social (p. 269). New York: Routledge. Marres, N., C. Gerlitz, Weltevrede, E., E. Borra, B. Rieder (2013). Mapping WCIT with Twitter: Issue and Hashtag Profiles, http://issuemapping.net/Main/WCITProfiles Marres, N. Why Map Issues? On Controversy Analysis as a Digital Method. Science, Technology and Human Values. Marres, N. (2012). The redistribution of methods: on intervention in digital social research, broadly conceived. The Sociological Review, 60(2012), 139–165. Marres, N. (2011). The costs of public involvement. Everyday devices of carbon accounting and the materialisation of participation. Economy and Society, 1–31. Marres, N., and R. Rogers (2005). "Recipe for Tracing the Fate of Issues and their Publics on the Web." Making Things Publics: Atmospheres of Democracy. B Latour and P Weibel (Eds). Cambridge: MIT PRess: 922-935. Marres, N., & Rogers, R. (2008). Subsuming the ground : how local realities of the Fergana Valley , the Narmada Dams and the BTC pipeline are put to use on the Web. Economy and Society, (April 2012), 37–41. Marres, N and R. Rogers (2001). 'Depluralising the Web and Repluralising Public Debate: The Case of the GM Food Debate on the Web', Prefered Placement: Knowledge Politics on the Web (R. Rogers (Ed.)), Maastricht: Jan van Eyck Academie. Marres, N., & Weltevrede, E. (2013). Scraping the Social? Issues in real-time social research. Journal of Cultural Economy, 6(3), 313–335. Niederer, S., & van Dijck, J. (2010). Wisdom of the crowd or technicity of content? Wikipedia as a sociotechnical system. New Media & Society, 12(8), 1368-1387. Niederer, S. (2009). Climate Change Sceptics. Digital Methods Initiative. Retrieved from https://wiki.digitalmethods.net/Dmi/ClimateChangeSkeptics Rogers, R. (2009). The End of the Virtual – Digital Methods. Media. Retrieved September 21, 2012, from http://www.govcom.org/rogers_oratie.pdf Rogers, R. (2013). Digital Methods. Cambridge MA: MIT Press. Rogers, R., & Marres, N. (2000). Landscaping climate change : a mapping technique for understanding science and technology debates on the World Wide Web. Museum, 9, 1–23. Ruppert, E., Law, J., & Savage, M. (2013). Reassembling Social Science Methods: The Challenge of Digital Devices. Theory, Culture & Society, 30(4), 22–46.
31
Savage, M. (2009). Contemporary Sociology and the Challenge of Descriptive Assemblage. European Journal of Social Theory, 12(1), 155–174. Scharnhorst, A., & Wouters, P. (2006). Webindicators: a new generation of S&T indicators. Cybermetrics, 10. Suchman, L. (2005). "Agencies in Technology Design: Feminist Reconfigurations." Retrieved from http://www.lancs.ac.uk/fass/sociology/papers/suchman-agenciestechnodesign.pdf Thelwall, M., Vann, K., & Fairclough, R. (2006). Web issue analysis: An integrated water resource management case study. Journal of the American Society for Information Science and Technology, 57(10), 1303–1314. Uprichard, E. (2011). Dirty data: longitudinal classification systems. The Sociological Review, 59(c), 93– 112. Velden, van der L. "A study into third party elements on Dutch governmental websites", doctoral dissertation chapter, Media Studies, University of Amsterdam, ms. Venturini, T. (2010). Diving in magma: how to explore controversies with actor-network theory. Public Understanding of Science, 19(3), 258–273. Venturini, Tommaso. (2012). Building on faults: how to represent controversies with digital methods. Public Understanding of Science. Wilkie, A and M Michael and M Plummer-Fernandez "Speculative Method and Twitter: Bots, Energy and Three Conceptual Characters", submitted Wouters, P., Beaulieu, A., Scharnhorst, A., & Wyatt, S. (Eds.). (2012). Virtual Knowledge: Experimenting in the Humanities and the Social Sciences. MIT Press.
32