J Neurophysiol 97: 2731–2743, 2007; doi:10.1152/jn.00987.2006.
Interval Coding. I. Burst Interspike Intervals as Indicators of Stimulus Intensity Anne-Marie M. Oswald,1 Brent Doiron,2 and Leonard Maler1,3 1
Department of Cellular and Molecular Medicine and 2Physics Department, 3Center for Neural Dynamics, University of Ottawa, Ottawa, Ontario, Canada Submitted 15 September 2006; accepted in final form 5 December 2006
Oswald A-M, Doiron B, Maler L. Interval coding. I. Burst interspike intervals as indicators of stimulus intensity. J Neurophysiol 97: 2731–2743, 2007; doi:10.1152/jn.00987.2006. Short interspike intervals such as those that occur during burst firing are hypothesized to be distinct features of the neural code. Although a number of correlations between the occurrence of burst events and aspects of the stimulus have been identified, the relationship between burst characteristics and information transfer is uncertain. Pyramidal cells in the electrosensory lobe of the weakly electric fish, Apteronotus leptorhynchus, respond to dynamic broadband electrosensory stimuli with bursts and isolated spikes. In the present study, we mimic synaptic input during sensory stimulation by direct stimulation of electrosensory pyramidal cells with broadband current in vitro. The pyramidal cells respond to this stimulus with burst interspike intervals (ISIs) that are reliably and precisely correlated with the intensity of stimulus upstrokes. We found burst ISIs must differ by a minimum of 2 ms to discriminate, with low error, differences in stimulus intensity. Based on these results, we define and quantify a candidate interval code for the processing of sensory input. Finally, we demonstrate that interval coding is restricted to short ISIs such as those generated in burst events and that the proposed interval code is distinct from rate and timing codes.
A number of strategies have been proposed for the coding of sensory input by neural spike discharge. The basic premise is that stimulus attributes are represented in some way by the spike train responses of single neurons or neuronal populations. For example, rate and temporal codes are two wellknown examples in which the firing rate or timing of action potentials is correlated with the intensity or event timing of the stimulus respectively (for review, see Eggermont 1998). In the course of sensory processing, spike trains often consist of isolated spikes, spike clusters, termed bursts, or both. It has been demonstrated that bursts are good indicators of stimulus events or features, whereas isolated spikes provide an estimate of the stimulus (Gabbiani et al. 1996; Metzner et al. 1998; Oswald et al. 2004; Sherman 2001). Specifically, bursts have been shown to be correlated with low-frequency electrosensory and visual stimuli (Bezdudnaya et al. 2006; Grubb and Thompson 2004; Lesica and Stanley 2004; Oswald et al. 2004), the tuning frequency of auditory stimuli (Massaux et al. 2004), stimulus onset due to microsaccades (Martinez-Conde et al. 2002), regions of spatial opponency in visual receptive field maps (Reich et al. 2000), specific features in natural visual scenes (Lesica and Stanley 2004; Lesica et al. 2006), and highly salient visual stimuli (Alitto et al. 2005).
These examples suggest that it is the timing of the burst event, usually the first burst spike, that is correlated with stimulus features. The role of additional burst spikes in stimulus encoding remains in dispute. In electrosensory pyramidal cells, additional burst spikes do not increase the stimulusresponse coherence (Oswald et al. 2004) or stimulus estimation (Metzner et al. 1998). Thalamic relay cell bursts may carry more information per unitary event than isolated spikes, but burst spikes carry less information per action potential (Reinagel et al. 1999). In other visual system neurons, spikes preceded by short, interspike intervals (ISIs, i.e., bursts) convey more information than spikes preceded by longer ISIs (i.e., isolated spikes) (de Ruyter van Steveninck and Bialek 1988; Reich et al. 2000). These seemingly contradictory results may, in part, be attributed to the different information measures employed in these studies. Nevertheless, the number of spikes in a burst can be correlated with the slope of the stimulus upstrokes (Kepecs and Lisman 2003; Kepecs et al. 2002) or the optimality of stimulus orientation (Debusk et al. 1997; Martinez-Conde et al. 2002), suggesting potentially valuable information about the stimulus may be lost if one only considers the timing of the first spike in a burst. Pyramidal cells in the electrosensory lateral line lobe (ELL) of the electric fish have a well-characterized, dendrite-dependent burst mechanism (Doiron et al. 2001, 2002; Lemon and Turner 2000; Turner et al. 1994). Pyramidal cells, both in vivo and in vitro, respond to broadband dynamic stimuli with both bursts and isolated spikes (Gabbiani et al. 1996; Metzner et al. 1998; Oswald et al. 2004). Moreover, during electrosensory stimulation, the membrane potential of pyramidal cells is coherent with the stimulus (Chacron et al. 2003; Middleton et al. 2006). In the present study, we mimic electrosensory input by direct stimulation of pyramidal cells in vitro with dynamic broadband current stimuli containing frequencies consistent with electrosensory stimuli. We show that the intensity of the upstrokes in a broadband stimulus is correlated with the burst ISI. We expand on the feature extraction measure described by Metzner et al. (1998) and demonstrate that the upstroke characteristics (amplitude and slope) coded by a given burst ISI are highly discriminable from those of upstrokes associated with different burst ISIs. Thus, in addition to bursts signaling low-frequency stimulus events (Oswald et al. 2004), burst ISIs can also act as interval coders of stimulus intensity (Perkel and Bullock 1968). Finally we quantify the additional information
Present address and address for reprint requests and other correspondence: A.-M.M. Oswald, Center for Neural Science, New York University, 4 Washington Pl., New York, NY 10003 (E-mail:
[email protected]).
The costs of publication of this article were defrayed in part by the payment of page charges. The article must therefore be hereby marked “advertisement” in accordance with 18 U.S.C. Section 1734 solely to indicate this fact.
INTRODUCTION
www.jn.org
0022-3077/07 $8.00 Copyright © 2007 The American Physiological Society
2731
2732
A.-M.M. OSWALD, B. DOIRON, AND L. MALER
that utilization of a burst ISI code could provide about the stimulus. METHODS
Transverse brain slices from the ELL of Apteronotus leptorhynchus were prepared in accordance with animal care protocols of the University of Ottawa as previously described (Berman et al. 1997). The slices were maintained at room temperature (20 –22°C) in oxygenated artificial cerebrospinal fluid [ACSF; containing (in mM) 124 NaCl, 3 KCl, 0.75 KH2PO4, 2 CaCl2, 2 MgSO4, 24 NaHCO3, and 10 D-glucose, all chemicals provided by Sigma] for 1–2 h prior to recording. Intracellular recordings from 52 ELL pyramidal cells were made using 80 –120 M⍀ boroscillate glass electrodes, pulled by a BrownFlaming P-87 puller (Sutter Instrument, CA) and filled with 2 M KAc. All cells analyzed were identified as bursting cells using 2- to 4-s constant current injections (0.5–1.5 nA) (Lemon and Turner 2000). Recordings were made from superficial and intermediate pyramidal cells (Bastian et al. 2004) in the pyramidal cell layer of the centromedial and centrolateral segments of the ELL (Maler et al. 1991). Although previous studies have reported differences in oscillatory activity between the segments (Turner et al. 1996), there were no segment-dependent differences observed for the measurements made in the present study (data not shown), and the results were therefore pooled. In addition, there are two types of pyramidal cells: E-cells that respond to upstrokes in electrosensory stimuli and I-cells, which, through relief from feed-forward inhibition, respond to stimulus downstrokes. Although these cells show minor differences in the detection of optimal stimuli in vivo (Metzner et al. 1998), these cells are electrophysiologically indistinguishable in vitro. In vivo, the optimal stimuli (upstrokes and downstrokes) depolarize the membrane such that regardless of cell type, a pyramidal cell responds to an upstroke in the membrane potential. Likewise, during current injection in vitro, these cells spike in response to depolarizing upstrokes (Oswald et al. 2004). On impalement, the neurons were allowed to stabilize for ⬃5–10 min. If necessary, a constant 0.1- to 0.5-nA hyperpolarizing current was injected through the recording electrode to reduce spontaneous activity. The stimulus was 100 s long and consisted of a baseline level of depolarization that induced a minimum firing rate of 10 Hz to which was added zero-mean, Gaussian noise with a cut-off frequency of 60 Hz. The stimulus was a computercontrolled waveform (IgorPro and Pulse Control, Wavemetrics, OR) (Herrington et al. 1995) delivered via the recording electrode. The SD of the injected noise (contrast) was varied from 0.35 to 2.0 nA. Pyramidal cell responses were amplified (Axoclamp 2A, Axon Instruments, Burlingame CA), sampled at 10 kHz and stored for analysis (Igor Pro and Pulse Control).
Data analysis The neural responses were analyzed using Igor Pro and MATLAB (Mathworks, Natick, MA). At the onset of the stimulus, there was a transient nonstationarity in the cell responses that typically lasted a few seconds; these data were discarded.
Reliability and precision of burst ISIs The reliability and precision of burst timing and burst ISIs were determined in a manner similar to those previously described (Berry and Meister 1998; Mainen and Sejnowski 1995; Reinagel and Reid 2002). A subset of cells (10) was stimulated with repeated presentations of shortened versions (3–10 s) of the Gaussian noise stimulus with a contrast 1.4 nA. Shorter stimuli (3–5 s) were presented more often (30 –50 trials) than longer stimuli (10 s; 10 –20 trials). Because the results of the two stimulus protocols did not significantly differ, these data were pooled. For each trial, the resulting spike train was J Neurophysiol • VOL
binned in 1-ms intervals so that no more than one spike occurred per bin. The binned data were then compiled over all trials in an event histogram (similar to the PSTH). Due to the frequency content of the stimulus, there was typically only one spike or burst event per upstroke. This resulted in 10- to 16-ms periods of quiescence in the neural response that, in combination with the narrow bin-width of the event histogram, facilitated the identification of single spike train events that were reproducible from trial to trial. After this, single spike train events were identified as consecutive nonzero bins in the event histogram. The spike counts in these consecutive bins were summed and if the resulting number was ⬎70% of the number of trials, the spike train event was considered “reliable. ” The overall reliability of the neural response was determined as the number of total number of spikes contained in reliable spike train events divided by the total number of spikes over all trials. The consecutive bins of the reliable events were then fit with Gaussians. The width of the Gaussians provided a measure of the “precision” of each event. The precision of the neural response was the average precision over all reliable spike train events (Berry and Meister 1998). The reliability and precision of burst events were determined based on the first spike of the burst, whereas the precision of the ISIs was determined as the square root of the mean variance of the ISIs of the reliable burst events.
Measurement of interval discriminability The spike trains consisted of bursts and isolated spikes. Previous studies have partitioned the spike trains into burst and isolated spike events according to an ISI criterion determined from the bimodal structure of ISI histograms (Bastian and Nguyenkim 2001; Debusk et al. 1997; Metzner et al. 1998; Oswald et al. 2004). We used a similar criterion to identify burst events and then further partitioned these events according to their ISI value and the duration of an interval window (T, ms). The first ISI response group (Ri, i ⫽ 1) consisted of all burst events with ISIs greater than or equal to the minimum ISI rounded down to the nearest integer value (min, ms) and less than min⫹ T. Ensuing response groups (i ⫽ 2, 3,. . ., N) were determined according to ISI such that [min ⫹ (i ⫺ 1)T] ⱕ ISI ⬍ (min ⫹ iT). The duration of T was systematically varied from 1 to 8 ms. The total number of features that could be coded by the burst events for a given T is equivalent to the number of intervals N ⫽ int[(max ⫺ min)/T], where max is the ISI criterion (ms) for determining burst events and int[x] is x rounded to the nearest integer. We have developed a variant of the feature extraction technique described in detail by Metzner et al. (1998) to obtain a measure of interval discriminability (ID). Before the details of this measure are described, we present an overview of the feature extraction technique. The stimulus was time-binned at ⌬t ⫽ 0.5 ms to ensure that no more than one spike occurred per bin. For each bin [t ⫺ ⌬t;t], we determined a stimulus vector, s(t) ⫽ [s(t ⫺ 100⌬t),. . ., s(t)], that corresponds to the stimulus waveform 50 ms prior to t. Typically, these vectors are grouped in distributions according to the occurrence of a spike event where t equals the timing of the event onset (i.e., the 1st spike of the burst). However, a neuron that decodes the information contained in the ISI must wait for the second spike to occur before responding. Motivated by this, t was chosen as the time of second spike of each burst so that the resulting stimulus vectors contained all stimulus information between the two burst spikes and thereby obeyed causality. We subdivided the burst stimulus vectors into ISI response (R) distributions, P(s兩Ri). The ISI boundaries of these distributions are determined by the duration of the window (T) chosen as described in the previous paragraph. We also define a null distribution P(s兩R0) of the stimulus vectors that preceded all bins [t ⫺ ⌬t;t] that did not give rise to a spike or burst event. For small ⌬t, the probability of a null event is often large so we limited the number of vectors in this distribution to three times the total number of stimulus vectors that produced an event (bursts and isolated spikes). This did not alter the results and increased the speed of analysis.
97 • APRIL 2007 •
www.jn.org
CODING WITH BURST INTERSPIKE INTERVALS
The means (mi) and co-variances (⌺i) of each distribution, including the null distribution (j ⫽ 0), were estimated. The optimal feature vectors (f) that separated each response distribution from the null (fi0) or its neighboring distributions (fij) or was obtained by maximizing Fisher’s linear discriminant function d⫽
关f i0T 䡠 共m1 ⫺ m0兲兴2 1 1 ⌺0 ⫹ ⌺i 䡠 fi0 f i0T 䡠 2 2
冉
冊
As shown, this equation compares the response group Ri to the null distribution R0, yielding fi0. However, by replacing m0 and ⌺0 with mj and ⌺j, this will yield fij for discrimination between response groups: Ri and Rj. Each stimulus vector was projected onto f, according to, fijT䡠s, which reduces the dimensionality of the stimulus vector (100d) to a single dimension. The separations between the response distribution P(fi0T䡠s兩R0) and the null P(fi0T䡠s兩Ri), and between neighboring response distributions P(fijT䡠s兩Ri) and P(fijT䡠s兩Rj) were assessed using the linear classifier, hf,(s) ⫽ fijT䡠s – , where is the threshold for determining whether a stimulus feature (s) belongs to a given class (R0, Ri, Rj). From this, the probability of correct detection, PD, (classifying the stimulus as eliciting the correct response i.e., null response or an ISI within the given interval) and the probability of false alarm, PFA, (classifying a stimulus vector as eliciting the incorrect response) were determined. When PD is plotted against PFA, the result is the receiver operating characteristic (ROC) curve (not shown). These values are also used to calculate the error rate, ⫽ 1/2PFA ⫹ 1/2(1 ⫺ PD). The error rate is a measure of how well the spike output of the pyramidal cell can convey information about the presence of stimulus features based the discriminability of spike train events. Of particular interest is the minimum of the error rate, min, which gives the of the optimal linear classifier. We use min as the basis for our measure of discrimination (␥). Because min is a value between 0 (perfect) prediction and 0.5 (chance), we compute ␥ ⫽ 1 ⫺ 2 min
(1)
␥ takes a value between 0 (chance) and 1 (perfect). The overall performance of an ISI event group Ri depends on the discriminability of the group versus null, ␥i0; the discriminability, ␥ij, of ISIs within a given group Ri from those in neighboring groups Rj; and the proportion, pi, of the total burst events that comprise Ri (number of bursts in Ri divided by the total number bursts in the spike train). Each Ri has a discriminability value (Di) between 0 and 1 that contributes proportionately to the overall summed discriminability of the ISIs (ID)
写 N
Di ⫽
␥ij
(2)
Di pi
(3)
j⫽i jⱖ0
冘 N
ID ⫽
i⫽1
Eq. 2 formally compares Ri to all other groups Rjⱖ0 (including the null group j ⫽ 0). However, for multiples of T ⬎ 1, we can approximate ␥i,i ⫹2 ⫽ ␥i,i-2 ⫽ ␥i,i ⫹3 ⫽ ␥i,i-3 ⫽ . . .⬇1 such that D j ⬇ ␥i,0␥i,i⫹1␥i,i⫺1
(4)
The overall discriminability of stimulus features based on the ISIs arises from a series of discriminations each using a one-dimensional linear classifier. The complexity of this measure depends on T, which determines the number of response distributions and hence the required number of classifiers. Alternatively, it is conceivable that a single, albeit more complex, multi-dimensional classifier could be used to separate response groups (Duda et al. 2001). Future analyses J Neurophysiol • VOL
2733
will be required to determine whether such a scheme might provide better feature discriminability. Because of the limited length of our data sets (100 s), some ISI events occur infrequently either due to rare stimulus events or by chance, so it is difficult to obtain a good estimate of the stimulus features corresponding to these intervals. Although these events may be highly discriminating, we cannot reliably measure them. Similarly, when T is sufficiently small, the number of events in a given Ri may too few to obtain a mean and covariance of the distribution. For this reason, we set a threshold on pi such that if a distribution is comprised of stimuli that are associated with ⬍1% of all burst events (pi ⬍ 0.01), they do not contribute to ID. Thus, although the number of potential features that could be coded by the total distribution of burst ISIs is equivalent to the number of response distributions, N, defined by T (see preceding text), only the distributions with pi ⬎ 0.01 contribute to the estimate of the interval code. The total number of response distributions with pi ⬎ 0.01 is given by NC. Generally, NC was equal to N for T ⫽ 2– 8 ms. It was only when T ⫽ 1 ms that NC ⬍ N suggesting that this threshold may be unnecessary if the data set contains a sufficiently large number of burst ISIs. The overall interval code, IC, was quantified as the number of features coded, NC, multiplied by the summed discrimination of these features based on their associated burst ISIs, ID I C ⫽ NC ID
(5)
RESULTS
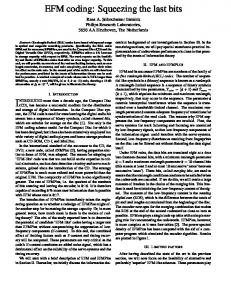
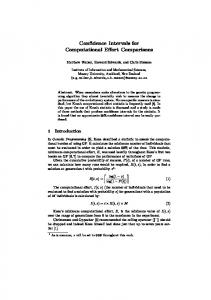
Burst ISI (ISI) is correlated with stimulus amplitude ELL pyramidal cells were stimulated in vitro by intracellular current injection of a broadband (0 – 60 Hz) Gaussian stimulus. Each cell was tested with one to four different stimulus contrasts which ranged from 0.35 to 2 nA. The resulting spike trains consisted of isolated spikes as well as bursts of spikes (Fig. 1A). Increasing stimulus contrast resulted in an increase in the overall mean firing rate as well as the fraction of spikes that were contained in bursts (Table 1). The highest firing rates attained were still below those produced in vivo by sensory stimulation (Bastian et al. 2002), suggesting that bursts are not due to nonphysiological stimulus intensities and may therefore be relevant to in vivo sensory processing. At all contrasts, the majority of bursts were high-frequency (100 –300 Hz) doublet events (Fig. 1B) that correspond to a prominent first peak in the bimodal ISI histogram between 3 and 10 ms (Fig. 1C). For this reason, we focus on the ISIs of the doublets as opposed to the number of spikes in the burst as a candidate neural code. In Fig. 1A, the doublet ISI decreases with increasing stimulus amplitude. There is a corresponding leftward shift in the first peak of the ISI histogram (Fig. 1C). These results suggest an inverse relationship between burst ISI and stimulus amplitude that might be exploited as a part of the neural code. To assess the amplitude of the stimuli that gave rise to the burst ISIs, the maximum stimulus amplitude in the time between the two doublet spikes was measured for each burst. In Fig. 2A, the burst ISI was plotted versus amplitude for three contrasts tested in a single cell (triangles, 0.70 nA; circles, 1.4 nA; squares, 2.0 nA). The individual stimulus events that were associated with bursts were then grouped according to burst ISI by T ⫽ 1-ms increments (Fig. 2A, dashed lines) from 3 to 10 ms to obtain a corresponding burst-triggered average (BTA, based on the 2nd spike of the doublet) for each ISI range (Fig. 2B). The amplitudes and slopes of the BTAs increased with decreasing burst ISI. These amplitudes are superimposed as
97 • APRIL 2007 •
www.jn.org
2734
A.-M.M. OSWALD, B. DOIRON, AND L. MALER
FIG. 1. Electrosensory lateral line lobe (ELL) pyramidal cell responses to broadband Gaussian input of increasing contrast. A: responses of a representative ELL pyramidal cell (bottom 4 traces) to 0- to 60-Hz Gaussian current injection (top traces) with SD; light gray, 0.35 nA; thin black, 0.70 nA; thick dark gray, 1.4 nA; thick black, 2.0 nA. The number of bursts increases with contrast while the burst interspike interval (ISI) decreases. The burst ISIs are indicated by the numbers (in ms) next to the stimulus feature that elicited the response. B: proportion of total bursts that are comprised of a specific number of spikes for all contrasts, open gray squares, 0.35 nA; open black circles, 0.70 nA; gray squares, 1.4 nA; black circles, 2.0 nA. Values are the average over the full data set, error bars are the SD. Approximately 80% of all bursts are doublets. C: ISI histogram for each contrast, light gray solid, 0.35 nA; open bars, 0.70 nA; dark gray solid, 1.4 nA; black solid, 2.0 nA. The ISI histogram has been truncated after the second mode to demonstrate the increase in the width of the burst ISI distribution and leftward shift in the burst peak. The ISI histogram values extend to 120 ms.
colored symbols on Fig. 2A; the symbols correspond to the stimulus contrast as in Fig. 2A, and the colors correspond to the BTAs of a given ISI in Fig. 2B. In the majority of cells (37), the amplitude versus burst ISI plots were linearly fit and the J Neurophysiol • VOL
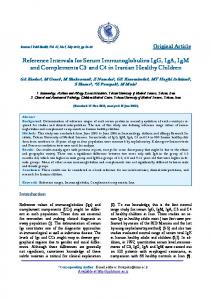
duration of the burst ISI was found to be negatively correlated with stimulus intensity (see R values and slopes, Table 1). The number of burst events and the range of ISI values increase significantly with higher contrasts (Table 1). For this reason, we will focus the remainder of the study on cells tested with contrasts ⱖ1.4 nA. Because it has been suggested that burst characteristics such as the number of spikes in a burst are correlated with the slope of the stimulus upstrokes (Kepecs et al. 2002), we also investigated the relationship between burst ISI and the slope of the stimulus upstroke. The average slope between the two doublet spikes was weakly related to the ISI (R: ⫺0.39 ⫾ 0.19, slope: ⫺11 ⫾ 7.0 ms/nA) and varied between positive and negative values with many values near zero. This suggested that the burst spikes straddle the peak of a stimulus upstroke which was verified by ascertaining the location of the maximum stimulus amplitude with respect to the time between two doublet spikes (Fig. 3A). In this graph, the horizontal axis is the normalized distance between the time of the first spike (S1) and the time of the second spike (S2) of the doublet: (tS2 ⫺ tS1)/ISI. The location of the stimulus maximum was determined by (tmax ⫺ tS1)/ISI, where tmax is the time of the stimulus maximum. Values on the vertical axis are the proportion of maxima over all doublets that occur at a given location between the two spikes (contrast: 1.4 nA, n ⫽ 20). This distribution has a peak between the first spike (S1) and second spike (S2) of the doublet showing that ⬃86% of bursts straddle stimulus peaks. There is also a peak at S2, demonstrating that ⬃12% of doublets occur entirely on the upstroke, but very few (2%) occur on the downstroke (S1). Based on these results, we found that the average slope of the stimulus between the first spike and the maximum of the upstroke is correlated with burst ISI (R: ⫺0.65 ⫾ 0.12, slope (fit): ⫺31 ⫾ 7.7 ms2/nA, n ⫽ 20, Fig. 3B). In addition, the average slope 5 ms preceding the first spike of the burst was correlated with burst ISI (R: ⫺0.61 ⫾ 0.08, slope (fit): ⫺12.4 ⫾ 1.9 ms2/nA, n ⫽ 20). The burst ISIs were partitioned into ISI event groups according to a window value (T ⫽ 2 ms; see METHODS). Histograms of the corresponding amplitude and slope values for these groupings are presented in Fig. 4. These results are for a single cell but comparable results were obtained for all cells (data not shown). The histograms suggest that both amplitude and slope are discriminable based on burst ISI. However, because these parameters are correlated in the stimulus (R: 0.76 ⫾ 0.11), the correlation between slope and ISI is likely a consequence of the correlation between amplitude and ISI. The feature extraction technique that follows quantifies the discrimination of stimulus events on the basis of the entire upstroke that incorporates both amplitude and slope. Burst ISIs are both reliable and precise These results demonstrate a strong relationship between burst ISI and stimulus parameters (amplitude and slope of the upstroke) that suggests of an encoding of these parameters by the duration of the burst ISI. However, a requirement of any coding mechanism is that it is reliable: each time a stimulus feature is presented, the neuron produces the same response. In a subset of cells, the reliability and precision of burst events and ISIs was assessed using repeated presentations of the same broadband stimulus with a contrast of 1.4 nA. The occurrence
97 • APRIL 2007 •
www.jn.org
CODING WITH BURST INTERSPIKE INTERVALS TABLE
2735
1. Pyramidal cell spike train statistics in response to broadband Gaussian stimulation with varying contrast
Stimulus Contrast (⫾nA)
0.35
0.70
1.4
2.0
Firing rate, Hz BF BEF Minimum doublet ISI (ms) ISI versus amplitude R value Slope
11.6 ⫾ 5.3 0.058 ⫾ 0.074 0.027 ⫾ 0.034 n/a
16.3 ⫾ 6.3 0.181 ⫾ 0.147 0.080 ⫾ 0.062 4.6 ⫾ 1.3
21.9 ⫾ 8.2 0.342 ⫾ 0.187 0.151 ⫾ 0.081 3.3 ⫾ 0.89
26.8 ⫾ 8.6 0.453 ⫾ 0.198 0.189 ⫾ 0.07 2.9 ⫾ 0.41
⫺0.66 ⫾ 0.15 ⫺6.68 ⫾ 2.24
n/a n/a
⫺0.74 ⫾ 0.096 ⫺4.34 ⫾ 1.26
⫺0.71 ⫾ 0.11 ⫺3.05 ⫾ 0.64
The means ⫾ SD of the neural responses to the same 0 to 60-Hz Gaussian stimulus presented at four different contrasts 0.35, 0.70, 1.4, and 2.0 nA. The burst fraction (BF) is the number of spikes contained in bursts divided by the total number of spikes. The burst event fraction (BEF) is the number of burst occurrences divided by the total number of spike train events (isolated spikes plus burst events). Each burst is counted as a single event regardless of the number of spikes it contains. The minimum doublet interspike interval (ISI) is for burst events defined by ISIs ⬍10 ms. The R value and the slope of the linear fit between burst ISI and stimulus upstroke amplitude is reported for each contrast. The abbreviation n/a corresponds to occasions when there were insufficient bursts for analysis.
of burst events was reproducible across trials and the average reliability of these events was 0.73 ⫾ 0.19 (Fig. 5B). In addition, the timing of the burst event (as determined by the 1st spike of the burst) was precise (0.8 ⫾ 0.5 ms) from trial to trial (see METHODS for measures of reliability and precision). The
A
9 2.0 nA 1.4 nA 0.7 nA
8
Burst ISI (ms)
burst ISIs were also reproducible from trial to trial (Fig. 5, A–C); the square root of the mean variance of the ISI was (0.6 ⫾ 0.6 ms). Finally, the relationship between ISI and stimulus amplitude (Fig. 2) or slope (not shown) is demonstra-
7
6
5
4
3 1.5
1.0
0.5
2.0
Stimulus Amplitude (nA)
B < 4 ms < 5 ms < 6 ms < 7 ms < 8 ms < 9 ms
1.5
BTA (nA)
1.0
0.7 nA
1.4 nA
2.0 nA
0.5
0.0
-0.5 -20
-10
ms
0
-20
-10
ms
0 -20
-10
0
ms
FIG. 2. Correlation between the doublet ISI and stimulus characteristics. A: burst ISI plotted against the mean stimulus amplitude between the 2 spikes of the doublet for 3 contrasts; open triangles, 0.7 nA; gray solid circles, 1.4 nA; black solid squares, 2.0 nA; tested in a single cell. Note the increased range of ISIs and stimulus intensities with contrasts ⱖ1.4 nA. B: burst-triggered averages (BTA) for each ISI group (1-ms windows) at each contrast tested for the cell in A. The BTAs were anchored on the 2nd spike of the burst (0 ms). The timing of the 1st spike is indicated by the colored dot on each curve. The amplitude of the each BTA is plotted in A against the burst ISI as a corresponding colored symbol of shape designated for contrast as described in A.
J Neurophysiol • VOL
FIG. 3. Relationship between burst ISI and the slope of stimulus upstrokes. A: location of the maximum stimulus amplitude between the 2 doublet spikes. Values on the x axis correspond to the normalized distance between the time of the 1st spike (S1 ⫽ 0) and the time of the 2nd spike (S2 ⫽ 1) of the doublet: (tS2 ⫺ tS1)/ISI. The location of the stimulus maximum was determined by (tmax ⫺ tS1)/ISI, where tmax is the time of the maximum. Values on the y axis are the proportion of maxima over all doublets that occur at a given location between the 2 spikes (contrast: 1.4 nA, n ⫽ 20). Values near S1 (0) on the x axis correspond to bursts occurring at or near the stimulus peak and ending on the downstroke, whereas values at S2 (1) indicate that the burst occurs on the upstroke. Intermediary values correspond to doublets that straddle the stimulus peak. B: relationship between burst ISI and the average slope between the 1st doublet spike and time of the stimulus maximum for a representative cell (R: 0.815, slope, ⫺31.8).
97 • APRIL 2007 •
www.jn.org
2736
A.-M.M. OSWALD, B. DOIRON, AND L. MALER
ble over repeated stimulus presentations (Fig. 5D). Thus bursts are both reliable and precise indicators of the occurrence of a stimulus upstroke and the burst ISI is a reliable encoder of the upstroke intensity. Evaluating the ISI code We expand on the feature detection measure described by Metzner et al. (1998) to demonstrate the potential of burst ISIs to discriminate and potentially code for distinct stimulus features. This measure differs from simpler discriminability measures in that the stimulus features that comprise a segment of the dynamic stimulus over time are discriminated rather than make assumptions about the discrimination of a single parameter such as maximum amplitude or slope. A detailed description of the interval coding measure (IC) is outlined in METHODS. Here we present the feature discrimination results for burst ISIs that are partitioned into interval groups separated by multiples of 2 ms (T ⫽ 2 ms). We follow this with a demonstration of the effect of varying T from 1 to 8 ms on the overall discriminability of the neuron (ID), the number of features coded (NC), and finally our measure of interval coding (IC). The stimulus features (s) were partitioned into the following response distributions [Ri, i ⫽ 1 to (ISImax ⫺ ISImin)/T]: 3–5 ms (R1, thick black), 5–7 ms (R2, thick gray), 7–9 ms (R3, thin black), 9 –11 ms (R4, thin gray) based on the burst ISI and T ⫽
FIG. 5. Reliability and precision of bursts and burst ISIs. A: cells were stimulated with repeated presentations of frozen 0- to 60-Hz Gaussian noise (gray trace) with a SD of 1.4 nA. B: raster plots of the response of a representative cell to repeated presentations of the stimulus in A. Burst events are indicated by brackets and asterisks. The corresponding burst ISI values for each trial (black squares) along with the average ISI (white circle, ⫾ SD) are plotted in A (left, vertical axis) and aligned with the associated stimulus features for the bursts indicated in B. C: membrane potential responses (n ⫽ 10) that gave rise to the spike times circled in B demonstrating the precision of the burst ISI. D: burst ISI vs. maximum stimulus amplitude between spikes averaged for each burst over all trials, error bars SD of the ISI.
FIG. 4. Distributions of amplitudes and slopes corresponding to burst ISIs grouped according to 2 ms windows. Results are from the single cell presented in Figs. 2 and 3. A: amplitudes corresponding to 3 to 5 ms doublets (black), 5 to 7 ms doublets (dark gray), 7- to 9 ms doublets (black line), and 9- to 11 ms doublets (light gray). B: average slope (as calculated in Fig. 3) for each ISI group as defined in A.
J Neurophysiol • VOL
2 ms. The BTA for each event distribution is shown in Fig. 6A1. The first step in determining the discriminability of the ISIs of a given Ri is to ascertain how well those intervals detect the optimal feature for that Ri versus all nonspike (null, R0) features. The optimal feature that maximizes the separation between each event distribution and the null distribution is presented in Fig. 6A2. Each stimulus vector was then projected onto the optimal feature fi0 to give estimates of P(fi0T䡠s兩R0) and P(fi0T䡠s兩Ri). If P(fi0T䡠s円R0) (dashed lines) and the P(fi0T䡠s円Ri) (solid lines) do not substantially overlap, the ISIs of the event distribution are considered discriminating (Fig. 6B). To quantify this intuition, we assume a linear classifier and compute the probability of false alarm (PFA), the probability of correct detection (PD), and the subsequent error rate, . When is plotted against PFA, this curve is minimized at min, (Fig. 6C). The feature discrimination of each event distribution versus the null distribution is exceptional as indicated by the low min,
97 • APRIL 2007 •
www.jn.org
CODING WITH BURST INTERSPIKE INTERVALS
A1
2737
detect distinct stimulus features that are discriminable from neighboring groups. Note that not only are the ␥ values high, there is gradation in the detection of shorter ISIs versus longer ISIs. This is not surprising given that bursts, especially those with very short ISIs, have a higher threshold for generation and are less likely to happen by chance. The measure of how well an ISI event group codes was determined as the discrimination of the Ri versus the null, ␥i0, multiplied by discrimination of the Ri versus the nearest neighbor groups (Rj), ␥ij, weighted by the proportion (pi) of bursts in that comprise Ri (Eq. 4). For the cell presented in Figs. 6 and 7, the proportion of bursts in each ISI group was R1: 0.27, R2: 0.43, R3: 0.20, and R4: 0.10. Thus the discrimination of group R2 (5–7 ms) is equal to ␥20␥23␥21p2 ⫽ 0.27 and group R3 is ␥30␥34␥32p3 ⫽ 0.11. Because there is not an ISI group ⬍3–5 ms nor ⬎9 –11 ms, the discrimination of these intervals (1, 4) is given by: ␥10␥12p1 ⫽ 0.21 and ␥40␥43 p4 ⫽ 0.05, respectively. These values are then summed over all groups (Eqs. 2
A2
B
C
FIG. 6. Discriminability of distributions associated with burst ISIs vs. the null distribution. The bursts were divided into response groups based on burst ISI and a T ⫽ 2 ms window (see METHODS). The groups were as follows: R1: 3–5 ms ISIs (thick black), R2: 5–7 ms (thick gray), R3: 7–9 ms (thin black), R4: 9 –11 ms (thin gray). A1: burst triggered average for each group; t ⫽ 0 corresponds to the time of the 2nd burst spike. A2: optimal feature that separates each response distribution from the null distribution. B: feature projections for each response distribution (solid lines) vs. the null distribution (dashed lines). C: probability of misclassification vs. the probability of false alarm for each event distribution. The minimum of each of curve is the error rate, i0 for that response group.
(i0), values for each group: R1, 0.02; R2, 0.05; R3, 0.08; and R4, 0.09. We use this value as the basis for our measure of discrimination, ␥i0 ⫽ 1 ⫺ 2(i0), such that ␥ values are numbers between 0 and 1, with 1 being perfect discrimination. The corresponding ␥i0 values were 0.96, 0.89, 0.82, and 0.82, respectively. These values were typical for all cells tested. The second step in calculating discriminability of Ri is to determine how separable is the distribution of stimulus vectors that elicit a given ISI from the distributions of neighboring ISIs. The preceding procedure was repeated, but this time it was the distributions between neighboring intervals that were compared. Figure 7A shows the optimal features that separate the groups: R1:R2, black; R2:R3, gray; and R3:R4, dashed. Figure 7B, 1–3, shows the corresponding feature projections (R1, thick black; R2, thick gray; R3, thin black; R4, thin gray). Given the misclassification error curve (ij vs. PFA; see Fig. 7C), we compute the minimal error and the associated ␥ij. The ␥ij values between groups were as follows: R1:R2, 0.89; R2:R3, 0.82, and R3:R4, 0.74. Thus bursts within a specific ISI range J Neurophysiol • VOL
FIG. 7. Discriminability between burst ISI distributions. The bursts were divided into event groups based on burst ISI and a T ⫽ 2 ms window (see METHODS). The groups were as follows: R1: 3–5 ms ISIs, R2: 5–7 ms, R3: 7–9 ms, R4: 9 –11 ms. A: optimal feature that separates 2 neighboring ISI response distributions R1:R2 (black), R2:R3 (gray), and R3:R4 (dashed); t ⫽ 0 corresponds to the time of the 2nd burst spike. B: feature projections for each response distribution vs. the neighboring distribution: B1: R1 (black) vs. R2 (gray); B: R2 (gray) vs. R3 (black); and B3: R3 (black) vs. R4 (gray). C: probability of misclassification vs. the probability of false alarm for each response distribution vs. the neighboring distributions, R1:R2 (black), R2:R3 (gray), and R3:R4 (dashed). The minima of these curves are the error rates, ij.
97 • APRIL 2007 •
www.jn.org
2738
A.-M.M. OSWALD, B. DOIRON, AND L. MALER
FIG. 8. Interval discrimination and interval coding vs. discrimination window (T). A: mean summed interval discriminability (ID, left axis, Eq. 3) over all cells for each T (ms) based on the 2nd spike of the burst (black filled circles) or the first spike of the burst (gray triangles). The mean number of features coded at each T is also plotted (open circles, right axis). B: mean interval coding (IC) values for each T. Error bars are the SD and asterisks corresponds to a significant increase in discriminability (A) or decrease in interval coding (B) (P values ** ⬍0.01, * : ⬍0.05) from the previous T value.
and 3) to produce a measure of interval discriminability, ID, which has a maximum possible value of 1. The ID in the present example (T ⫽ 2 ms) was 0.63. The mean ID over all cells (solid circles) is plotted against the duration of the window, T (Fig. 8A). Generally ID increases with increasing window duration, T. Initially ID increases dramatically from 1 and 2 ms (**, P ⬍⬍ 0.01, n ⫽ 20). This is suggestive of 2-ms ISI differences being the minimal discriminability of the neuron. Further increases were also significant (**, P ⬍ 0.01;*, P ⬍ 0.05) between ensuing windows. The increase in ID can be attributed almost entirely to the discrimination between neighboring groups, ␥ij, which on average increases from 0.46 to 0.91 with increasing T versus the null, ␥i0, which remains relatively constant (0.85– 0.91). Thus we could remove the comparison of Ri versus R0 (i.e., ␥i0 ⫽ 1), and our results would be qualitatively similar. As described in METHODS, the stimulus vectors that gave rise to bursts were determined as the region 50 ms preceding the second spike of the burst. Because previous studies have focused on the first spike of the burst as carrying the majority of information about the stimulus feature, we questioned whether a similar level of discriminability was possible when only the first spike is considered. In this case, the stimulus vectors are the region 50 ms prior to the first spike but are still J Neurophysiol • VOL
grouped according to ISI as previously described so that pi remains the same. The ␥i0 ranged from 0.65 to 0.8, indicating that the first spike of a burst is a good discriminator of the occurrence of an upstroke as previously shown (Gabbiani et al. 1996; Metzner et al. 1998; Oswald et al. 2004). However, ␥ij, values decreased substantially ranging from 0.05 to 0.4, indicating that the event distributions are no longer discriminable from each other. The resulting mean ID values are shown in Fig. 8A, gray triangles. The most dramatic drops were in the T ⫽ 1–5 ms range, however all values are significantly less (P ⬍⬍ 0.01) than the ID corresponding to the second spike of the burst. These results suggest that it is the properties of the region between the two spikes is discriminated and thus coded by doublet ISI. However, setting t based on the timing of the second spike produces a temporal shift in the stimulus vectors that misaligns the common features of these distributions (the upstrokes). This introduces a slight bias toward increased discriminability. We explored the alternative by anchoring our analysis at the first spike and then choosing a common point, t, following the first spike for all ISIs (not shown). As expected, aligning the upstrokes decreases discrimination because the features are more similar. However, additional biases toward decreased discriminability are introduced depending on the t chosen. Selecting t ⫽ 3–5 ms after the first spike obeys causality for all ISIs but neglects stimulus information for ISIs ⬎3–5 ms and decreases discrimination (comparable to that shown in Fig. 8A, gray triangles). Alternatively, selecting 11 ms includes the stimulus information contained in all ISIs but also associates noncausal stimulus information with shorter ISIs (in many cases adds downstrokes). This artificially makes the stimulus features associated with the ISIs more similar, each consisting of an upstroke and downstroke, and in this case, discrimination is decreased by an average of 21 ⫾ 17%. It is thus apparent that biases are introduced when the analysis is anchored at either spike, but anchoring on the second spike respects causality and ensures that all stimulus information is retained. In addition, because increases in stimulus amplitude are correlated with increases in slope, this causes a natural temporal shift (decrease) in the response time of the neuron that is reflected in the timing of both the first and second spike of the burst. It is doubtful that these shifts are “realigned” by a downstream decoding neuron before a discriminating response is made. The number of potential features, NF, that can be represented by burst ISIs is equal to the number of defined event groups (see METHODS). The number of intervals coded, NC, corresponds to those groups that have a proportion of bursts ⬎1%. Unlike ID, the NC decreases with increasing window duration (Fig. 8A). Thus T ⫽ 1 ms yields the highest number of features (6 – 8) but also the lowest discriminability, whereas T ⬎ 6 ms yield the highest ID values but potentially code the lowest number of features (1–2). When ID is multiplied by NC, we have our primary measure IC, which quantifies the success of the interval code. For IC to be high, both the number of stimulus features and their respective discriminability from one another needs to be high. The IC values for T corresponding to 1–3 ms differences between ISIs that correspond to multiple features being discriminated are nearly double those when all bursts are treated as coding for a single features (T ⫽ 6 – 8 ms; Fig. 8B). This implies that the capacity for the spike train to code for the stimulus could be significantly increased if a
97 • APRIL 2007 •
www.jn.org
CODING WITH BURST INTERSPIKE INTERVALS
decoding neuron were able to discriminate differences of 2–5 ms between ISIs. Limitations of interval coding Because bursts are spike train events that are easily identifiable as a peak in the 3- to 10-ms range of the bimodal ISI histogram, we focused on doublet ISIs as the units of the interval code. However, this does not necessarily preclude longer ISIs from interval coding. We investigated whether the duration of ISIs ⬎10 ms could code additional information about the stimulus. We focused on ISIs in the second peak of the ISI histogram (10 –50 ms). These were grouped into ISI event groups according to a T of 10 ms. This longer T allowed for sufficient counts in each distribution to do a discriminability analysis. The event-triggered averages are shown in Fig. 9A. It is apparent that the average intensity of the stimulus is equivalent for all event groups. The only distinguishing characteristics of these triggered averages is the timing of the peak that precedes the second spike at t ⫽ 0. These peaks occur at the mean ISI value
A
B
2739
for each group. The ISI event distributions are discriminable from each other as indicated by low probability of misclassification values (Fig. 9B). However, it is clear from the optimal feature (Fig. 9B, inset) that it is the time interval between peaks that is being discriminated. Because the timing of each spike corresponds to the timing of a stimulus peak, these intervals reflect the coding of the timing stimulus events by the timing of spike train events. These results suggest that a requirement for an ISI to code additional information about the stimulus beyond the timing of events is that the ISI is shorter than the minimum period of the stimulus. We investigated whether this was the sole requirement by determining the discriminability of ISIs ⬎ 10 ms in response to low-frequency, 0-10 Hz Gaussian stimulation (Fig. 10A). Because the ISI histograms indicate that most intervals are ⬍30 ms (Fig. 10B), we assessed event groups from 10 to 30 ms with a T of 5 ms. The event-triggered averages are presented in Fig. 10C. There appears to be a relationship between amplitude and interval in that shorter ISIs do correspond to higher amplitude stimuli. However, projection of the stimulus vectors onto the optimal features (Fig. 10E, inset) that separate the event distributions show a high degree of overlap (Fig. 10D) that corresponds to a high probability of misclassification (Fig. 10E). The mean ␥i0 (gray bars) and ␥ij (black circles) values for all cells tested are presented in Fig. 10F. The discriminability of an interval versus null and versus neighboring intervals decreases significantly with interval length from 10 to 25 ms (**P ⬍ 0.01, *P ⬍ 0.05). It has been shown that longer intervals required longer windows to be discriminable from neighboring intervals (de Ruyter van Steveninck and Bialek 1988). However, increasing T to 10 ms only marginally improved discriminability (data not shown). One reason for this lack of discriminability is that many different ISIs occur on the same upstroke each corresponding to similar information about that stimulus event (Fig. 10A). Because the information for a given ISI is not discriminable from other ISIs, it is unlikely that individual intervals provide more information about the intensity of the upstroke than the maximum instantaneous firing rate (1/minimum ISI of upstroke) or the average firing rate. These are plotted against the maximum amplitude of the upstroke (Fig. 10G, instantaneous FR: open circles, average FR: black circles). For comparison, the instantaneous firing rate of each interval (1/ISI) is also plotted (gray circles). Thus although shorter than the minimum period of the stimulus (100 ms), these intervals comprise a rate code but not an interval code as defined in this study. DISCUSSION
ISIs as a candidate neural code
FIG. 9. Discriminability of ISIs ⬎10 ms in response to 0- to 60-Hz stimulation. A: triggered averages for ISIs ⬍20 ms (thick black), ⬍30 ms (thick gray), ⬍40 ms (thin black), ⬍50 ms (thin gray) where t ⫽ 0 corresponds to the time of the 2nd spike of the ISI. B: probability of misclassification vs. the probability of false alarm for between distribution comparisons: ⬍20 vs. ⬍30 ms (black), ⬍30 vs. ⬍40 ms (gray), and ⬍40 vs. ⬍50 (dashed). The corresponding optimal features that separate these distributions are shown in the inset, t ⫽ 0 corresponds to the time of the 2nd spike of the interval.
J Neurophysiol • VOL
Studies of neural coding have suggested the following requirements for a potential neural code (for reviews, see Borst and Theunissen 1999; Perkel and Bullock 1968; Theunissen and Miller 1995). First, a stimulus attribute such as frequency or intensity is correlated with a neural response such as the firing rate, spike timing, or the occurrence of bursts. Second, the neural response is reliable and precise. Third, the neural response is decoded by a target neuron. Because this third requirement is often difficult to ascertain, assumptions are made about the decoding process. The correlation between
97 • APRIL 2007 •
www.jn.org
2740
A.-M.M. OSWALD, B. DOIRON, AND L. MALER
FIG. 10. Discrimination by intervals ⬎10 ms in response to low-frequency stimulation. A: pyramidal cell response (black) to 0-10 Hz Gaussian stimulation (gray). B: ISI histograms of the pyramidal cell response shown in A. C: interval triggered averages for intervals (in ms) ⬍15 (thick black), ⬍20 (thick gray), ⬍25 (thin black), and ⬍30 (thin gray). D: feature projections for comparisons between the interval distributions (shown) and the null distribution (not shown). E: probability of misclassification vs. probability of false alarm for comparisons between the distributions. The corresponding optimal features are shown in the inset. F: mean discriminability values: ␥i0 (gray bars) and ␥ij (solid circles) for all cells tested, error bars are the SD. The discriminability of an interval vs. null and vs. neighboring intervals decreases significantly with interval length from 10 to 25 ms (**, P ⬍ 0.01; *, P ⬍ 0.05). G: maximum instantaneous firing rate (1/minimum ISI per upstroke; open circles) and the average firing rate (black circles) vs. the maximum amplitude of the upstroke. For comparison, the instantaneous FR of each interval (1/ISI) is plotted as well (gray circles).
stimulus attributes and the neural response is then quantified based on these assumptions to obtain measures of information transfer. In a review of candidate neural codes, Perkel and Bullock (1968) outline a number of plausible means by which information may be transferred in the duration of the ISIs. It has been shown that short ISIs are more discriminating, require shorter windows of separation to be discriminated, and carry more information per event than longer ISIs (de Ruyter van Steveninck and Bialek 1988). In the present study, we demonstrate that burst ISIs are correlated with the amplitude and slope of stimulus upstrokes. We also show that burst events are reliable and precise to within a millisecond, and that the variability of the burst ISI is in the sub-millisecond range. The low variability in the ISI enables the discrimination of stimulus events based on burst ISI. Our results suggest that stimulus features may be reliably encoded in the duration of the burst ISIs, which form the basis of an interval code. We also demonstrate two additional requirements for an interval code. First, the ISIs must be shorter than the minimum time scale of the stimulus for a temporal encoding of stimulus features in the ISI (Theunissen and Miller 1995). The ISIs of isolated spikes are greater than the minimum period of the stimulus and do not code additional information about the stimulus in their ISI apart from the timing stimulus upstrokes. The second requirement for an interval code is that the number and variability of intervals that code a single event is small. In response to solely low-frequency stimuli, the majority of ISIs are less than the minimum period of the stimulus and are correlated with stimulus amplitude. However, because a number of different intervals occur on the same upstroke, the J Neurophysiol • VOL
amplitude of the upstroke cannot be discriminated based on a single ISI. The quality of the interval code, as measured by IC, is dependent on the number of features coded and the discrimination of those features based on the neural response. The number of stimulus features, NC, is determined by the range of burst ISIs and the choice of discrimination window, T. The discriminability of the intervals, ID, is dependent on the variability of the neural response that dictates a minimal T. Moreover, there is a trade off between the number of features coded and discriminability depending on the T chosen. Shorter discrimination windows yield a high number of features but lower discriminability, whereas longer windows yield higher discrimination of fewer features. In the present study, this relationship is optimized by a T ⫽ 2–3 ms where four and three stimulus features, respectively, are discriminable based on ISI. It is possible that this lower bound on resolution may be due to undersampling. If T ⫽ 1 ms, the number of bursts in each response group may be insufficient for each ISI group to contribute to our measure of neural discriminability. We sequentially partitioned the stimulus features according to burst ISIs using uniform, 1-ms increments in T to identify both the minimal T for discriminability (2 ms) and the optimal T (2–3 ms) that maximized the IC. It is conceivable that using the more rigorous quantization theory to guide a nonuniform partitioning would likely produce better discrimination values (Dimitrov and Miller 2001; Dimitrov et al. 2003). Interestingly, the amount of information recovered by nonuniform, optimal partitioning of spike trains from the cricket cercal system is limited by the precision in spike timing and yields similar optimal differences between ISIs (Dimitrov et al. 2003). Likewise, the spike precision in the present study is ⬃1 ms, which
97 • APRIL 2007 •
www.jn.org
CODING WITH BURST INTERSPIKE INTERVALS
suggests that spike time jitter, rather than undersampling, limits the discriminability of the system. Finally, it is difficult to conceive of synaptic dynamics that could distinguish differences of ⬍1 ms, so a 2-ms minimum difference seems appropriate. The IC values obtained in this study indicate that a significant amount of additional encoding could be transferred if a decoding cell could discriminate ISIs rather than treat all bursts as unitary events. This interval code is quite distinct from a standard rate code or the recently introduced interval distribution code (Lundstrom and Fairhall 2006). These latter codes require an accumulation of spike or interval events over time so as to compute a statistic (rate code) or an estimate of the full distribution (interval distribution code). The interval code we have outlined uses the occurrence of only two spikes in short succession (⬍10 ms) as an indicator of a stimulus feature (amplitude or slope). No averaging (either over time or population) is required thus making our putative code more similar to a temporal code. Unfortunately, the current data sets are insufficient to conduct an information theoretic analysis to quantify the interval code (de Ruyter van Steveninck and Bialek 1988). In our companion paper (Doiron et al. 2007), we present a simplified pyramidal cell model that captures the spike train statistics of neural responses presented in this study. We further introduce a stimulus reduction that hypothesizes a canonical burst upstroke the scale of which simultaneously defines both the amplitude and slope of the stimulus. We use both the simplified model and this stimulus reduction to quantify the information transferred within the burst ISIs. Burst dynamics and neural coding Bursts are ideal candidate coding elements because burst mechanisms often have different threshold requirements than isolated spikes (for reviews, see Krahe and Gabbiani 2004; Wang and Rinzel 1995). Thus a bursting neuron could selectively encode certain stimulus features with bursts and others with isolated spikes (Alitto et al. 2005; Lesica and Stanley 2004; Oswald et al. 2004). Furthermore, the autocatalytic aspect of spike generation within a burst and the subsequent quiescent phase produce short ISIs without an increase in the mean firing rate. This is an essential feature because replacing burst dynamics with high-frequency firing to produce short ISIs reduces the discriminability of these intervals (Oswald et al. 2004). In ELL pyramidal cells, the duration of the burst ISI is determined by the interaction between stimulus-induced depolarization and the depolarizing afterpotential (DAP) from the active backpropagation of spikes along apical dendrite. This impact of this interaction on information transfer will be further explored in our companion paper (Doiron et al. 2007). Interval coding in the electrosensory system The ELL is the first processing center for the electric sense. Electric fish produce an electric organ discharge (EOD), a quasi-sinusoidal wave that ranges from 600 (females) to 1,000 Hz (males) (Dunlap and Larkins-Ford 2003; Dunlap et al. 1998), which is used for electrolocation and communication. Distortions of this electric field produce amplitude modulations (AMs) of the EOD. Prey produce low-frequency AMs
ENCODING.
J Neurophysiol • VOL
2741
(⬍10 Hz), whereas interactions with other fish produce a range of AM frequencies (⬍10 to ⬎100 Hz). These AMs are accurately tracked by the spike responses of cutaneous electroreceptor cells (Chacron et al. 2005; Kreiman et al. 2000; Wessel et al. 1996), which relay this information to ELL pyramidal cells. Unlike the receptor cells, many pyramidal cells are poor linear estimators of electrosensory stimuli (Metzner et al. 1998) even under optimal stimulus conditions (Chacron et al. 2003). Nonetheless, ELL pyramidal cells are tuned to the frequency content, spatial extent, and spatial correlation of the stimulus (Chacron et al. 2003; Doiron et al. 2003; Oswald et al. 2004). In the present study, we increased stimulus contrast as a simplistic mimic of the degree of pyramidal cell excitation that arises from both the fraction of the cell’s receptive field stimulated based on the size, location, and motion of the object as well as center-surround or nonclassical receptive field effects (Bastian et al. 2002; Chacron et al. 2003; Lewis and Maler 2001; Rasnow 1996). We have demonstrated that in addition to bursts coding for the occurrence of low-frequency prey-like events (Oswald et al. 2004), the intensity of these features can be encoded by in the burst ISI. Interestingly, we have also shown that short ISIs are not discriminating for stimulus amplitude during solely low-frequency stimulation. Thus the interval code requires simultaneous low (⬍10 Hz)and high-frequency (20 – 60 Hz) stimulation to produce doublet events with unique ISIs that code specific stimulus features. This mixture of frequencies will occur naturally when the fish forages in groups (Ramicharitar et al. 2004; Tan et al. 2005). When two nearby fish have similar EOD frequencies, interactions of the EODs lead to beat frequencies ⬍10 Hz that interfere with prey signals (Heiligenberg and Partridge 1981; Heiligenberg and Rose 1985). These fish use a well-described, jamming-avoidance response (JAR) to alter their EOD frequencies such that interactions with nearby fish produce beat frequencies ⬎20 Hz (Heiligenberg 1980; Matsubara and Heiligenberg 1978). Thus during foraging, the low-frequency prey signals become concurrent with higher-frequency conspecific interactions. The intrinsic cellular mechanisms that give rise to the dependency of burst ISIs on mixed frequency inputs is explored in our companion paper (Doiron et al. 2007). DECODING. ELL pyramidal cell output is decoded in the torus semicircularis (TS), a midbrain structure similar to the inferior colliculus of mammals (Bell and Maler 2004). Although it is not known whether TS neurons decode the duration of burst ISIs, i.e., respond differently to burst ISIs differing by a few milliseconds, the physiological substrates for such decoding appear to be present. In a related electric fish, TS cells demonstrate frequency tuning in response to stimulation applied at the skin as well as at the synaptic level. Interestingly, cells that respond to low-frequency electrosensory input show facilitating synaptic responses to high-frequency (burst-like) inputs from the ELL, whereas mid-range frequency inputs are suppressed through depression (Fortune and Rose 1997, 2001, 2003). It has been proposed that interactions between the time course and frequency thresholds for synaptic facilitation and depression could result in the selective transmission of inputs that have frequencies that are resonant with the synaptic dynamics (Izhikevich et al. 2003). Alternatively, certain burst ISIs may match a resonance time scale in the subthreshold membrane dynamics of the postsynaptic neuron that could
97 • APRIL 2007 •
www.jn.org
2742
A.-M.M. OSWALD, B. DOIRON, AND L. MALER
enhance the transfer of specific ISIs over other ISIs (Izhikevich et al. 2003). In addition, ELL pyramidal afferents synapse with toral interneurons that then synapse with toral principle cells (Maler, unpublished observations). The combination of plasticity and disynaptic interactions may further frequency filter ELL inputs as has been suggested for thalamocortical connections (Beierlein et al. 2002). Although, it is conceivable that plasticity at ELL-torus synapses promotes the transfer of lowfrequency information by bursts, it is unknown whether plasticity, disynaptic interactions, or subthreshold membrane dynamics occur with time scales that would enable the discrimination different burst ISIs. Nonetheless, our results, as well as those of the visual system (de Ruyter van Steveninck and Bialek 1988; Reich et al. 2000) suggest that additional information about a stimulus can be contained in short ISIs provided an appropriate decoder can be identified. ACKNOWLEDGMENTS
Present address of A.-M.M. Oswald and B. Doiron: Center for Neural Science, New York University, 4 Washington Pl., New York, NY 10003. GRANTS
This work was supported by grants provided by the Canadian Institutes of Health Research to L. Maler and Ontario Graduate Scholarships to A.-M.M. Oswald and B. Doiron. REFERENCES
Alitto HJ, Weyand TG, Usrey WM. Distinct properties of stimulus-evoked bursts in the lateral geniculate nucleus. J Neurosci 25: 514 –523, 2005. Bastian J, Chacron MJ, Maler L. Receptive field organization determines pyramidal cell stimulus-encoding capability and spatial stimulus selectivity. J Neurosci 22: 4577– 4590, 2002. Bastian J, Chacron MJ, Maler L. Plastic and non plastic cells perform unique roles in a network capable of adaptive redundancy reduction. Neuron 24: 4351– 4362, 2004. Bastian J, Nguyenkim J. Dendritic modulation of burst-like firing in sensory neurons. J Neurophysiol 85: 10 –22, 2001. Beierlein M, Fall C, Rinzel J, Yuste R. Thalamocortical bursts trigger recurrent activity in neocortical networks: layer 4 as a frequency-dependent gate. J Neurosci 22: 9885–9894, 2002. Bell CC, Maler L. Central neuroanatomy of electrosensory systems in fish. In: Springer Handbook of Auditory Research: Electroreception, edited by Bullock TH, Hopkins CD, Popper AN, Fay RR. Berlin: Springer, 2005, vol. 21, p. 68 –111. Berman NJ, Plant J, Turner R, Maler L. Excitatory amino acid transmission at a feedback pathway in the electrosensory system. J Neurophysiol 78: 1869 –1881, 1997. Berry MJ 2nd, Meister M. Refractoriness and neural precision. J Neurosci 18: 2200 –2211, 1998. Bezdudnaya T, Cano M, Bereshpolova Y, Stoelzel CR, Alonso JM, Swadlow HA. Thalamic burst mode and inattention in the awake LGNd. Neuron 49: 421– 432, 2006. Borst A, Theunissen F. Information theory and neural coding. Nat Neurosci 2: 947–957, 1999. Chacron MJ, Doiron B, Maler L, Longtin A, Bastian J. Non-classical receptive field mediates switch in a sensory neuron’s frequency tuning. Nature 423: 77– 81, 2003. Chacron M, Maler L, Bastian J. Electroreceptor neuron dynamics shape information transmission. Nat Neurosci 8: 673– 678, 2005. de Ruyter van Steveninck R, Bialek W. Real-time performance of movement-sensitive neuron in the blowfly visual system: coding and information transfer in short spike sequences. Proc Royal Soc Lond B Biol Sci 234: 379 – 414, 1988. Debusk BC, Debruyn EJ, Snider RK, Kabara JF, Bonds AB. Stimulusdependent modulation of spike burst length in cat striate cortical cells. J Neurophysiol 78: 199 –213, 1997. Dimitrov A, Miller JP. Neural coding and decoding: communication channels and quantization. Network: Comput Neural Syst 12: 441– 472, 2001. J Neurophysiol • VOL
Dimitrov A, Miller JP, Gedeon T, Aldworth Z, Parker AE. Analysis of neural coding through quantization with an information-based distortion measure. Network: Comput Neural Syst 14: 151–176, 2003. Doiron B, Chacron M, Maler L, Longtin A, Bastian J. Inhibitory feedback required for network oscillatory responses but not prey stimuli. Nature 421: 539 –543, 2003. Doiron B, Laing C, Longtin A, Maler L. Ghostbursting: a novel neuronal burst mechanism. J Comp Neurosci 12: 5–25, 2002. Doiron B, Longtin A, Turner RW, Maler L. Model of gamma frequency burst discharge generated by conditional backpropagation. J Neurophysiol 86: 1523–1545, 2001. Doiron B, Oswald AM, Maler L. Interval coding. II. Dendrite dependent mechanisms. J Neurophysiol 97: 2744 –2757, 2007. Duda R, Hart PE, Stork DG. Pattern Classification. New York: Wiley, 2001. Dunlap KD, Larkins-Ford J. Diversity in the structure of electrocommunication signals within a genus of electric fish, Apteronotus. J Comp Physiol [A] 189: 153–161, 2003. Dunlap KD, Thomas P, Zakon HH. Diversity of sexual dimorphism in electrocommunication signals and its androgen regulation in a genus of electric fish, Apteronotus. J Comp Physiol 183: 77– 86, 1998. Eggermont JJ. Is there a neural code? Neurosci Biobehav Rev 22: 355–370, 1998. Fortune ES, Rose GJ. Passive and active membrane properties contribute to the temporal filtering properties of midbrain neurons in vivo. J Neurosci 17: 3815–3825, 1997. Fortune ES, Rose GJ. Short-term synaptic plasticity as a temporal filter. Trends Neurosci 24: 381–385, 2001. Fortune ES, Rose GJ. Voltage gated Na⫹ channels enhance the temporal filtering properties of electrosensory neurons in the torus. J Neurophysiol 90: 924 –929, 2003. Gabbiani F, Metzner W, Wessel R, Koch C. From stimulus encoding to feature extraction in weakly electric fish. Nature 384: 564 –567, 1996. Grubb MS, Thompson ID. Visual response properties of burst and tonic firing in the mouse dorsal lateral geniculate nucleus. J Neurophysiol 93: 3224 – 47, 2004. Heiligenberg W. The jamming avoidance response in the weakly electric fish Eigenmannia. Naturwissenschaften 67: 499 –507, 1980. Heiligenberg W, Partridge BL. How electroreceptors encode JAR-eliciting stimulus regimes: reading trajectories in a phase-amplitude plane. J Comp Physiol 142: 295–308, 1981. Heiligenberg W, Rose GJ. Phase and amplitude computations in the midbrain of an electric fish: intracellular studies of neurons participating in the jamming avoidance response of Eigenmannia. J Neurosci 2: 515–531, 1985. Herrington J, Newton KR, Bookman RJ. B PULSE CONTROL V4.5: IGOR XOPS for Patch Clamp Data Acquisition and Capacitance Measurements. Miami, FL, 1995. Izhikevich EM, Desai NS, Walcott EC, Hoppensteadt FC. Bursts as a unit of neural information: selective communication via resonance. Trends Neurosci 26: 161–167, 2003. Kepecs A, Lisman J. Information encoding and computation with spikes and bursts. Network: Comput Neural Syst 14: 103–118, 2003. Kepecs A, Wang X-J, Lisman J. Bursting neurons signal input slope. J Neurosci 22: 9053–9062, 2002. Krahe R, Gabbiani F. Burst firing in sensory systems. Nat Rev Neurosci 5: 13–23, 2004. Kreiman G, Krahe R, Metzner W, Koch K, Gabbiani F. Robustness and variability of neuronal coding by amplitude-sensitive afferents in the weakly electric fish Eigenmannia. J Neurophysiol 84: 189 –204, 2000. Lemon N, Turner RW. Conditional spike backpropagation generates burst discharge in a sensory neuron. J Neurophysiol 84: 1519 –1530, 2000. Lesica N, Weng C, Jin J, Yeh CI, Alonso JM, Stanley GB. Dynamic encoding of natural luminance sequences by LGN bursts. PLoS Biol 4: e209, 2006. Lesica NA, Stanley GB. Encoding of natural scene movies by tonic and burst spikes in the lateral geniculate nucleus. J Neurosci 24: 10731–10740, 2004. Lewis JE, Maler L. Neuronal population codes and the perception of object distance in weakly electric fish. J Neurosci 21: 2842–2850, 2001. Lundstrom B, Fairhall AL. Decoding stimulus variance from a distributional neural code of interspike intervals. J Neurosci 26: 9030 –9037, 2006. Mainen Z, Sejnowski T. Reliability of spike timing in neocortical neurons. Science 268: 1503–1506, 1995. Maler L, Sas E, Johnston S, Ellis W. An atlas of the brain of the electric fish Apteronotus leptorhynchus. J Chem Neuroanat 4: 1–38, 1991.
97 • APRIL 2007 •
www.jn.org
CODING WITH BURST INTERSPIKE INTERVALS Martinez-Conde S, Macknik S, Hubel D. The function of bursts of spikes during visual fixation in the awake primate lateral geniculate nucleus and primary visual cortex. Proc Natl Acad Sci USA 99: 13920 –13925, 2002. Massaux A, Dutrieux G, Cotillon-Williams N, Manunta Y, Edeline J-M. Auditory thalamus bursts in the anesthetized and non-anesthetized states: contribution to functional properties. J Neurophysiol 91: 2117– 2134, 2004. Matsubara JA, Heiligenberg W. How well do electric fish electrolocate under jamming? J Comp Physiol 125: 285–290, 1978. Metzner W, Koch C, wessel R, Gabbiani F. Feature extraction by burst-like spike patterns in multiple sensory maps. J Neurosci 18: 2283–2300, 1998. Middleton J, Longtin A, Benda J, Maler L. The cellular basis for parallel neural transmission of a high-frequency stimulus and its low-frequency envelope. Proc Natl Acad Sci USA 103: 14596 –14601, 2006. Oswald AM, Chacron MJ, Doiron B, Bastian J, Maler L. Parallel processing of sensory input by bursts and isolated spikes. J Neurosci 24: 4351– 4362, 2004. Perkel DH, Bullock T. Neural Coding. Neurosci Res Prog Bull 6: 221–351, 1968. Ramicharitar J, Tan EW, Fortune ES. Role of short-term synaptic plasticity in the generation of direction selectivity for moving electrosensory images. Soc Neurosci Abstr 58: 57, 2004. Rasnow B. The effects of simple objects on the electric fish Apteronotus. J Comp Physiol 178: 397– 411, 1996.
J Neurophysiol • VOL
2743
Reich DS, Mechler F, Purpura KP, Victor JD. Interspike intervals, receptive fields, and information encoding in primary visual cortex. J Neurosci 20: 1964 –1974, 2000. Reinagel P, Godwin D, Sherman M, Koch C. Encoding of visual information by LGN bursts. J Neurophysiol 81: 2558 –2569, 1999. Reinagel P, Reid RC. Precise firing events are conserved across neurons. J Neurosci 22: 6837– 6841, 2002. Sherman M. Tonic and burst firing: dual modes of thalamocortical relay. Trends Neurosci 24, 2001. Tan E, Nizar JM, Carrera-G E, Fortune ES. Electrosensory interference in naturally occurring aggregates of a species of electric fish, Eigenmannia virescens. Behav Brain Res 164: 83–92, 2005. Theunissen F, Miller JP. Temporal encoding in nervous systems: a rigorous definition. J Comp Neurosci 2: 149 –162, 1995. Turner RW, Maler L, Deerinick T, Levinson SR, Ellisman MH. TTXsensitive dendritic sodium channels underlie oscillatory discharge in a vertebrate sensory neuron. J Neurosci 14: 6453– 6471, 1994. Turner RW, Plant JR, Maler L. Oscillatory and burst discharge across electrosensory topographic maps. J Neurophysiol 76: 2364 –2382, 1996. Wang X-J, Rinzel J. Oscillatory and bursting properties of neurons. In: The Handbook of Brain Theory and Neural Networks, edited by Arbib M. Cambridge, MA: MIT Press, 1995 p. 686 – 691. Wessel R, Koch C, Gabbiani F. Coding of time-varying electric field amplitude modulations in a wave-type electric fish. J Neurophysiol 75: 2280 –2293, 1996.
97 • APRIL 2007 •
www.jn.org