Jun 23, 1987 - edge UB^E =Qx(rL>E _-r0 ). The correlation of .... In the theo- retical work of .... Dynamic Aircraft Maneuverability," AGARD CP-386, Nov. 1985.
1044
AIAA JOURNAL
VOL. 27, NO. 8
Investigation of the Flow Structure Around a Rapidly Pitching Airfoil Miguel R. Visbal* and J. S. Shangt Air Force Wright Aeronautical Laboratories, Wright-Patterson Air Force Base, Ohio
A numerical study is presented for unsteady laminar flow past a NACA 0015 airfoil that is pitched, at a nominally constant rate, from zero incidence to a very high angle of attack. The flowfield simulation is obtained by solving the full two-dimensional compressible Navier-Stokes equations on a moving grid employing an implicit approximate-factorization algorithm. An evaluation of the accuracy of the computed solutions is presented, and the numerical results are shown to be of sufficient quality to merit physical interpretation. The highly unsteady flowfield structure is described and is found to be in qualitative agreement with available experimental observations. A discussion is provided for the effects of pitch rate and pitch axis location on the induced vortical structures and on the airfoil aerodynamic forces.
c CL> CD CP M^ n Rec u,v £/„ x,yt t X,Y XQ a. aeff £,TJ,T v ft a) OJF co+, UF
Nomenclature = airfoil chord =u ft and drag coefficients = pressure coefficient, 2(p-p00)/p0 = freestream Mach number, = direction normal to airfoil surface = chord Reynolds number, p^U^c/p^ = Cartesian velocity components in inertial frame of reference = freestream velocity = Cartesian coordinates in inertial frame of reference and time = coordinate system attached to airfoil (Fig. 1) = pitch axis location - geometric angle of attack = effective angle of attack at airfoil leading edge = transformed coordinates = kinematic viscosity = nondimensional pitch rate, tic/U^ =vorticity, dv/dx—du/dy = net vorticity flux at airfoil surface, - ^ v a j - n ds = positive (counterclockwise) and negative (clockwise) vorticity fluxes at airfoil surface
I. Introduction HE understanding and potential utilization of unsteady separated flows constitute a challenging area of fluid mechanics. Within this broad flow category, one encounters the phenomenon of dynamic stall, a term loosely used to describe the complex physical events induced by the largeamplitude motion of aerodynamic bodies or lifting surfaces. Dynamic stall is of importance in various aerodynamic applications including aircraft maneuverability, helicopter rotors, and wind turbines. As the extensive reviews of McCroskey1 and Carr2 indicate, the majority of the research on dynamic stall has been devoted to the case of airfoils performing harmonic motions of moderate amplitude in a uniform incoming stream. For the cases when the airfoil reaches very high angles of attack, the generated flowfields are characterized by massive, unsteady separation and by large-scale vor-
T
Received June 23, 1987; revision received Sept. 21, 1988. This paper is declared a work of the U. S. Government and is not subject to copyright protection in the United States. * Aerospace Engineer. Member AIAA. t Technical Manager. Associate Fellow AIAA.
tical structures. Progress in this problem area is also complicated by the need to account for many interrelated flow parameters. In addition to the usual flowfield dependence on Mach number, Reynolds number, and airfoil shape, the effects of the form, rate, and amplitude of the forcing motion must be considered. Due to the complexity of these highly unsteady separated flows, the need for systematic computational and experimental studies is apparent. This current need constitutes the motivation for the present numerical investigation. This paper presents a computational study of the unsteady laminar flow past an airfoil that is pitched at a constant rate to a very high angle of attack. The simple constant pitch rate motion represents the first logical step in a building-block approach, before more complex types of motion are considered. The constant pitch-up case should also permit the study of relevant dynamic stall phenomena, without introducing further complications associated with motion history effects. In addition, the large-amplitude constant pitch-rate case is of potential importance in future aircraft maneuverability.3 Current interest in the present problem area is evidenced by the recent experimental investigations of Refs. 4-9 and the preliminary computational (viscous) studies of Visbal10 and Wu et al.11 The present work constitutes a more extensive and systematic study than those of Refs. 10 and 11. Although the simulation of high Reynolds number (turbulent) flows is ultimately desired, the present computational results are limited to the case of low Reynolds number laminar flow. This constraint is imposed since a suitable model for transition and turbulence is not currently available for such a complex unsteady flow as the one under investigation. Nonetheless, the present laminar results are of value since they complement ongoing experimental efforts and provide clarification of important dynamic stall features and trends. This is particularly true in the high pitch-rate regime for which the energetic forcing motion is expected to temporarily dominate over some transition and turbulence effects. The favorable agreement found between predicted and experimental primary flow features confirms the previous hypothesis. Finally, twodimensional results are of relevance since experimental flow visualizations9 for a straight wing reveal a nearly twodimensional flow structure (away from the wing tip) during the pitch-up motion. The specific flow configuration considered is shown in Fig. 1. A NACA 0015 airfoil is pitched about a fixed axis at a constant rate from zero incidence to a maximum angle of attack of approximately 60 deg. The particular airfoil section selected has been used in the majority of pitch-up experimental stu-
AUGUST 1989
1045
FLOW STRUCTURE AROUND A RAPIDLY PITCHING AIRFOIL Table 1 Summary of pitching airfoil computations (NACA 0015 airfoil, Mx = 0.2, Rec = 104)a
0-CRID MOVES WITH AIRFOIL
PERIODIC CONDITIONS
Case
1
2 3 4 5 6
7 8
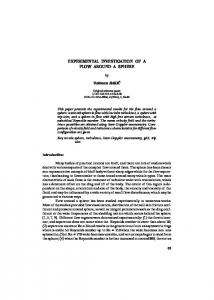
Fig. 1 Pitching airfoil configuration.
dies.5"9 For the case of pure rotation, the similarity parameter associated with the airfoil motion is the nondimensional pitch rate Q + =Qc/£/00. This parameter arises in the nondimensionalization of the velocity boundary conditions on the airfoil surface, and it is simply the inverse of the Rossby number. Numerical results are obtained by solving the full compressible Navier-Stokes equations on a moving grid using an implicit approximate-factorization algorithm.12 The main objectives of this study are summarized as follows: 1) description of the basic flowfield structure for the rapidly pitched airfoil, 2) parametric investigation of the effects of pitch-rate and pivotaxis location on the flow structure and aerodynamic loads, and 3) qualitative comparison of computed and experimental primary flow features.
II.
Governing Equations and Boundary Conditions
For the case of external flow past a body in arbitrary motion, the governing equations can be formulated in an inertial frame or reference, and motion of the body can be provided for by means of a general time-dependent coordinate transformation. Introducing such a transformation [% = £(x,y,t), vi = ri(x,y,t), r=t], the full two-dimensional compressible Navier-Stokes equations may be expressed in the following strong-conservation form13: 1
+ F 2 )+
(1)
!
where q = J~ [p,pu,pv,pe] is the vector of dependent variables. The form of the flux vectors appearing in Eq. (1) can be found in Ref. 13. Closure of this system of equations is provided by the perfect-gas law, Sutherland's viscosity formula, and the assumption of a constant Prandtl number. In reference to the pitching airfoil configuration shown inFig. 1, the boundary conditions are prescribed as follows. Along the inflow portion of the far-field boundary, freestream conditions are given. First-order extrapolation (d[ ]/dx=0) is used for all flow variables on the outflow boundary. Along the O-grid cut, spatial periodicity is imposed in £ by means of a five-station grid overlap. On the airfoil surface, the following isothermal, no slip condition is applied:
u=uB, rw =
(2)
where UB and aB denote, respectively, the velocity and acceleration on the airfoil surface that are known from the prescribed airfoil motion. For the nominally constant pitch-up motion considered in this paper, the following temporal variation, which avoids an infinite angular acceleration, is prescribed for Q: (3)
where t0 denotes the time taken by the airfoil to reach 99% of its final pitch rate 00. The influence of tQ on the computed flowfield had been previusly investigated10 and found to be limited to the early stages of the airfoil motion.
9 10 11 12
XQ/c
0.1 0.1 0.2 0.2 0.2 0.4 0.4 0.4 0.4 0.6 0.6 0.6
().5 ().5 ().5 ().5 ().5 .0 .0 .0 .0 .0 .0 .0
0.25 0.75 0.0 0.25 0.75 0.0 0.25 0.5 0.75 0.0 0.25 0.75
a Q0 = nondimensional P^ch rate, fi0 c/^o>; ^o = non^mensi°na^ acceleration time, /oC/oo/c [Eq. (3)]; X 0 /c = pivot axis location measured from airfoil leading edge.
Finally, the formulation of the problem is completed by imposing as an initial condition the computed flow at 0 deg angle of attack.
III.
Numerical Procedure
The time-dependent coordinate transformation (i.e., moving grid) required in the present flow simulation is implemented using a "rigid" grid attached to the airfoil.13 This approach is employed since it eliminates the need for multiplegrid generation. Once an initial grid is constructed, the physical coordinates (x,y) and grid speeds (XT, yT) can be easily computed from the prescribed airfoil motion. Nearly orthogonal boundary-fitted 0-grids are generated about the airfoil employing the elliptic technique of Ref. 14. Three different grid sizes are considered (113 x 51, 203 x 101, and 304 x 123). The medium grid, selected for the majority of the calculations, extends approximately 30 chords away from the airfoil and has minimum spacings of 0.00075c and 0.00005c in the £ and rj directions, respectively. The governing equations are numerically solved employing the implicit approximate-factorization algorithm of Beam and Warming.12 This scheme is formulated using three-point backward time differencing and second-order centered approximations for all spatial derivatives. In order to control numerical stability, both explicit and implicit smoothing terms are added to the basic algorithm. A fully vectorized Navier-Stokes solver that employs the above scheme has been developed and successfully validated for a variety of both steady and unsteady flow problems.10'15'16
IV.
Results and Discussion
Calculations were performed for the flowfield configuration depicted in Fig. 1. A NACA 0015 airfoil was pitched about a fixed axis from zero incidence to a maximum angle of attack of approximately 60 deg with an angular velocity of the form given by Eq. (3). The freestream Mach number and chord Reynolds number were 0.2 and 104, respectively. A summary of all cases computed is provided in Table 1. The discussion of the present results is divided into the following major areas: 1) evaluation of the accuracy of the computed results, 2) description of the basic flowfield structure, and 3) parametric effects of pitch rate and pivot-axis location. Evaluation of the Accuracy of the Computed Solutions
Before proceeding to make any observations pertaining to the physical aspects of the flow, estimates of the accuracy of the computed solutions must be provided. In the present calculations, numerical uncertainties were mainly associated with time discretization (i.e., time step value), spatial resolution,
1046
AIAA JOURNAL
M. R. VISBAL AND J. S. SHANG
and numerical damping terms. Other sources of error (e.g., far-field boundary location and implementation of implicit boundary conditions) were previously investigated10 for an unsteady separated flow and found to be of less significance. The effect of the time step value on the computed pitching airfoil flow was documented in Ref. 10 for the case of 0 J = 0.2 (case 4, Table 1). It was concluded in that study that a numerical solution effectively independent of time step was achieved
0.0
10.0
20.0
30.0
40.0
50.0
60.0
ANGLE OF ATTACK
Fig. 2 Effect of spatial resolution on computed lift and drag coefficients (case 11).
0.23
a = 44° 304 X 123
a = 44° 203 X 101
a = 44° 113 X 51 -0.23
if AtU^/c^0.001. Therefore, this time step value was specified in all the present calculations. The sensitivity of the computed flowfield to spatial resolution was evaluated for the case when QJ = 0.6 (case 11, Table 1). Calculations were performed using the three different grid systems, previously discussed in Sec. III. Although further grid refinements are desirable, the finest (304x123) grid employed was the largest one possible given the available computer resources (Cray XMP/12). The effect of the grid size on the predicted lift and drag coefficients is shown in Fig. 2. The maximum difference in CL between the fine and the medium grid was approximately 3.5%, and it was less then 1% for ce
Fig. 5 Computed airfoil surface pressure distributions (case 4). Basic Flowfield Structure
This section presents a description of the most important unsteady features of the flow past a pitching airfoil. This is done in order to set the stage for the subsequent discussion of parametric effects. The flowfield evolution for the case when 12o = 0.2 (case 4, Table 1) is provided by means of isovorticity contours (Fig. 4) and surface pressure distributions (Fig. 5). From these figures as well as from a computer-generated color movie, the following sequence of flow events is observed. At zero incidence, the flow is symmetric and displays a small trailing-edge separation region. As the pitching motion begins, the flow becomes fully attached along the airfoil lower surface, while on the upper surface the separation point moves upstream (Fig. 4a). The near-wake experiences significant curvature and after a short time reorganizes itself into a series of discrete vortices (Fig. 4a). Counterclockwise (positive) vortices are shed from the lower-surface boundary layer into the wake, in accordance with the corresponding increase in the airfoil clockwise circulation and lift. With the continuous increase in airfoil incidence, the upper-surface separation region eventually reaches the leading-edge area. Subsequently, the separated shear layer reattaches, dividing the upper-surface flow into two distinguishable vortical structures denoted as the leading-edge or dynamic stall vortex and the shear layer vortex (Fig. 4b). The latter is in itself composed of two substructures that rotate about each other and later amalgamate to form a single vortex (Fig. 4c). The leading-edge vortex grows in size, and its center is displaced downstream (Figs. 4b-4d), as also evidenced by the pressure distribution (Fig. 5). The leadingedge vortex detaches when its center is approximately at the midchord location. By this time, a well-defined and rapidly
growing counterclockwise vortex is observed to remain attached to the trailing edge (Fig. 4e). The shear layer vortex, which had begun to be convected downstream (Fig. 4d), is brought back and impinges on the airfoil surface due to the combined influence of the leading and trailing-edge vortices (Fig. 4e). In a very complex interaction, which involves dramatic rotational effects, the leading-edge vortex and the shear layer vortex combine to form a larger vortical structure (Fig. 4f). This structure is then convected along a path nearly normal to the airfoil chord due to the blockage effect of the trailing-edge vortex. The basic flow structure previously described is in qualitative agreement with experimental flow visualizations6 obtained for Rec = 4.5x 10.4 In order to permit a more direct comparison with the experiments, the case when 12 J = 0.2 and X0/c = 0.25 (case 4, Table 1) was recomputed using a chord Reynolds number of 45,000, while still retaining the assumption of laminar flow. A comparison of the computed and experimental7 lift coefficient histories is shown in Fig. 6. The agreement is reasonable, despite the assumption of laminar flow employed in the calculation. In particular, the maximum lift value and the angle of attack at which it occurs are in close agreement. A comparison of the computed streaklines with the experimental6 smoke visualizations are primarily characterized by a well-defined recirculation region on the airfoil leeward side, which corresponds to the dynamic stall vortex. Figure 7 also indicates reasonable agreement between the computation and the experiment regarding the size and location of the dynamic stall vortex. Effects of Pitch Rate and Pitch-Axis Location
The dependence of the flowfield structure on the pitch rate and the pivot location was investigated. As Table 1 indicates, the nondimensional pitch rate was varied over the range 0.1-0.6 and four different axis locations were considered (X0/c = Q, 0.25, 0.5, and 0.75). The influence of pitch rate and axis location on the flow is discussed in terms of how these parameters affect the observed vortical structure and the airfoil aerodynamic loads. Effect of fl o and ^o/c on the Vortical Structure
Figures 8 and 9 show the vorticity field at three angles of attack for four different cases. Based on these figures and similar ones,17 the following major observations can be drawn pertaining to the qualitative aspects of the vortical structure: 1) Over the range of OJ anc* X§/c considered, the flow was qualitatively characterized by the same primary features, which included: upstream propagation of the trailing-edge separation region on the airfoil upper surface and formation
AIAA JOURNAL
M. R. YISBAL AND J. S. SHANG
1048
a) Experimental smoke visualization
'"
a = 40°
b) Computed streaklines
Fig. 7 Comparison of computed and experimental flow visualizations (120 = 0.2, A0/c = 0.25, ec = 45,000).
a = 30°
a = 40°
= 40°
a = 50C
b) 12^=0.2, ^T0/c = 0.75 Fig. 8 Evolution of vorticity field for cases 4 and 5.
of a leading-edge vortex and a shear layer vortex, as well as their complex interaction. However, the quantitative characterization of these basic features (e.g., timing, vortex strength, etc.) showed a strong dependence on both the pitch rate and the axis location. 2) For a fixed-pitch axis location downstream of the leading edge, increasing the pitch rate resulted in the formation of the leading-edge vortex at a higher angle of attack (Figs. 8 and 9), in accordance with experimental observations.6 3) For a fixed value of 12 J, displacing the pitch axis downstream delayed the leading-edge vortex formation (Figs. 8 and 9). This behavior was found to be related to an "effective" angle of attack (a eff ), which can be defined by subtracting from £/oo the pitch motion induced airfoil velocity at the leading edge UB^E =Qx(r L > E _-r 0 ). The correlation of the leadingedge vortex formation with aeff is shown in Fig. 10 for cases 6 and 9 (Table 1). At the same effective incidence (aeff = 30 deg),
the dynamic stall vortex is observed to be in both cases at the same stage of development, despite the large difference in geometric angle of attack. Since the magnitude of UB^ is QJ | XQ/C , displacing the pitch axis downstream results in a redution of ceeff (for a fixed QJ an