2. Artificial Neural Networks on Transputers. The implementation of the Kohonen network on the transputers depends on the. mathematical formulation of the ...
publ. in: Proc. Transputer Anwender Treffen/ World Transputer Congress TAT/WTC 93 Aachen, Springer 1993
Knowledge Extraction from Artificial Neural Networks and Applications A. Ultsch, G. Guimaraes, D. Korus, H. Li Philipps University of Marburg Dep. of Mathematics/Informatics
Abstract Knowledge acquisition is a frequent bottleneck in artificial intelligence applications. Neural learning may offer a new perspective in this field. Using Self-Organising Neural Networks, as the Kohonen model, the inherent structures in high-dimensional input spaces are projected on a low dimensional space. The exploration of structures resp. classes is then possible applying the U-Matrix method for the visualisation of data. Since Neural Networks are not able to explain the obtained results, a machine learning algorithm sig* was developed to extract symbolic knowledge in form of rules out of subsymbolic data. Combining both approaches in hybrid system results in a powerful method to solve classification and diagnosis problems. Several applications have been used to test this method. Applications on processes with dynamic characteristics, such as chemical processes and avalanche forecasting show that an extension of this method from static to dynamic data is feasible. Keywords: parallel, transputer, neural network, expert system, Kohonen, visualisation, U-matrix, blood analysis, avalanche, chemical process
1. Introduction Knowledge acquisition is often a bottleneck in artificial intelligence applications. Many expert systems use knowledge in symbolic form (e.g. rules, frames, etc. ). For human experts it is, however, difficult to formulate their knowledge in these formalisms. Different approaches to the problem of knowledge acquisition have been proposed, for instance interviews with experts by knowledge engineers etc. These approaches concentrate often on how to
publ. in: Proc. Transputer Anwender Treffen/ World Transputer Congress TAT/WTC 93 Aachen, Springer 1993
interact with the experts in order to get a formulation of their knowledge in symbolic form. Here we follow a different approach: experts have gained their expertise by experiences, i.e. by dealing with cases. Nowadays it is common in all sorts of industrial or scientific application fields to store a record of these cases in an electronic form, typically in some sort of data base. In order to get the experts' knowledge into an expert system we propose to process these data bases in the attempt to learn the particularities of the domain. Whatever is learned by this process can be discussed with the expert, who is now in the role of a supervisor and consultant that corrects and completes knowledge instead of a (often) unwilling teacher who has to express himself in some form he is not common and not comfortable with. Experts are required to describe their knowledge in form of symbolic rules, i.e. in an usually unfamiliar form. In particularly to describe knowledge acquired by experience is very difficult. Therefore KBS may not be able to diagnose cases that experts are able to. Some machine learning algorithms, for example ID3 [Quin85], have the capability to learn from examples. We propose to use Artficial Neural Networks (ANN) as a first step of a machine learning algorithm. ANN claim to have advantages over these systems, being able to generalise and to handle inconsistent and noisy data. Interesting features of natural neural networks are their ability to build receptive fields in order to project the topology of the input space. This is realised by a Kohonen model [Koho89], called Self-organising Feature Map (SOFM). A high-dimensional input space is projected on a low dimensionality, usually a plane, conserving the topology of the input space. This is one of the advantages of unsupervised Neural Networks, like the Kohonen's Feature Map: the internal structure of the ANN reflects structural features in the data without having any a-priori knowledge about their structure. However a good representation on this map has to be found in order to find the inherent structures of data, now represented on the map. The main idea therefore is to integrate both approaches, so that the advantages of ANN to generalise and to handle inconsistent and noisy data as well as to find the inherent structures in the data are combined with the ability of KBS to give explanations about the problem solving process using the rules of the knowledge base. To realise the integration, an algorithm has to be constructed, that converts symbolic knowledge for the KBS out of the subsymbolic data of
publ. in: Proc. Transputer Anwender Treffen/ World Transputer Congress TAT/WTC 93 Aachen, Springer 1993
the ANN. In this work, we show how such an knowledge extraction was developed and tested on several data sets. Due to their inherent parallelism ANN are well suited to be mapped on massively parallel computer architectures like transputer clusters. In the BMFT project WINA [Ults91a] we have implemented a self-organising neural network on such a cluster of 18 resp. 32 T805 transputers. It offers the desired speed and allows to train sufficiently large feature maps. After learning of SOFM an inductive machine learning algorithm called SIG*[Ults91] takes the training data with the classification detected through SOFM as input, generates rules for characterising and differentiating the classes of the data.
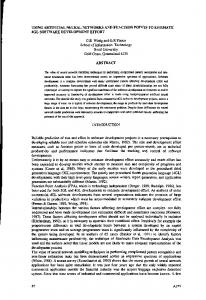
2. Artificial Neural Networks on Transputers The implementation of the Kohonen network on the transputers depends on the mathematical formulation of the Kohonen algorithm which is much simpler than the biological formulation. for each learning step do: 1. broadcast learning vector to all neurons 2. for each neuron do: calculate distance between learning vector and weight vector 3. determine the best match by calculating the minimum of these distances 4. broadcast the position of the best match to all neurons 5. for each neuron do: adapt the weights depending on the neighbourhood function 6. minimise neighbourhood and learning rate
fig. 1 algorithm of Kohonen Typical applications deal with a grid of 64x64 to 256x256 neurons - each neuron representing an n-dimensional vector in the feature space. So, the kind of parallelism we have chosen, is the parallelism of neurons. The grid of neurons is
publ. in: Proc. Transputer Anwender Treffen/ World Transputer Congress TAT/WTC 93 Aachen, Springer 1993
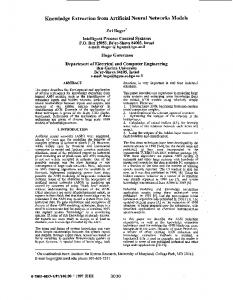
distributed on the transputers in a special way. They calculate their difference to the learning vector resp. adapt their weights in parallel. In the idealised case the learning vector resp. the position of the best match would be broadcasted to all processes (e.g. neurons) on all processors at the same time. Due to the hardware architecture of the underlying transputer cluster this is not possible. One transputer, the so called „root transputer“ is connected via one transputer link to the host, in our case a SUN Sparcstation 2, the other transputers can be connected to others via their four links. There exist no bus or other possibilities of memory access. Hence, the learning vector resp. the position of the best match has to be propagated through the transputer network. A tree structure of the network would give the shortest communication lengths, but a ring structure is easier to implement (see fig. 2).
TP
2
TP 1
root TP
SUN
0
TP k
*)
*) k nicht notwendig gerade
fig. 2 ring structure of the transputer network We don‘t have any operating system on the transputer cluster, so that routing has to be implemented by the programmer. In our re-implementation of an earlier version at the University of Dortmund [UlSi89, GuKo92], we used the
publ. in: Proc. Transputer Anwender Treffen/ World Transputer Congress TAT/WTC 93 Aachen, Springer 1993
in Occam
TP
i-1
TPi
communication process (in C)
in Occam
TP
i+1
in Occam work process (in C)
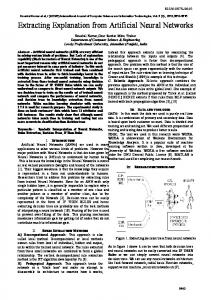
fig. 3 work transputer inmos toolset for occam-2 and ANSI-C to get advantage of both programming languages. Communication is done in occam-2 because it‘s easier and safer. The main programs are written in C to make use of the dynamic data structures of this language. The other transputers are called „work transputers“, because each of these transputers holds two processes, one communication process where the propagation of information will be done and one work process where the neurons calculate their distances or adapt their weights (see fig. 3). On the root transputers are some more processes (see fig. 4): two communication processes, a main process, a message process and an output
publ. in: Proc. Transputer Anwender Treffen/ World Transputer Congress TAT/WTC 93 Aachen, Springer 1993
HOST (Unix) stderr
stdin
stdout
in C communication process (in C)
TP
0
in Occam message process (in C)
main process (in C)
output process (in C)
in Occam
TP
k
in Occam
communication process (in C)
in Occam
TP
fig. 4 root transputer process. The main process controls the representation of the learning vector. The message process sends general information to the host about the state of the network (including errors). The output process sends detailed information to the host about the learning phase of the neural net like an error sum or the position of the best matches. These data will then be graphically visualised on the host. The neurons are distributed on the transputer ring in an interleaved manner to get a better working balance through the learning phase at a time where the
1
publ. in: Proc. Transputer Anwender Treffen/ World Transputer Congress TAT/WTC 93 Aachen, Springer 1993
neighbourhood doesn‘t include the whole neural network anymore [UlSi89]. Distributing the first [m/k] rows on the first transputer and so on, where by k is the total number of transputers and mxm is the size of the grid, it can occur that at a later time of the learning phase only the transputer with the best match adapts its weights. To avoid this the neurons are distributed in the following way (fig. 5). Here, the j-th row of the grid is assigned to transputer p=((j–1) mod k) + 1, j=1..m, p=1..k, k=#transputers. E.g. row (k+1) is assigned to transputer 1. Only at the very end, where only the best match itself belongs to its neighbourhood, exactly one transputer adapts its weights. Neuronen 1. Zeile 2. Zeile 3. Zeile 4. Zeile
Transputer ...
1
...
2
...
3
...
4
... ... ...
(k–1)-te Zeile k-te Zeile (k+1)-te Zeile
... ... ... ... ...
k-1 1 2
fig. 5 interleave distribution of the neurons on the transputer and best match Looking at the learned Kohonen map as it is one is not able to see structures in data, especially when processing a large set of data with high dimensionality. Hence, we have developed the so called „unified distance matrix methods“ (short U-matrix methods, UMM) to graphically visualise the structure of the Kohonen network [Ults91] in a three dimensional landscape. The simplest Umatrix method is to calculate for each neuron the mean of the distances to its (at most) 8 neighbours and add this value as the height of each neuron in a third dimension [Ults92] (fig. 6). Other methods e.g. also consider the position of the best matches.
publ. in: Proc. Transputer Anwender Treffen/ World Transputer Congress TAT/WTC 93 Aachen, Springer 1993
distances
U-Matrix
neurons fig. 6 a particular U-Matrix method Using an U-matrix method we get, with the help of interpolation and other visualisation technics, a three-dimensional landscape with walls and valleys. Neurons which belong to the same valley are quite similar and may belong to the same class. Walls separate different classes. Unlike in other classification algorithms the number of expected classes must not be known a priori. Also, subclasses of larger classes can be detected. Single neurons in deep valleys indicate outliers.
3. Knowledge Extraction from Neural Networks Sig* has been developed in the context of medical applications [Ults91]. In this domain other rule-generating algorithms such as ID3 [Quin85], for example, fail to produce suiting rules. That´s because they try to use a minimal criterion to optimize the decision tree, which is certainly not the central point of medical diagnosis. Sig* takes a data set in the space R n that has been classified by SOFM/UMM as input and produces descriptions of the classes in the form of decision rules. For each class an essential rule, called characterising rule, is generated, which describes that class. Additional rules that distinguish between different classes are also generated. These are called differentiating rules. This models a differential-diagnosing approach used by medical experts, but is a very
publ. in: Proc. Transputer Anwender Treffen/ World Transputer Congress TAT/WTC 93 Aachen, Springer 1993
common approach in other domains as well. The rules generated by sig*, in particular, take the significance of the different structural properties of the classes into account. If only a few properties account for most of the cases of a class, the rules are kept very simple. Two central problems are addressed by the sig* algorithm: 1. how to decide which attributes of the data are significant so as to characterise each class, 2. how to formalise apt conditions for each selected significant attribute. In order to solve the first problem, each attribute of a class is associated with a "significance value". The significance value can be obtained, for example, by means of statistical measures. For the second problem we can make use of the distribution properties of the attributes of a class. In the following we use an example to describe the sig* algorithm. The detailed description can be found in [UlLi93]. 3.1. Selecting Significant Attributes for a Class As an example, we assume a data set of case-vectors with five attributes Attr 1, Attr 2, Attr 3, Attr 4 , Attr 5 . Let SOFM/UMM distinguish in the example four classes Cl 1 , Cl2 , Cl3 , Cl4 . Let SV ij denote the significance value of Attri in class Cj. The matrix SM=(SVij )5x4 we call "significance matrix". For our example the significance matrix may be given as follows: SM
Cl1
Cl2
Cl3
Cl4
Attr 1
1.5
4
6*
3.1
Attr 2
3.1
3.2
20*
6.4
Attr 3
5
7.4
1.8
9.5*
Attr 4
6
8.3*
5.7
2.7
Attr 5
8
9.5*
6.2
7.3
In this matrix the largest value in each row is marked with an asterisk (*).
publ. in: Proc. Transputer Anwender Treffen/ World Transputer Congress TAT/WTC 93 Aachen, Springer 1993
In order to detect the attributes that are most characteristic for the description of a class, the significance values of the attributes are normalised in percentage of the total sum of significance values of a class. Then these normalised values are ordered in decreasing order. For Cl 1 and Cl3 , for example, these ordered attributes are: percentual significance
Cl1
Cumulative
percentual significance
Cl3
Cumulative
Attr 5
33.89%
33.89%
Attr 2 *
50.38%
50.38%
Attr 4
25.42%
59.31%
Attr 5
15.62%
66.00%
Attr 3
21.19%
80.50%
Attr 1 *
15.11%
81.11%
Attr 2
13.14%
93.64%
Attr 4
14.36%
95.47%
Attr 1
6.36%
100.00%
Attr 3
4.53%
100.00%
As significant attributes for the description of a class, the attributes with the largest significance value in the ordered sequence are taken until the cumulative percentage equals or exceeds a given threshold value. For a threshold value of 50% in the above example Attr 5 and Attr4 would be selected for Class Cl 1. For Cl3 only Attr2 would be considered. For this class there are attributes, however, that have been marked with an asterisk (see above): Attr 2 and Attr 1. If there are any marked attributes, that are not considered so far, as in our example Attr 1, they are also considered for a sensible description of the given class. So the descriptive attributes for our examples would be: for Cl1: Attr 5, Attr 4 and for Cl3: Attr 2 and Attr1. The same algorithm is performed for all classes and all attributes and gives for each class the set of significant attributes to be used in a meaningful but not over detailed description of the class. If an attribute is exceedingly more significant than all others, (consider for example Attr 2 for Cl3) only very few attributes are selected. On the other hand, if almost all attributes possess the same significance considerably more attributes are taken into account. The addition of all marked attributes assures, that those attributes are considered for which the given class is the most significant. 3.2. Constructing Conditions for the Significant Attributes of a Class
publ. in: Proc. Transputer Anwender Treffen/ World Transputer Congress TAT/WTC 93 Aachen, Springer 1993
A class is described by a number of conditions about the attributes selected by the algorithm described above. If these conditions are too strong, many cases may not be correctly diagnosed. If the conditions are too soft, cases that do not belong to a certain class are erroneously subsumed under that class. The main problem is to estimate correctly the distributions of the attributes of a class. If no assumption on the distribution is made, the minimum and maximum of all those vectors that belong, according to SOFM/UMM, to a certain class may be taken as the limits of the attribute value. In this case a condition of the i-th attribute in the j-th class can look like attributeij
IN
[min ij , maxij ].
But this kind of formulation of conditions likely results in an erroneous subsumption. If a normal distribution is assumed for a certain attribute, we know from statistics, that 95% of the attribute values are captured in the limits [meanij 2*dev , meanij +2 *dev ] , where dev is the value of the standard deviation of the attribute. For other assumptions about the distribution, two parameters low and hi may be given in SIG*. For this case the conditions generated are as follows: attributeij
IN
[ meanij + low * dev, meanij + hi * dev ].
3.3. Characterising Rules and Differentiating Rules The algorithm described in 3.1. and 3.2. produces the essential description of a class. If the intersection of such descriptions of two classes A and B is nonempty, i.e. a case may belong to both classes, a finer description of the borderline between the two overlapping classes is necessary. To the characterising rule of each class a condition is added that is tested by a differentiating rule. A rule that differentiates between the classes A and B is generated by an analog algorithm as for the characterising rules. As significance values however, they may be measured between the particular classes A and B. The conditions are typically set stronger in the case of characterising rules. To compensate this the conditions of the differentiating rules are connected by a logical OR.
publ. in: Proc. Transputer Anwender Treffen/ World Transputer Congress TAT/WTC 93 Aachen, Springer 1993
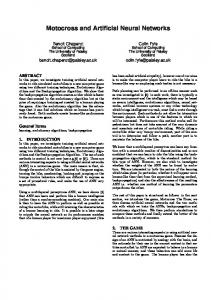
4. Applications Our first applications lay in the medical domain. As test base a data set was selected where a priori classifications were known, so that we could test our neural classifier on its classification correctness. The acidosis application is a data set with 11 attributes stemming from a blood analysis of patients. These data were taken out of the book of [DeTr85], which used several classification methods to explain these data. As shown in fig. 7, the U-matrix method was able to structure the data. All acidosis subcategories were separated by a "wall" enabling a classification of the acidosis data into classes.
healthy lactacidosis metabolical acidosis respiratory acidosis cerebral deficiency
fig. 7 U-matrix of acidosis data After having classified the acidosis data, sig* was used to generate the rules. The advantage of this method over other machine learning methods, as for example the machine learning algorithm ID3, is that it considers the significance of all significant attributes for a specific diagnosis, while the ID3 algorithm almost considers only one attribute for the rule generation. This does not correspond to the proceeding of a medical expert. Our rules were described by 4 or 5 attributes resembling more closely the decisions made by medical experts. In order to test the rule generation algorithm sig*, another data set in the medical domain was chosen. We used a data set with patients having a blood desease, anaemie. Here no classifications were known a-priori. In medical
publ. in: Proc. Transputer Anwender Treffen/ World Transputer Congress TAT/WTC 93 Aachen, Springer 1993
literature [MüSe89] values/ ranges for all attributes can be found. Deviations of a blood value were indicators for a diagnosis of an anaemie desease. Rules were extracted with sig* out of the classifications generated by the U-matrix method. These rules showed the same results as the rules in the medical book. But additional rules were also found and could be verified by medical experts. For details see [Ults91]. The advantage of our system lies in the detection of structures in data without a previous classification. Here we got some results on environmental [UlHa91] and industrial applications. In the later case we used the SOFM for monitoring and knowledge acquisition in chemical processes [Waya92] [Ults93]. Industrial processes are often hard to control because the process is difficult to observe or due to its non-linear dynamics. With the help of the learned SOFM combined with an UMM it is possible to distinguish different regions (classes) on the map which correspond to different good or bad process states. The actual process state appears as one mark on the map and the continuous flow of measured process states describes a path on the map, which gives the controller an insight wether the process stays in a normal region or changes to a critical region [Waya92]. In addition, with the help of the rule extraction mechanisms descriptions of the different classes can be derived to be used either to judge the quality of the SOFM or to integrate them into an expert system [Ults93]. Using Kohonen's Feature Map to monitor a chemical process, as seen before, suggests their suitability to represent dynamical processes and give short-term predictions. In a further application, a forecasting of avalanches specially during the winter was made using snow, weather and snow cover data as input data to evaluate directly the degree of danger (1-5). A hybrid expert system was realised [Schw93] with the following objectives: assessment of degree of avalanche danger using daily measurements, ability of using incomplete and inconsistent data, explanation of results, better overall performance over existing tools (also in critical situations). It integrated a learned Kohonen feature map and a rule base to forecast new input data. For some classes (1,4,5) direct rules with a good performance could be generated by the rule generation algorithm sig*. The other two classes 2 and 3 couldn't be distinguished one from each other only by using the sig* algorithm. Here U-Matrices were generated for both "difficult" subclasses. Structure rules were the result of this process by using sig* for rule extraction of the sub-subclasses. The hybrid system also integrated rules from other knowledge acquisition tools.
publ. in: Proc. Transputer Anwender Treffen/ World Transputer Congress TAT/WTC 93 Aachen, Springer 1993
The final prognosis of an avalanche was then achieved by a combination of both systems, the Rule Base and the Kohonen Network. Four cases could be distinguished: (a) no diagnosis was possible using the rule base, so the final diagnosis corresponded to the diagnosis of the Kohonen Feature Map, (b) both methods found the same diagnosis, (c) several diagnosis were detected by the expert system, so that the Kohonen Network diagnosis corresponding to one of the expert system diagnosis was used for the final diagnosis and (d) a conflict situation where different results were found by the subsystems. Also cases with unknown input values can be classified by the Kohonen Network, the unknown parameters can now be fulfilled and then diagnosed. In this sense the Network completes the classification task. Other methods were used to predict avalanche danger. The deterministic method models the physical processes of the snow cover. A statistical approach uses daily data over several years and is able to detect avalanches of the ten nearest neighbouring days. Both approaches were integrated into a deterministicstatistic model achieving 50% of correct diagnosis [FöHä78]. Other approaches, like expert systems get a performance of 60% and 70%. Our hybrid expert system will be at least better than 74% (the performance of the rule based system). Preliminary studies showed that the Kohonen Feature Map will achieve a correctness of 80%. Including cases that couldn't be evaluated by the rules and now can be detected by the Kohonen Feature Map, let us expect a performance of greater then 80%. This results have to be viewed under the consideration that the weather forecast has an overall performance of about 80 to 85%, so that a final prediction can only be realised by the avalanche experts.
5. Conclusion Real-world applications with a large amount of data can be processed by our knowledge based system integrated with an neural network component. In order to analyse the high dimensional data of large data sets with Neural Networks, we use parallel hardware like transputers. Kohonen self-organising feature maps together with the U-matrix methods are able to extract regularities out of data. Since Neural Networks have the disadvantage of not being able to explain the acquired knowledge, a rule generating algorithm sig* extracts rules out of the classified feature map. The acquired rules can be used as expert rules. With our
publ. in: Proc. Transputer Anwender Treffen/ World Transputer Congress TAT/WTC 93 Aachen, Springer 1993
system not only classifications are possible and symbolic rules are extracted, but also the factor time can be analysed. Further research concerns the animation of the network´s learning process via on line visualisation of the U-matrix. A real-time animation of the U-matrix by sending the weight vectors to the host during the learning phase is not yet possible because of the bottleneck of communication in the transputer system and between the transputer system and the host computer.
Acknowledgement This work has been supported in part by the german ministry of research and technology BMFT, research grant WINA, contract number 01-IN 103 B/O.
References [DeTr85]
Deichsel, G,; Trampisch, H.J.: Clusteranalyse und Diskriminanzanlyse. Stuttgart: G. Fischer Verlag, 1985. [FöHä78] Föhn, P.; Hächler, P.: Prevision des grosses avalanches au moyens d'un model deterministic-statistique. ANENA. in: Comples Rendues du 2e Rencontre Int. sur la Neige et des Avalanches, Grenoble, 12-14, 1978, pp.151-156. [GuKo92] Guimaraes, G. & Korus, D. „Neuronale Netze auf Transputern“ Transputer-Anwender-Treffen TAT´92, Abstraktband, Aachen Sep. 1992. [Koho89] Kohonen, Teuvo „Self-Organization and Associative Memory“ Springer Verlag 1989 (3rd ed.) [MüSe89] Müller, F.; Seifert, O.: Taschenbuch der medizinisch-klinischen Diagnostik, Berlin: Springer-Verlag, 72 Aufl., 1989. [Quin85] Quinlan, J.R.: Learning Efficient Classification Procedures and their Application to Chess End Games. in: Michalsky, R.; Carbonell, J.G; Mitchell, T.M.(Hrsg.): Machine Learning - An Artificial Intelligence Approach. Berlin 1984, pp. 463-482. [Schw93] Schweizer, M.; Föhn, P.; Schweizer, J.; Ultsch, A.: A hybrid Expert System for Avalanche Forecasting, in publ.
publ. in: Proc. Transputer Anwender Treffen/ World Transputer Congress TAT/WTC 93 Aachen, Springer 1993
[Ults91]
Ultsch, A. „Konnektionistische Modelle und ihre Integration mit wissensbasierten Systemen“ Habilitationsschrift Universität Dortmund, 1991. [Ults91a] Ultsch, A., Palm, G., Rückert, U.: Wissensverarbeitung in neuronaler Architektur, in: Brauer/Hernandez (Eds.): Verteilte künstliche Intelligenz und kooperatives Arbeiten, GI-Kongress, München, 1991, pp 508-518. [Ults92] Ultsch, A. „Self-Organising Neural Networks for Visualisation and Classification“ Proc. Conf. Soc. for Information and Classification, Dortmund Apr. 1992. [Ults93] Ultsch, A. "Self-Organising Neural Networks for Monitoring and Knowledge Acquisition of a Chemical Process" Proc. ICANN-93, Amsterdam, p. 864–867. [UlHa91] Ultsch, A. & Halmans, G. "Neuronale Netze zur Unterstützung der Umweltforschung" Symp. Computer Science for Environmental Protection, Informatik Fachberichte 296, Springer, Dec. 1991. [UlLi93] Ultsch, A.& Li, H. "Automatic Acquisition of Symbolic Knowledge from Subsymbolic Neural Networks" Proc. IEEE Int. Conf. on Signal Processing, Peking, 1993. [UlSi89] Ultsch, A. & Siemon, H.P. „Exploratory Data Analysis: Using Kohonen Networks on Transputers“ Fachberichte 329, FB Informatik, Universität Dortmund, Dec. 1989. [Waya92] Wayand, M. "Anwendung von Kohonen Netzen zur Darstellung und Steuerung von chemischen Prozeßverläufen" Diplomarbeit, Univ. Dortmund 1992.