Anil K. Jain and Arun Ross. Department of Computer Science and ... by using
certain physiological or behavioral traits associ- ated with the person. Biometrics
...
Appeared in Proc. International Conference on Image Processing (ICIP), Rochester, New York, September 22-25, 2002.
LEARNING USER-SPECIFIC PARAMETERS IN A MULTIBIOMETRIC SYSTEM Anil K. Jain and Arun Ross Department of Computer Science and Engineering Michigan State University East Lansing, MI 48824 ABSTRACT Biometric systems that use a single biometric trait have to contend with noisy data, restricted degrees of freedom, failureto-enroll problems, spoof attacks, and unacceptable error rates. Multibiometric systems that use multiple traits of an individual for authentication, alleviate some of these problems while improving verification performance. We demonstrate that the performance of multibiometric systems can be further improved by learning user-specific parameters. Two types of parameters are considered here. (i) Thresholds that are used to decide if a matching score indicates a genuine user or an impostor, and (ii) weights that are used to indicate the importance of matching scores output by each biometric trait. User-specific thresholds are computed using the cumulative histogram of impostor matching scores corresponding to each user. The user-specific weights associated with each biometric are estimated by searching for that set of weights which minimizes the total verification error. The tests were conducted on a database of 50 users who provided fingerprint, face and hand geometry data, with 10 of these users providing data over a period of two months. We observed that user-specific thresholds improved system performance by ∼ 2%, while user-specific weights improved performance by ∼ 3%. 1. INTRODUCTION Passwords (knowledge-based security) and ID cards (tokenbased security) are commonly used to restrict access to a variety of systems. However, security can be easily breached when a password is divulged to an unauthorized user or a card is stolen by an impostor. The emergence of biometrics has addressed the problems that plague traditional verification methods. Biometrics refers to the automatic identification (or verification) of an individual (or a claimed identity) by using certain physiological or behavioral traits associated with the person. Biometrics allows us to establish an identity based on ‘who you are’, rather than by ‘what you possess’ (e.g., an ID card) or ‘what you know’ (e.g., a password). Most of the installed biometric systems make use of fingerprints, hand geometry, iris, and face to establish a
person’s identity [1, 2]. In addition to enhanced security, biometric systems also introduce an aspect of user convenience. For example, they obviate the need to remember and maintain multiple passwords. Biometric systems using a single biometric trait for authentication purposes have some limitations. Noisy data, limited degrees of freedom, performance limitation, circumvention via spoofing, and non-universality (leading to failureto-enroll) all affect the performance, security and convenience of using such a system. Some of the limitations imposed by single biometric systems can be overcome by installing multiple sensors that capture different biometric traits. Such systems, known as multibiometric systems [3, 4, 5], are more reliable and provide higher verification rates due to the presence of multiple, independent pieces of evidence [6, 7]. Multibiometric systems (i) address the problem of non-universality, since multiple traits ensure sufficient population coverage, and (ii) provide anti-spoofing measures by making it difficult for an intruder to “steal” multiple biometric traits of a genuine user. Ross et al. [8] combine the matching scores of three traits (face, fingerprint and hand geometry) to enhance the performance of a biometric system. Three different techniques (sum rule, decision tree, linear discriminant analysis) are used to combine the matching scores. Experiments indicate that the sum rule with normalized scores results in the best performance. In this paper, we further improve system performance by learning user-specific matching thresholds and weights for individual biometric traits. Thresholds are used to decide if a matching score corresponds to a genuine user or an impostor. Scores greater than the matching threshold indicate a genuine user; scores lower than the threshold suggest an impostor. Biometric systems typically use a common threshold across users. We show that by setting user-specific thresholds, it is possible to improve system performance. Weighting is used to vary the importance of matching scores of each biometric trait. By learning userspecific weights, the performance of the system is shown to improve.
Appeared in Proc. International Conference on Image Processing (ICIP), Rochester, New York, September 22-25, 2002.
2. MULTIBIOMETRICS
3. LEARNING USER-SPECIFIC PARAMETERS The automatic learning and update of system parameters help reduce the error rates associated with an individual, thereby improving the performance accuracy of the system. In a multibiometric system, it is essential that different bio-
(a)
(b)
(c)
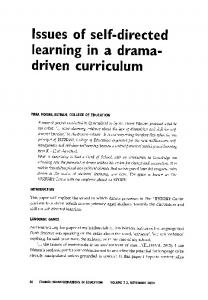
Fig. 1. Three biometric traits of a user. metric traits be assigned a degree of importance for different users. This is important especially when the biometric trait of some users cannot be reliably acquired. For example, users with persistently dry fingers may not be able to provide good quality fingerprints. Such users might experience higher false rejects when interacting with a fingerprint system. By reducing the weight of the fingerprint trait of such users, and increasing the weights associated with the other traits, the false reject error rate of these users can be reduced. Further, different users are prone to different types of errors. The false reject rate (FRR) of users with large intraclass variations may be high. Similarly, the false accept rate (FAR) associated with users having small inter-class variations may be high. We learn user-specific parameters by observing system performance over a period of time. This will appeal to that segment of the population averse to interacting with a system that constantly requests a user to provide multiple readings of the same biometric. The emphasis is on tuning the system parameters automatically, yet appropriately, to attain performance gain. Therefore, adaptation in a multibiometric system entails the following: (a) developing user-specific matching thresholds, and (b) assigning weights to individual biometric traits. 90 84
85 80
82
Genuine Accept Rate(%)
Genuine Accept Rate(%)
The term multibiometrics is used to refer to the consolidation of information presented by multiple evidences. These multiple evidences can stem from a single biometric trait or from multiple traits. Multibiometrics using a single trait reintroduces the problem of non-universality (i.e., failure to enroll) and circumvention (i.e., spoofing). For this reason, it is better to utilize multiple biometric traits for user verification. Suppose N biometric traits, B1 , B2 , . . . BN , are used to verify the claimed identity, I. Let Sk be the normalized matching score P provided by Bk . We define the fused score as Sf us = N k=1 Wk .Sk , where Wk is the weight associated with biometric trait Bk . If Sf us ≥ η, where η is the matching threshold, then the claimed identity is true (a genuine user); otherwise the claimed identity is false (an impostor). We adjust the system parameters (matching threshold, η, and weights, Wk s) for each user, so as to improve the performance of the system. Here, three different biometric traits have been considered - fingerprint (B1 ), face (B2 ) and hand geometry (B3 ). Data was collected from 50 users; 40 users provided 5 samples of each biometric over two sessions, and the remaining 10 users provided data over a period of two months, with each user typically providing around 30 samples. Approximately one-third of the samples provided by each user were used in the training phase, and the rest were used in the test phase. Fingerprint images were acquired using a Digital Biometrics sensor (500 dpi, 640 × 480) and an Identix sensor (500 dpi, 255 × 256). Minutiae features were used to represent and match fingerprints [9]. Images of a subject’s face were obtained using a Panasonic CCD (640 × 480) and a Sony video camera (256 × 384). The eigenface approach was used to extract features from the face image [10]. Face matching involved computing the Euclidean distance between the coefficients of the eigenface for the template and the eigenfaces for the detected input face. Images of a subject’s right hand were captured using a Pulnix TMC-7EX camera. Fourteen feature values comprising of the lengths of the fingers, widths of the fingers and widths of the palm at various locations of the hand, were used as feature values [11]. The Euclidean distance metric was used to compare feature vectors and generate a distance score. The scores provided by all traits were converted to similarity measures and normalized in the [0, 100] range. Figure 1 shows images of the three traits for one user in the database.
USER−SPECIFIC THRESHOLD
80 78 76 COMMON THRESHOLD
75
USER−SPECIFIC THRESHOLD
70 65 60 55
COMMON THRESHOLD
50
74 45 72 −1 10
0
10 False Accept Rate(%)
1
10
(a)
40 −1 10
0
10 False Accept Rate(%)
1
10
(b)
Fig. 2. ROC curves exhibiting performance improvement when user-specific thresholds are utilized to verify claimed identity. (a) Fingerprint; (b) Face.
3.1. User-specific thresholds The matching threshold for each user is computed using her cumulative histogram of impostor scores for each of the three biometric traits, as follows:
Appeared in Proc. International Conference on Image Processing (ICIP), Rochester, New York, September 22-25, 2002.
User # 1 2 3 4 5 6 7 8 9 10
Fingerprint 14 17 15 12 11 11 16 19 11 19
Face 91 91 92 94 91 90 95 92 90 94
Hand Geometry 94 95 95 95 90 92 94 97 96 93
User # 1 2 3 4 5 6 7 8 9 10
Table 1. User-specific thresholds for the biometric traits of 10 users corresponding to a FAR of 1% in each ROC curve. 1. For the ith user in the database, let ti (γ) correspond to the threshold in the cumulative histogram that retains γ fraction of scores, 0 ≤ γ ≤ 1. 2. Using {ti (γ)} as the matching threshold, compute {F ARi (γ), GARi (γ)}, where GAR is the genuine accept rate. 3. Compute the total FAR and GAR as, F AR(γ) = i F ARi (γ), GAR(γ) = i GARi (γ). 4. Use {F AR(γ), GAR(γ)} to generate the ROC curve.
When the multibiometric system is deployed, the γ corresponding to a specified FAR is used to invoke the set of userspecific thresholds, {ti (γ)}. Table 1 shows the user-specific thresholds (corresponding to a FAR of 1%) associated with the 10 users whose data was collected over a period of two months. The ROC curves indicating the improved performance is shown in Figure 2. 100
100
99
99 EQUAL WEIGHTS, USER−SPECIFIC THRESHOLD
97 96 95 94 93
EQUAL WEIGHTS, COMMON THRESHOLD
92
97 96 95 94 93
EQUAL WEIGHTS, COMMON THRESHOLD
Face
Hand Geometry
(W1 )
(W2 )
(W3 )
0.5 0.6 0.4 0.0 0.5 0.6 0.6 0.4 0.5 0.6
0.3 0.2 0.1 0.5 0.2 0.1 0.1 0.2 0.1 0.2
0.2 0.2 0.5 0.5 0.3 0.3 0.3 0.4 0.4 0.2
Table 2. Weights of different traits for 10 users.
the biometric trait used (W1 for finger, W2 for face and W3 for hand geometry), in order to reduce the importance of less reliable biometric traits (and increase the importance of more reliable traits). Weighting the matching scores can be done in the following ways. (a) Weighting all traits equally and using a user-specific matching threshold: Equal weights are assigned to the face, hand and fingerprintP matching scores, and a new score is 3 obtained as Sf us = k=1 31 Sk . The user specific threshold is computed using the impostor distribution of Sf us (for each user) using the procedure outlined in section 3.1. The performance improvement can be seen in Figure 3(a). (b) Estimating user-specific weights by ‘exhaustive’ search and using a common matching threshold: User-specific weights are estimated from the training data as follows: 1. For the ith user in the database, vary weights W1,i , W2,i and W3,i over the range [0, 1], with the constraint W1,i +W2,i +W3,i = 1. Compute Sf us = W1,i S1 +W2,i S2 +W3,i S3 . 2. Choose that set of weights that minimizes the total error rate associated with the scores. The total error rate is the sum of the false accept and false reject rates.
92
91 90 −1 10
USER−SPECIFIC WEIGHTS, COMMON THRESHOLD
98 Genuine Accept Rate(%)
Genuine Accept Rate(%)
98
Fingerprint
91 0
10 False Accept Rate(%)
(a)
1
10
90 −1 10
0
10 False Accept Rate(%)
1
10
(b)
Fig. 3. ROC curves when using (a) equal weights for all three traits, and a user-specific matching threshold, (b) userspecific weights for all three traits and a common matching threshold.
3.2. Weighting individual biometric traits Each biometric trait provides a matching score based on the input feature set and the template against which the input is compared with. These scores are weighted according to
Table 2 lists the weights computed for the 10 users listed in table 1. Since the weight estimation procedure utilizes the histograms of both the genuine and impostor scores, computing user-specific thresholds using impostor scores does not further improve performance. We, therefore, use a common matching threshold. The resulting performance is indicated by the ROC curve in Figure 3(b). From table 2, we observe that for user 4, W1 = 0. To understand this, we examined the fingerprints corresponding to this user (Figures 4(a) and 4(b)). We note that the ridge details are not very clear, and therefore the minutiae matching algorithm did not provide correct matching scores. This demonstrates the importance of assigning user-specific weights to the individual biometric trait. Similarly, user 3 has a very small
Appeared in Proc. International Conference on Image Processing (ICIP), Rochester, New York, September 22-25, 2002.
weight attached to the face biometric, possibly due to varying face poses and lighting during data acquisition (Figure 4(c), 4(d) and 4(e)). User 2 has a small weight attached to hand geometry due to incorrect placement of the hand and a curved little finger (Figures 4(f) and 4(g)).
would involve developing noise models for each biometric trait, that would enable the system to reject images whose quality may not be sufficient for user verification purposes. We are also working on techniques to estimate very small error rates in a multibiometric system. 5. REFERENCES [1] A. K. Jain, R. Bolle, and S. Pankanti, Eds., Biometrics: Personal Identification in Networked Society, Kluwer Academic Publishers, 1999.
(a)
[2] L. O’Gorman, “Seven issues with human authentication technologies,” in Proceedings AutoID , Tarrytown, New York, Mar 2002, pp. 185–186.
(b)
[3] R. Brunelli and D. Falavigna, “Person identification using multiple cues,” IEEE Transactions on PAMI, vol. 12, no. 10, pp. 955–966, Oct 1995. (c)
(d)
(f)
(e)
(g)
Fig. 4. (a) and (b) Fingerprint images of user 4 whose ridge details are not very clear (W1 = 0); (c),(d) and (e) Varying face poses of user 3 (W2 = 0.1); (f) and (g) Incorrect placement of hand and the curved finger of user 2 (W3 = 0.2.)
4. CONCLUSIONS We have demonstrated that the performance of a biometric system can be enhanced by computing user-specific thresholds. These thresholds may be computed for individual biometric traits, or may be computed after consolidating the scores provided by multiple traits. This improves user convenience by reducing the false reject rate. User habituation will also help reduce the false reject rate. The performance can be further improved by assigning user-specific weights to the various traits when combining the matching scores. Multibiometrics reduces the failure to enroll problem. By assigning smaller weights to those traits for which a user’s sample are consistently noisy, one can accommodate more people in the system. These parameters can be estimated from the training data provided by the user. Future work
[4] E.S. Bigun, J. Bigun, B. Duc, and S. Fischer, “Expert conciliation for multimodal person authentication systems using Bayesian statistics,” in Proceedings AVBPA’97, Crans-Montana, Switzerland, March 1997, pp. 291–300. [5] P. Verlinde and G. Cholet, “Comparing decision fusion paradigms using k-NN based classifiers, decision trees and logistic regression in a multi-modal identity verification application,” in Proceedings AVBPA’99, Washington D.C., USA, March 1999, pp. 188–193. [6] L. I. Kuncheva, C. J. Whitaker, C. A. Shipp, and R. P. W. Duin, “Is independence good for combining classifiers?,” in Proceedings ICPR, Barcelona, Spain, 2001, vol. 2, pp. 168–171. [7] L. Hong, A. K. Jain, and S. Pankanti, “Can multibiometrics improve performance?,” in Proceedings AutoID’99, Summit(NJ), USA, Oct 1999, pp. 59–64. [8] A. Ross, A. K. Jain, and J. Qian, “Information fusion in biometrics,” in Proceedings AVBPA’01, Halmstad, Sweden, Jun 2001, pp. 354–359. [9] A. K. Jain, L. Hong, S. Pankanti, and R. Bolle, “An identity authentication system using fingerprints,” Proceedings of the IEEE, vol. 85, no. 9, pp. 1365– 1388, 1997. [10] M. Turk and A. Pentland, “Eigenfaces for recognition,” Journal of Cognitive Neuroscience, vol. 3, no. 1, pp. 71–86, 1991. [11] A. K. Jain, A. Ross, and S. Pankanti, “A prototype hand geometry-based verification system,” in Proceedings AVBPA’99, Washington, D.C., USA, March 1999, pp. 166–171.