function based on feature attributes. 7. References. [1] R. C. Bolles, H. H. Baker, and M. J. Hannah, âThe. JISCT Stereo Evaluationâ DARPA Image Understand.
Linear Complexity Stereo Matching Based on Region Indexing Marco Antonio Floriano de Oliveira, Raul Sidnei Wazlavick Federal University of Santa Catarina (UFSC) 88040-900 Florianopolis – SC, Brazil – PO Box 476 {marco, raul}@inf.ufsc.br Abstract This paper presents a linear complexity method for real-time stereo matching, in which the processing time is only dependent on the image resolution. Re gions along each epipolar line are indexed to produce the disparity map, instead of searching for the best match. Current local methods have non-linear com plexity, as they all rely on searching through a corre lation space. The present method is limited to a paral lel camera setup, because all disparities must occur in the same direction. A continuity constraint is applied in order to remove false matches. The resulting map is semi-dense, but disparities are well distributed. Exper imental results on standard datasets reach around 90% of accuracy using the same parameters in all tests.
1. Introduction Stereo matching is the process of calculating dispar ities between images with a displacement in the scene viewpoint. This process can be restricted to one dimen sion with the epipolar constraint, as the disparities al ways occur along the epipolar lines [6]. Methods for stereo matching may have a local or global approach [9]. In local methods, the disparity cal culation is based on a correlation that depends only on the information of a local region. In global methods, this calculation is based on the minimization of a glob al cost function, producing more accurate disparity maps, with a higher processing time. Local correlation between the stereo pair can be based on intensity values [4], feature attributes [13], or both [2]. Intensity-based correlation produces dense disparity maps, but tends to generate errors in areas with low or repetitive texture and depth discontinuities. Feature-based correlation is more reliable, but needs feature extraction preprocessing and produces sparse and irregularly distributed disparities.
Current local methods calculate disparities with an inherent combinatorial complexity, as a search is done to find the best match for a point among the n points in the corresponding epipolar line or, at least, a subset of it (the search range). Because of that, they have nonlinear time complexity. In order to produce a disparity map with reasonable quality and a relatively low processing time, recent methods use hardware parallel processing [5], opti mized implementations [3], or try to reduce the search range with a number of approaches, such as coarse-tofine scheme [11] and disparity windows prediction in stereo image sequence [7]. But if a linear complexity, On , is desired for processing each epipolar line (which is the case in real-time systems), a search for the best match should be avoided. In this paper, a method for stereo matching is pre sented, in which the time complexity is linear to the number of points in the image, Omn, where m is the number of lines and n is the number of columns. It is based on a region indexing process instead of search ing through a correlation space, so that the disparity range between the stereo pair has no impact in the pro cessing time.
2. Region indexing In current local methods, the correlation function explicitly compares two regions, whether a region is taken as intensity values or feature attributes. This comparison results in an indication on how good is the match. In order to avoid combinatorial complexity, a search for the best match cannot be done. In this case, comparing two regions explicitly is pointless, because a region in the left image can be compared to no more than one region in the right image. Searching for the best match for each region in a line is On2 for any possible disparity, or Ons if the search range is restricted to s. When s = 1, the com plexity is On , but no search is possible. Thus, if no criterion is used to select a region among others in the
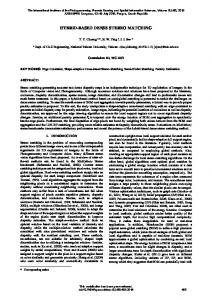
same line, the probability of matching successfully a region is 1/ n and the expected number of successful matches in a line is 1. An indexing process makes possible to establish a criterion for selecting a correlated region based on how it is evaluated for the index calculation. Assuming that f I i j calculates a discriminant value for the region surrounding the point i , j in the image I, and that f maps highly correlated regions to the same value and uncorrelated regions to different values, the matching can be done by indexing each region in both images, taking f as an indexing function. If the cameras are parallel, the projective planes are coplanar and a region Li j in the left image can match only a region Ri j−d in the right image with a disparity d ≥ 0, which means that all disparities in the line occur in the same direction (i.e. with the same sign). It makes all match candidates to be processed and indexed be fore reaching Li j , allowing the matching process to be done in constant time for each region. left: (a)
right: left: (b)
right: 0
j-d
j
Figure 1. Region indexing: (a) two matches; (b) match limitation (positive disparity). The indexing function acts as a heuristic function allowing sufficient valid matches to be archived in a lower complexity algorithm. The complexity reduction to On makes the processing time linear and indepen dent on the disparity range, while the amount of valid matches becomes dependent on the indexing function definition.
2.1. Matching algorithm With a defined indexing function f, the regions along corresponding epipolar lines in both rectified im ages can be indexed in order to calculate disparities. From the beginning to the end of each line, region pairs in each column are processed. A region in the right im age is indexed if the position in the vector is free, and a region in the left image match a previously indexed re gion if the position is taken.
for line i from 0 to m−1 p 0 for column j from 0 to n−1 if vector f Ri j is empty vector f Ri j j list p f R i j p p1 end if vector f Li j is not empty disparity i , j j – vector f L i j empty vector f Li j end end for position j from 0 to p−1 if vector list j is not empty empty vector list j end end end Figure 2. Basic algorithm for region indexing. It is possible for Ri j−d to be incorrectly matched to Li j−d ' before the corresponding region L i j is reached, where 0 d ' ≤ d , if the area between j−d and j has low or repetitive texture (the discriminant value will be repeated). Often, d' is close or equal to d. Those false matches may be hard to detect, but most of them can be avoided in the indexing process by equally displacing all left regions, so that Li j can match regions up to column jh, where h is a positive displacement value. This way, matches resulting in negative disparities (opposite direction) can be ignored, as disparities always have the same direction due to the restriction shown in Figure 1. The displacement makes possible to check whether a match is done because of a lack of texture variation. Figure 4 shows the algorithm modification regarding this displacement. left: (a)
right: left:
j-d j-d' 0
j
j-d
j (b)
right: 0
j-d
j
j+h
Figure 3. Low or repetitive texture problem: (a) false match; (b) horizontal displacement.
for column j from −h to n−1 if jh n ∧ vector f Ri j h is empty vector f R i jh jh list p f R i jh p p1 end if j ≥ 0 ∧ vector f Li j is not empty if j – vector f Li j ≥ 0 disparity i , j j – vector f L i j end empty vector f L i j end end Figure 4. Indexing regions in a displaced line. This matching algorithm imposes the restriction that the index f R i j−d is unavailable after Ri j−d was in dexed and before either a false match occurs, or the corresponding region Li j is reached and matched. This way, regions in the right image with the same discrimi nant value cannot be indexed at same time, so the first one locks the position until it is matched. left: right:
j-d
k
f R i j−d ≠ f R i k
similarity between the regions L and R, these three characteristics above can be formally defined as fol lows: (i) if two regions Li j and Ri j−d are similar, then there is a high probability that the discriminant values of these regions are the same (i.e. similarity implies equal discriminant, in most cases): nc Li j , R i j−d ≈ 1 P f Li j = f R i j−d ≈ 1
(ii) if two regions Li j and Ri j−d are not similar, then there is a high probability that the discriminant values of these regions are different (i.e. non-similarity implies different discriminant, in most cases): nc Li j , R i j− d ≈ 0 P f Li j ≠ f R i j− d ≈ 1
j−d ≤ k ≤ j
Figure 5. Index unavailability. A false match can occur when two uncorrelated re gions have the same discriminant value. Even if the in dexing function is defined in a way to try to reduce this occurrence, the index contains little information about the region because it is a value in a relatively short in terval, as the indexing vector cannot be too big due to memory constraints.
2.2. Indexing function Valid matches can be calculated if the indexing function maps similar regions to the same value and non-similar regions to different values, where similar means highly correlated or close to a common pattern. In order to remove false matches using continuity con straint, it is important that the disparities resulting from them compose a higher entropy set compared to the disparities resulting from valid matches. Supposing nc L , R is a correlation function nor malized to a value in [0 ;1 ] that estimate the degree of
2
(iii) if two regions Li j and Ri j−d are not similar and their discriminant values are the same, then this false match results in a disparity value d ∈[0; j ] fol lowing an uniform probability distribution: nc Li j , R i j− d ≈ 0 ∧ f L i j = f Li j−d 1 P d = x ≈ 0≤ x ≤ j j1
j
1
3
This last characteristic provides the basis for robust false match detection through continuity constraint. It states that, if the match is not valid, the resulting dis parity can assume any possible value with nearly the same probability, as any change in the discriminant value may lead to a completely arbitrary match.
2.3. Intensity-based indexing In the experimental results shown in this paper, the indexing function f I i j is based on some of the in tensity values of I i j . Each region has a fixed size of M rows and N columns. This function calculates a dis criminant value based on the region mean and how se lected points differ from it. The main term of function f is the region index yreg . Each bit in this index indicates whether the corre sponding intensity value has reached the region mean: M −1 N −1
yreg I i j =
∑ ∑ [2
u =0 v =0
K u , v−1
⋅ K u , v⋅
I i u , jv , I i j ]
4
The kernel K defines what region points will be used in the index calculation, where Ku , v ∈ {0, 1}, 0 ≤ u M, 0 ≤ v N . The function K u , v gives the number of points set to 1 in the kernel K, line by line, down to the position u , v:
Where K M −1, N −1 gives the size, in bits, of the region index yreg (it equals the number of points set to 1 in the kernel K, which are the points used for the calculation of this index), and yseg I i j is the seg ment index of I i j :
u⋅N v
K u , v =
∑
K w∖ N , r
yseg I i j = I i j ∖ 2 D−S
5
w=0
w ≡ r mod N The threshold function x , t outputs 1 if x ≥ t and 0 otherwise: x , t =
{
1 x ≥t 0 x t
6
The function I i j gives the intensity mean of I i j, which is used as the threshold value in (4): I i j =
1 MN
M −1 N −1
∑ ∑ I i u , jv
7
u =0 v =0
This way, a bit in the region index is set to 1 if the corresponding intensity value is greater or equal to the region mean, and set to 0 otherwise. Only points set to 1 in the kernel are used for this calculation. kernel: 1
1 1
1
1 1
1
selected points
1
region: mean value
index:
thresholding
1
1 1
1
Figure 6. Example of region index calculation. Increasing or decreasing all intensity values propor tionally does not affect the region index. This way, non-similar regions may have the same index, but they can be separated using the mean value. If the indexing vector is segmented based on this value, only regions with the same index and an approximate intensity mean will match. For 2S desired segments, S is the size, in bits, of the segment index yseg . The indexing function f concatenates the bits of these two indices: f I i j = y seg I i j ⋅2
K M −1, N −1
yreg I i j
Where D is the size, in bits, of an intensity value (i.e. the grayscale depth, so 2 D is the number of possi ble intensities). This indexing function is intensity-based only. The indexing vector is segmented to increase the potential amount of indexed regions.
3. False match detection A continuity constraint for false match detection is applied as a regularization process based on the en tropy difference between disparities resulting from valid and false matches. In the indexing process, false matches result in disparities with higher entropy than those resulting from valid matches because of the uni form probability distribution shown in (3) (a disparity can assume any possible value with nearly the same probability if it results from a false match). Each disparity d has a weight wd based on the map histogram. This weight is an arithmetic mean of the frequency of similar disparities (any disparity s, where ∣s−d ∣≤ 1) in the map. Thus, the weight vector is a smoothed version of the histogram. A match is considered valid if the weight sum of similar disparities is above a minimum threshold rela tive to the weight sum of all disparities in the verifica tion window: d 1
1
8
9
∑
s =d −1
∑ n −1
v s⋅w s ≥
a =0
va⋅w a ⋅1−
10
Where is a discontinuity tolerance value in [0 ;1 ], V is the histogram of the verification window, and n is the number of columns in the image (disparities may range up to n−1). As an additional criterion, a match can be removed if the amount of disparities that are equal to d is below a certain absolute minimum q. This continuity constraint is applied for each point in the disparity map. If there is no disparity calculated for a point, the last evaluated disparity is used. This re duces sparse areas in the map based on the assumption that a near disparity may still be correctly approved for the new point (facing the new neighborhood), as if re sulting from a valid match.
The resulting map can be equalized by replacing each approved disparity by the weighted mean of simi lar disparities in the verification window:
Remaining sparse areas in the disparity map are filled by nearest interpolation. For fast processing, each point in the map have the value of the nearest valid dis parity in the same or adjacent line or column.
d 1
d =
∑
s =d −1 d 1
∑
vs⋅ws⋅s
s=d −1
11 v s⋅ws
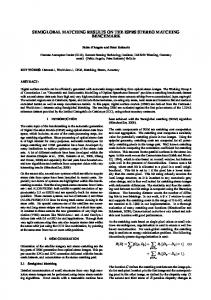
4. Experimental results In results from real images, nearly half of the re gions in the right image are indexed (regions with the same discriminant value cannot be indexed at the same time, as shown in Figure 5). Also, nearly half of this in dexed regions are matched to a region in the left image. Figures 7, 8, and 9 show intermediate results on “shrub” dataset [1].
(a)
(b)
Figure 7. Results on “shrub” dataset: (a) left image; (b) disparities from region indexing (regions: 51% indexed, 27% matched). After the false match detection through continuity constraint, the map is semi-dense, but disparities are well distributed and almost all false matches were re moved, as shown in Figure 8.
(a)
(b)
Figure 9. Nearest interpolated disparities: (a) non-equalized map; (b) equalized map. This nearest interpolation is limited to orthogonal directions, but can be reasonably uniform, even in cas es where the nearest point is considerably distant, be cause the map is continuous almost everywhere (with the exception of depth discontinuities) after the conti nuity constraint is applied. 3 2 8 7 6 5 4 3 2 1 8 7 6 5 4 3 2 1 8 7 6 5 4 3 2 1 2 3
3 3 2 2 1 1 2 3 4 5 6 7 8 1 2 3 4 5 6 7 8 1 1 2 3 4 5 6 7 8 2 2 3 3
Figure 10. Lines and columns for nearest interpolation. The disparity map is processed to generate an inter mediary map, where each point contains the distances from the two nearest disparities in orthogonal direc tions and their respective values (one is the last visited in the same or adjacent row, and the other is the last visited in the same or adjacent column). The final map is then calculated by running the original map back wards, keeping only the disparity with the smaller dis tance in all four directions.
4.1. Parameters (a)
(b)
Figure 8. Continuity constraint: (a) valid disparities (13% density); (b) using last evaluated disparity (40% density).
All experimental results shown in this paper were produced with the same parameters. It shows that the method can take different input and produce good re sults without requiring any adjustment.
Table 1. Region indexing parameters. stereo displacement, h 8 columns segment index size, S 4 bits region size, M×N 4×4 used region points, K
[ ] 1 0 1 0
0 1 0 1
1 0 1 0
0 1 0 1
(a)
(b)
(c)
(d)
Using this set of default parameters, the indexing vector will have 4096 positions (12-bit indices). Table 2. False match detection parameters. verification window 15×15 discontinuity tolerance, 0.6 min. equal disparities, q 8 An arithmetic mean filter with 2×2 window size is applied before the region indexing, because the method shows better results when the input image pair is smoothed. Individual intensities may vary slightly be tween correlated regions due to differences in the way the same surface is projected on the two cameras. This variation may affect the region index if the intensity value is close to the region mean. Smoothing the image pair causes each bit in the region index to be based on more than one point from the original image, reducing the impact of such variations.
Figure 11. Results on “tsukuba” dataset: (a) left image; (b) ground truth; (c) calculated map; (d) bad pixels (occlusion in gray). This way, the error is the percentage of bad pixels in non-occluded areas. The “tsukuba” dataset was first in troduced by Nakamura et al. [8], and the “map” dataset by Szeliski et al. [12].
4.2. Standard datasets The present method produces, in current personal computers, more than 30 frames per second with a res olution of 256×256 (less than a microsecond for each point). This is done for any possible disparity informa tion between the stereo pair, while current methods have a time penalty because of the search range. It has been observed empirically that the processing time de pends only on the image resolution, as proposed in the ory. The method was tested with the following stan dard datasets with ground truth and occlusion map:
(a)
(b)
(c)
(d)
- “tsukuba”, “sawtooth”, “venus” and “map” [9]; - “cones” and “teddy” [10].
Figure 12. Results on “map” dataset: (a) left image; (b) ground truth; (c) calculated map; (d) bad pixels (occlusion in gray).
The error is calculated by subtracting the resulting map from the ground truth and counting all absolute differences greater than 1, ignoring points in occluded areas (i.e. areas where a match cannot be done) and in the image borders (18 pixels for “tsukuba” dataset and 10 pixels for the others), as proposed by Scharstein et al. to evaluate the results from stereo methods [9].
Most of the disparity error concentrates near the ob ject borders and thin objects are lost, as can be seen in the error map (d) in Figure 11. Most of the bad pixels in Figure 12 are due to occlusion. Disparities in these areas have high entropy and can be removed, but the respective borders are affected because of the resulting sparse areas.
Table 3. Results on standard datasets.
(a)
(b)
map tsukuba sawtooth venus cones teddy resolution 284×216 384×288 434×380 434×383 450×375 450×375 indexing regions 59853 108585 162487 163780 166284 166284 indexed 79% 67% 72% 72% 71% 68% matched 35% 35% 37% 34% 35% 33% time 10 ms 17 ms 27 ms 27 ms 27 ms 27 ms continuity valid disp. 25% 25% 27% 22% 22% 20% final density 66% 59% 64% 55% 54% 51% time 15 ms 26 ms 42 ms 41 ms 42 ms 41 ms interpolation time 2 ms 4 ms 6 ms 6 ms 6 ms 6 ms error 0.63% 4.07% 3.33% 3.23% 5.68% 9.91% total time 27 ms 47 ms 75 ms 74 ms 75 ms 74 ms
The data within the images has negligible influence on the processing time (Figure 15), because the method complexity is not dependent on the disparity range, and each disparity is calculated in constant time. (c)
(d)
Figure 13. Results on “venus” dataset: (a) left image; (b) ground truth; (c) calculated map; (d) bad pixels (occlusion in gray).
110
(ms)
shrub
Running on a Pentium 4 at 2.8 GHz
100 90
teddy
80 70
Some error spots in Figure 13 are due to repetitive texture. As the region indexing is based on a local as sumption of similarity (regions with the same discrimi nant value are probably correlated), repetitive texture may form dense groups of false matches which cannot be removed applying the continuity constraint, but can be mostly ignored in the region indexing phase, using the algorithm modification shown in Figure 4.
(a)
(b)
(c)
(d)
Figure 14. Results on “sawtooth” dataset: (a) left image; (b) ground truth; (c) calculated map; (d) bad pixels (occlusion in gray).
60
tsukuba
50 40
map
30 20 10
sawtooth, venus, cones, and teddy have almost the same resolution and processing time.
0 0
50000
100000
150000
200000
(points) 250000
Figure 15. Processing time for datasets with different resolutions.
(a)
(b)
(c)
(d)
Figure 16. Results on “cones” dataset: (a) left image; (b) ground truth; (c) calculated map; (d) bad pixels (occlusion in gray).
An interesting extension of this work is the applica tion of region indexing to motion estimation. In this case, the complexity remains Omn, but the indexing vector should be used for the whole image instead of each separate line, as the disparities occur in 2D, and not only horizontally. Other possible extension is the use of an indexing function based on feature attributes. (a)
(c)
(b)
(d)
Figure 17. Results on “teddy” dataset: (a) left image; (b) ground truth; (c) calculated map; (d) bad pixels (occlusion in gray).
5. Conclusion The main contribution of this work is the definition of a linear complexity method for stereo matching. The use of an indexing process makes possible for each epipolar line to be computed in On for calculating disparities, which results in linear complexity to the number of points in the image. Current local methods make a search through a correlation space, which re sults in non-linear complexity. In order to match a region, all match candidates in the corresponding epipolar line must be indexed first. This makes all disparities to occur in the same direc tion (i.e. to have the same sign), so the projective planes must be coplanar, limiting the method to a par allel camera setup. The resulting map is not dense and must be interpo lated, but disparities are well distributed, with some sparse areas due to low texture and occluded points. As a consequence of occlusion and simplicity of the in dexing function, object borders are not well defined and concentrate most of the error when comparing with the ground truth. Nevertheless, the accuracy is nearly 90% on standard datasets, using the same parameters in all tests.
6. Future work The proposed method is suitable for real-time sys tems that require stereo vision, such as robot vision and augmented reality.
7. References [1] R. C. Bolles, H. H. Baker, and M. J. Hannah, “The JISCT Stereo Evaluation” DARPA Image Understand ing Workshop, Apr. 1993, pp. 263–274. [2] S. D. Cochran and G. Medioni, “3-D Surface Descrip tion from Binocular Stereo”, IEEE Transactions on Pat tern Analysis and Machine Intelligence, vol. 14, Oct. 1992, pp. 981-994. [3] L. Di Stefano, M. Marchionni, S. Mattoccia, and G. Neri, “A Fast Area-Based Stereo Matching Algorithm”, Image and Vision Computing, vol. 22, Oct. 2004, pp. 983-1005. [4] H. Hirschmuler, “Improvements in Real-Time Correla tion-Based Stereo Vision”, IEEE Workshop on Stereo and Multi-Baseline Vision, Dec. 2001, pp. 141-148. [5] H. Jeong and S.-C. Park, “Trellis-based Systolic Multilayer Stereo Matching”, IEEE Workshop on Signal Pro cessing Systems, Aug. 2003, pp. 257-262. [6] Q.-T. Luong and O. D. Faugeras, “The Fundamental Matrix: Theory, Algorithms, and Stability Analysis”, International Journal of Computer Vision, vol. 17, Jan. 1996, pp. 43-75. [7] J. Mulligan and K. Daniilidis, “Predicting Disparity Windows for Real-time Stereo”, Proceedings of the 6th European Conference on Computer Vision, vol. 1, Jun. 2000, pp. 220-235. [8] Y. Nakamura, T. Matsuura, K. Satoh, and Y. Ohta, “Oc clusion Detectable Stereo – Occlusion Patterns in Cam era Matrix”, IEEE Conference on Computer Vision and Pattern Recognition, Jun. 1996, pp. 371–378. [9] D. Scharstein and R. Szeliski, “A Taxonomy and Evalu ation of Dense Two-Frame Stereo Correspondence Al gorithms”, International Journal of Computer Vision, vol 47, Apr. 2002, pp. 7-42. [10] D. Scharstein and R. Szeliski, “High-Accuracy Stereo Depth Maps Using Structured Light”, IEEE Conference on Computer Vision and Pattern Recognition, vol. 1, Jun. 2003, pp. 195-202. [11] C. Sun, “Fast Stereo Matching Using Rectangular Sub regioning and 3D Maximum-Surface Techniques”, In ternational Journal of Computer Vision, vol. 47, May 2002, pp. 99-117. [12] R. Szeliski and R. Zabih, “An Experimental Compari son of Stereo Algorithms”, International Workshop on Vision Algorithms, Sep. 1999, pp. 1-19. [13] O. Veksler, “Dense Features for Semi-Dense Stereo Correspondence”, International Journal of Computer Vision, vol. 47, Apr. 2002, pp. 247-260.