Original Research Article
published: 12 November 2010 doi: 10.3389/fpsyg.2010.00186
Does area V3A predict positions of moving objects? Gerrit W. Maus1,2,3*, Sarah Weigelt 4,5, Romi Nijhawan 3 and Lars Muckli 5,6 Department of Psychology, University of California at Berkeley, Berkeley, CA, USA Center for Mind and Brain, University of California Davis, Davis, CA, USA 3 School of Psychology, University of Sussex, Brighton, UK 4 Department of Brain and Cognitive Sciences and McGovern Institute for Brain Research, Massachusetts Institute of Technology, Cambridge, MA, USA 5 Brain Imaging Center Frankfurt and Department of Neurophysiology, Max Planck Institute for Brain Research, Frankfurt am Main, Germany 6 Centre for Cognitive Neuroimaging, Institute of Neuroscience and Psychology, College of Medical, Veterinary and Life Sciences, University of Glasgow, Glasgow, UK 1 2
Edited by: Frans Verstraten, Universiteit Utrecht, Netherlands Reviewed by: Ryota Kanai, University College London, UK Richard J. A. Van Wezel, Utrecht University, Netherlands Mark M. Schira, University of New South Wales, Australia *Correspondence: Gerrit W. Maus, Department of Psychology, University of California at Berkeley, 3210 Tolman Hall, Berkeley, CA 94720-1650, USA. e-mail:
[email protected]
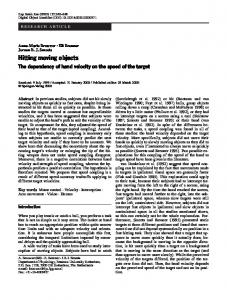
A gradually fading moving object is perceived to disappear at positions beyond its luminance detection threshold, whereas abrupt offsets are usually localized accurately. What role does retinotopic activity in visual cortex play in this motion-induced mislocalization of the endpoint of fading objects? Using functional magnetic resonance imaging (fMRI), we localized regions of interest (ROIs) in retinotopic maps abutting the trajectory endpoint of a bar moving either toward or away from this position while gradually decreasing or increasing in luminance. Area V3A showed predictive activity, with stronger fMRI responses for motion toward versus away from the ROI. This effect was independent of the change in luminance. In Area V1 we found higher activity for high-contrast onsets and offsets near the ROI, but no significant differences between motion directions. We suggest that perceived final positions of moving objects are based on an interplay of predictive position representations in higher motion-sensitive retinotopic areas and offset transients in primary visual cortex. Keywords: visual motion, prediction, localization, fMRI, V1, V3A
Introduction Processing of visual information in the nervous system takes time. For an acting organism in a dynamic environment this can cause severe problems. Processing delays mean that perceptual systems in the brain do not have access to the true position of a moving object at any time, but will always have delayed information. For interaction with a moving object accurate localization by the perceptual system is advantageous, as it reduces computational cost in the motor system, which additionally must deal with delays in efferent pathways and muscles (Wolpert et al., 1995). It has been proposed that perceptual systems comprise a prediction mechanism for moving objects that helps to overcome the consequences of neural delays. This mechanism becomes apparent in a variety of visual illusions, where motion causes objects to be perceptually mislocalized, usually shifted forward in the direction of motion (Whitney, 2002). One prominent example is the flash-lag effect: a moving object is seen ahead of a flashed object, although both are physically aligned at the time of the flash (Nijhawan, 1994, 2008). The absence of a perceived overshoot when moving objects disappear abruptly has been used to argue that the perceived position of moving objects is not generally based on predictive localization in the visual system (Eagleman and Sejnowski, 2000). However, some studies showed that predictive overshoots do exist in certain conditions, for example for low-contrast (Kanai et al., 2004), blurred (Fu et al., 2001), gradually fading moving objects (Maus and Nijhawan, 2006), biological motion (Kessler et al., 2010), or objects moving into the retinal blind spot (Maus and Nijhawan, 2008). Maus and Nijhawan (2006) employed a gradually fading moving object and showed that it is perceived to disappear at luminance contrasts below detection threshold. The final
www.frontiersin.org
part of the perceived trajectory is not based on retinal input, but on cortically extrapolated positions. Thus, when moving objects disappear without providing a transient signal, the object is seen disappearing in a predicted position. Abrupt offsets provide accurately localized transient signals that can mask extrapolated representations and thus facilitate the accurate perception of the final position. What cortical areas are involved in this particular kind of predictive position perception? Possible mechanisms include lateral spread of activity within retinotopic maps (Jancke et al., 2004) and feedback from motion-sensitive higher areas to V1 (PascualLeone and Walsh, 2001; McGraw et al., 2004; Wibral et al., 2009). Using functional magnetic resonance imaging (fMRI) it has been shown that in long-range apparent motion retinotopic activity in unstimulated regions of V1 reflects the illusory motion percept (Muckli et al., 2005; Larsen et al., 2006; Sterzer et al., 2006). Cortical feedback to V1 is essential for predictive coding of objects along the path of apparent motion (Wibral et al., 2009; Alink et al., 2010; Muckli, 2010). Here we measure activity in retinotopic areas corresponding to the illusory part of the trajectory of fading moving objects (Maus and Nijhawan, 2006). We focused on early visual areas: primary visual cortex (V1), area V2/V3, and area V3A, a mid-level area implicated in the perception of motion. A moving visual stimulus either gradually increased or decreased in luminance contrast, terminating either in a high- or low-contrast offset in its final position. We identified regions of interest (ROIs) in retinotopic maps abutting the start or end point of the motion trajectory. By comparing activity in the ROI for stimuli moving toward or away from the ROI we were able to analyze which retinotopic areas show predictive shifts of the represented object position.
November 2010 | Volume 1 | Article 186 | 1
Maus et al.
V3A predicts object position
Materials and Methods
in a high-contrast offset (hc-off). In two more conditions the bar moved counter-clockwise, either starting in a high-contrast onset (hc-on) or a low-contrast onset (lc-on, Figures 1A,B). Please note that the lc-off and lc-on conditions (as well as hc-off and hc-on) consisted of identical stimulation and differed only in the direction of motion of the bar. Critically however, onset is unpredictable and incorporates therefore no predictable signal whereas offset is anticipated by the movement toward the endpoint and incorporates predictive signals and the illusion of prolongated fading in the case of low-contrast offset. The rotation velocity of the bar in all conditions was 108°s−1. The motion sequence lasted 833 ms. For the retinotopic localization of regions of interest (ROIs) in visual cortex we presented rectangular flickering checkerboards (0.35 dva × 1.93 dva), in the area where the moving bars had their on- and offsets, to the right of the fixation cross on the horizontal meridian (cb-mid), as well as rotated 4° upward (counterclockwise around the fixation cross; upper checkerboard, cb-up) and 4° downward (clockwise; lower checkerboard, cb-low, see Figure 1C). The resulting distance between upper and lower checkerboard was only 0.89 dva at the inner edge and 1.16 dva at the outer edge, which is at the limit of what can be separated using fMRI (Kraft et al., 2005; Yacoub et al., 2008). The checkerboards consisted of a rectangle comprised of 2 × 11 alternating black and white squares that flickered at 6.7 Hz for 833 ms. The upper checkerboard was still on the motion trajectory whereas the lower checkerboard was on the illusory path that is perceived in low-contrast offset conditions only. The motivation for the mapping procedure was twofold: (1) to map the endpoint region
Participants
Ten participants (five female, mean age 25.9, standard deviation 4.4 years) took part in the fMRI study. All had normal or corrected to normal visual acuity and gave written consent after being informed about the study and the procedure. All procedures were approved by local ethics boards. Stimuli
Stimuli were projected with an LCD projector (Sanyo PLC-XP41 with a custom-build zoom lens) onto a frosted screen mounted in the scanner bore. Participants viewed the screen via a mirror from approximately 30 cm viewing distance. We were interested in the cortical representations of the start and end positions of a moving object’s trajectory. The moving object consisted of a white radial bar (0.17 dva × 1.74 dva)1 on a black background, moving smoothly for one-quarter of a circle in the upper right quadrant of the visual field (see Figure 1A). The inner end of the bar was at 6.4 dva eccentricity from the central fixation cross. The area of interest was the start/end position of the bar’s trajectory to the right of the fixation spot (at the 3 o’clock position). In two offset conditions the bar moved clockwise toward this area, while either fading constantly until it disappeared at the 3 o’clock position in a low-contrast offset (lcoff), or it gradually increased contrast and disappeared abruptly
For the remainder of the document, dva denotes “degree visual angle.” The degree sign “°” is used for degrees of rotation along the circular trajectory of the moving stimuli.
1
A
C
B
where it disappeared abruptly. These two conditions had weak transients near the region of interest just below the horizontal meridian. (B) In the other two conditions (hc-off and hc-on) the moving bar had high-contrast onsets/offsets at the horizontal meridian. (C) The checkerboard conditions were used as localizers to identify ROIs just below and just above the horizontal meridian. All three conditions are shown here (cb-up, cb-mid, cb-low), although only one checkerboard was presented in any given trial.
Figure 1 | (A) Illustration of the moving stimuli. All motion was smooth, only “snapshots” at different time points of the trajectory are shown here. In the lowcontrast offset condition (lc-off) a radial bar appeared at the 12 o’clock position and moved smoothly in a clockwise direction around the fixation point, while gradually fading. At the 3 o’clock position, on the horizontal meridian, it vanished. Oppositely, the low-contrast onset stimulus (lc-on) started moving from the 3 o’clock position and gradually increased in contrast until the 12 o’clock position,
Frontiers in Psychology | Perception Science
November 2010 | Volume 1 | Article 186 | 2
Maus et al.
in which the movement was either moving toward and ending (lc-off, hc-off) or starting (lc-on, hc-on), and (2) on a finer scale to map the illusion related prolongation (lc-off).
V3A predicts object position
angle = 60°, 16 slices, voxel size = 3.3 mm × 3.3 mm × 4.0 mm) with slices oriented approximately parallel to the Calcarine sulcus. A short TR of 1 s was used to be able to accurately reconstruct BOLD time courses using a deconvolution approach (see below).
Psychophysics study
Outside the MRI scanner we checked if the experimental stimuli replicated the effect described by Maus and Nijhawan (2006). For this we presented stimuli on a CRT screen, and asked five participants (one also took part in the fMRI study) to judge whether the endpoint (in the offset conditions with clockwise motion) or the start point (in the onset conditions with counter-clockwise motion) of the trajectory was above or below the horizontal meridian. The offset and onset conditions were presented in separate blocks of 280 trials each, with low- and high-contrast conditions randomly intermixed. The physical endpoint of the trajectory was varied to be in one of seven positions between 6° above and below the horizontal meridian in the offset conditions; the physical startpoint was between 2° above and 10° below the meridian in the onset conditions. Psychometric functions were fitted to each participant’s responses to estimate the point of subjective alignment (PSA) with the horizontal meridian for each condition. fMRI design
We used a rapid event-related fMRI design with a total of eight conditions: the four motion conditions (lc-off, lc-on, hc-off, hc-on), the three checkerboard conditions (cb-up, cb-mid, cb-low), and a fixation condition, where only the central fixation cross was visible. Rapid event-related designs allow for a high number of stimulus presentations with close spacing of trials. A trial of each condition started with the presentation of the visual stimulus for 833 ms and lasted 3 s in total. Participants were instructed to fixate the continuously presented fixation cross at all times and view the stimuli passively. The trials (130 in each condition, 1040 in total) were presented in a pseudo-random sequence that was counterbalanced for a trial history of two trials (Buracas and Boynton, 2002). This sequence was split into six runs of 175 trials. Each run, except for the first one, began with a repetition of the last two trials of the previous run to keep the balanced trial history. Further, each run started with 8 s and ended with 10 s of the fixation condition. In total, each run consisted of 540 recorded volumes, lasting 9 min. MRI acquisition
Magnetic resonance imaging data were obtained with a 3T Siemens Trio MR Imaging device (Siemens Medical Solutions, Erlangen, Germany) at the Brain Imaging Center Frankfurt using a standard 1-channel birdcage head coil. Each scanning session consisted of six functional runs and one anatomical scan, usually after the third functional run. For alignment with previous scans a lowresolution anatomical scans of the whole brain were recorded using a T1-weighted magnetization prepared rapid gradient echo sequence (TR = 2250 ms, TE = 4 ms, flip angle = 8°, 2 mm × 1 mm × 1 mm voxel resolution). For some subjects we had access to previously recorded high resolution data sets or recorded such a scan (MPRAGE TR = 2000 ms, TE = 4 ms, FA = 15º, 1 mm × 1 mm × 1 mm). For functional data acquisition we used an echo planar imaging sequence with high temporal resolution (TR = 1000 ms, TE = 30 ms, flip
www.frontiersin.org
fMRI data analysis
All data analysis was done with the BrainVoyager QX software package (Brain Innovation, Maastricht, The Netherlands) and MatLab (The Mathworks Inc., Natick, MA, USA). The functional data was preprocessed with 3D-motion correction, intra-session alignment, slice scan time correction, linear trend removal, and a temporal high-pass filter at 0.01 Hz. The functional data was then sub-sampled to 1 mm × 1 mm × 1 mm resolution, coaligned with the anatomical scan from the same session and transformed into Talairach space (Talairach and Tournoux, 1988). The rapid event-related design used closely spaced trials with one trial every 3 s, one of which is a fixation baseline condition (equally often presented as the other conditions). Because this leads to considerable overlap of the hemodynamic response to each trial, a general linear model (GLM) was fitted to the functional time course of each voxel to estimate the underlying hemodynamic responses to each stimulation condition by deconvolution (Serences, 2004). For each condition there were 20 box-car predictors in the GLM, one each for the 20 acquisition volumes recorded after each condition’s stimulus onset, covering the typical temporal range of a BOLD response. We identified ROIs in left occipital cortex of each participant with the following method. First, we were interested in the region representing the space close to the trajectory endpoint in the right visual field. In this region we expect to see differences between predictably approaching moving objects and suddenly appearing moving objects. Second we aimed to contrast the BOLD responses to the different motion conditions in retinotopic regions just below the horizontal meridian, where the stimulus in the motion conditions was not physically presented. Motion toward the endpoint ending in a low-contrast offset does, however, lead to a perceived overshoot. There is only a gradual difference between the physical endpoint and the illusory overshoot; the mapping strategy was nevertheless optimized to gradual differences between conditions. We used flickering checkerboards just below and just above the horizontal meridian as localizer stimuli to identify ROIs (separated by 0.9–1.1 dva). Because the activations in response to the localizer checkerboards overlapped considerably, we contrasted each voxel’s activation in response to the upper and lower checkerboard (in a 5–7 s peristimulus time window, when the BOLD responses peaked) against the fixation condition. We displayed the relative contribution (RC) of the upper and the lower checkerboard condition to the activation on a statistical map. A RC value of 1 means that the activation of the voxel is completely explained by the GLM predictors from the lower checkerboard condition, and a RC value of −1 means that the upper checkerboard explains the activation completely. We defined ROIs in 3D volume space above and below the meridian by selecting voxels with only negative or only positive RC values. Thresholds of RC maps were defined by a combined correlation value (and independent of the RC-value). Thresholds were individually adjusted to achieve roughly equal sizes of ROIs in each area across participants. In this way we identified
November 2010 | Volume 1 | Article 186 | 3
Maus et al.
V3A predicts object position
see Figure 2). High-contrast offsets near the horizontal meridian were perceived accurately (mean PSA 0.13°, SEM = 0.63°). The two conditions showed a statistical trend to differ reliably from each other (Wilcoxon signed-rank test, N = 5, Z = 1.75, p = 0.080). Onset positions for the moving bar with both low and high contrast onsets are misperceived as shifted forward, the welldocumented Fröhlich effect (Fröhlich, 1923; Kirschfeld and Kammer, 1999). This forward misperception is larger for the lowcontrast onset (lc-on) because it takes longer to register a lowcontrast stimulus. The mean PSAs for low and high-contrast onsets are 7.71° (SEM = 1.37°) and 2.11° (SEM = 0.70°), respectively, Z = 2.02, p = 0.021.
ROIs within the Calcarine sulcus (V1), along the V2/V3 borders in ventral and dorsal visual cortex, and in area V3A (see Table 1; Figure 3) – even though the spatial separation was only small (around 1 dva). ROI locations were visually checked on a cortical surface reconstruction. We focused on these early areas because of their relatively fine-grained representation of retinotopic space. Higher areas, especially MT+/V5, would potentially be interesting in this context, however, given the relatively small psychophysical effect and the close spacing of our localizer stimuli ROIs could not be selected using the same method, as receptive field sizes (or population receptive fields) and thus the overlap of activations to the different conditions were too big. The same strategy was successfully followed in earlier studies of our lab were we investigated long range apparent motion with stimuli separated by more than 8° visual angle (Muckli et al., 2005). For these ROIs we then recomputed fixed-effects deconvolution GLMs by averaging voxels within each ROI and concatenating time courses for each ROI from all participants. To estimate signal response amplitude we used two different measures. First, we quantified BOLD response amplitude to each motion condition by summing beta values from the GLM for the predictors of time points between 3 and 8 s after stimulus onset. This time window covers the typical BOLD response to our stimuli. Summing across this large time window gives a robust estimate of overall strength of BOLD response despite differences in latency to peak and dispersion of the BOLD responses between conditions. In a second analysis we fitted gamma functions to the beta values of the GLM using MatLab’s nlinfit algorithm. Gamma functions were of the form
fMRI data
Figure 3 shows the selected ROIs for two participants, projected onto an inflated reconstruction of visual cortex. This was performed for visualization purposes only and to confirm that the locations of ROIs in V1–V3A follow the pattern expected for visual positions around the horizontal meridian. The main analysis was performed in voxel space. Blue-turquoise areas represent retinotopic regions below the horizontal meridian with positive RC values, where the lower checkerboard contributed more to the voxels’ activation than the upper checkerboard. Yellow–orange areas are negative RC values and represent regions just above the horizontal meridian. Using these RC values we defined ROIs in the functional volume data for all participants. Figure 4A shows the BOLD time courses within the ROIs in response to the four motion conditions. Clockwise conditions with offsets near the ROIs are shown in blue, counter-clockwise (onset) conditions in red. Low-contrast conditions are shown in light colors, high-contrast conditions in fully saturated colors. Figure 4B shows the sum of beta values from the deconvolution GLM in a time window 3–8 s after stimulus onset. This time window covers the temporal extent of the BOLD response and the sum of betas indicates the overall strength of BOLD response. Figure 4C shows an additional way to quantify the BOLD response to the motion conditions. Gamma functions were fitted to the betas from the deconvolution GLM, and the area under the curve is taken as an index of BOLD response magnitude (see Materials and Methods). The first thing to note is that in V1 and V2/V3 high-contrast on- and offsets lead to higher BOLD responses than low-contrast on-/offsets. In V3A this difference is less pronounced. Second, in all ROIs offset conditions with motion toward the ROI lead to higher BOLD responses than onset conditions with motion away from the ROI, albeit to different degrees. The stimuli in the offset conditions differ from onset conditions only in their motion direction; the summed contrast is identical. We compared the offset conditions to the onset conditions by computing t-contrasts for the time points between 3 and 8 s after stimulus onset. Mean beta values, differences between offset and onset conditions, and results of the statistical comparisons are shown in Table 2. In area V1 differences between onsets and offsets were small and not significant. For the ROIs in V2/V3 the differences are equally small and non-significant for low-contrast conditions, but there are reliable differences between offsets and onsets for the high contrasts conditions. In area V3A, we need to
α
t t −α f (t ) = k e −β + c , tp 2 tp α = 2 * 8 log(2), w w2 β= , t p * 8 log(2) where k is a scaling factor, tp is the time-to-peak, w is the width at half maximum, and c is a constant offset. All parameters were fitted freely. We quantified the BOLD response by the product p*w (where p = f (tp) is the peak amplitude), which represents the triangular area spanned by the peak point and the two half-peak points under the curve of the gamma functions.
Results Psychophysics
In the psychophysical task outside the scanner participants judged the perceived start (end) point of a moving bar that started (stopped) moving on the horizontal meridian. Gradually fading moving bars were perceived to overshoot the physical end point. In the condition with a low-contrast offset (lc-off) the bar needed to physically disappear before the horizontal position to be perceived as disappearing there. The mean point of subjective alignment (PSA) as calculated from psychometric functions fitted to the responses of five participants in the lc-off condition was −2.58° (SEM = 1.19°;
Frontiers in Psychology | Perception Science
November 2010 | Volume 1 | Article 186 | 4
Maus et al.
V3A predicts object position
Table 1 | Talairach coordinates and sizes of ROIs for all participants. Area
V1d
V1v
Talairach coordinates
Number
Participant
x
Talairach coordinates
Number
of voxels
y
z
x
of voxels
y
z
1
−11
−79
6.2
245
−10
−78
4.1
68
2
−10
−82
−6.1
272
−8.5
−81
−10
266
3
−1.2
−85
−11
343
−1
−81
−11
174
4
−14
−79
−12
217
−12
−76
−11
149
5
−12
−78
5.4
294
−11
−76
4.6
131
6
−1.1
−94
−11
308
−3
−88
−13
126
7
−13
−85
4.2
162
−8.3
−84
2.2
372
8
−13
−82
−2.7
131
−14
−81
−9.4
288
9
−8.9
−79
−1.1
216
−10
−74
−6.7
276
10
−10
−79
0
275
−7.2
−80
−3.4
282
−9.4
−82.2
−2.8
246.3
−8.5
−79.9
−5.4
213.2
Group Area
V2d/V3
Talairach coordinates
V2v/VP Number
Talairach coordinates
Number
of voxels
of voxels
Participant
x
y
z
x
y
z
1
−3.9
−87.0
6.8
268
−10.0
−71.0
−8.6
313
2
−12.0
−91.0
9.3
292
−11.0
−76.0
−14.0
291
3
−7.7
−94.0
3.0
161
−5.3
−80.0
−16.0
197
4
−21.0
−86.0
3.5
265
−15.0
−66.0
−15.0
160
5
−25.0
−85.0
11.0
261
−18.0
−68.0
−11.0
338
6
−30.0
−76.0
11.0
129
−14.0
−74.0
−15.0
349
7
−25.0
−86.0
16.0
267
−15.0
−74.0
−9.5
218
8
−11.0
−88.0
11.0
304
−25.0
−73.0
−11.0
326
9
−19.0
−92.0
10.0
270
−18.0
−71.0
−20.0
210
10
−9.5
−90.0
21.0
219
−16.0
−77.0
−11.0
211
Group
−16.41
−87.5
10.26
243.6
−14.73
−73
−13.11
261.3
Area
V3A (below meridian)
Talairach coordinates
V3A (above meridian) Number
Talairach coordinates
Number
of voxels
of voxels
Participant
x
y
z
x
y
z
1
−6
−93
16
315
−13
−93
16
109
2
−26
−85
8.3
243
−30
−84
6
285
3
−21
−89
10
230
−16
−87
9.4
98
4
−20
−86
3.8
392
−25
−87
3.5
142
5
−30
−87
17
257
−26
−79
10
61
6
−23
−89
16
364
−17
−88
22
75
7
−25
−83
15
207
−30
−81
21
240
8
−24
−88
19
320
−28
−81
13
227
9
−18
−91
9.4
391
−26
−94
4.1
185
10
−17
−84
22
188
−20
−84
24
165
Group
−21
−87.5
13.7
290.7
−23.1
−85.8
12.9
158.7
www.frontiersin.org
November 2010 | Volume 1 | Article 186 | 5
Maus et al.
V3A predicts object position
motion away from the ROI. We analyzed one additional ROI roughly at the boundary of area V1v and V2v, retinotopically at the 12 o’clock position (see Supplementary Material). As expected, the trend in this ROI was reversed, so that counter-clockwise motion, moving toward this ROI, lead to marginally higher amplitudes than clockwise motion, receding from this ROI. The onset conditions with counter-clockwise motion (red curves in Figure 4A) led to earlier BOLD peaks than the offset conditions with clockwise motion (blue curves). This earlier peak is predicted from our stimulus design, because motion in the onset conditions started near the ROI at the beginning of each trial, whereas in the offset conditions the stimulus moved toward the ROI and terminated there 833 ms after the start of each trial. The time-to-peak parameter of the gamma-function fits can be used to quantify this. The differences between onset and offset conditions’ time-to-peak are shown in the right-most column of Table 2. In general, the differences are smaller than the expected value of 833 ms. This indicates that the object moving toward the ROIs is extrapolated and therefore the peak of activity is reached earlier as it would be, if it would follow the stimulus with a constant lag. Consistent with this interpretation, the difference between time-to-peak of offset and onset conditions is generally shorter in ventral ROIs (representing space above the meridian), since the clockwise moving object arrives there even earlier. Also, differences are smaller in higher areas, possibly due to larger receptive fields. However, these values have to be interpreted with caution. fMRI does not allow making judgments about the exact timing of neural processes, especially when comparing time courses between different areas, since hemodynamic properties might differ between areas and are summed over population receptive fields of different sizes.
above Meridian
10 8 6 4 2
below Meridian
Perceived onset/offset position (degree rotation)
distinguish between the ROIs representing areas above and below the meridian. The pattern in the ROI above the meridian resembles that found in the V2/V3 ROIs. In the ROI below the meridian the difference between low-contrast offset and onset is marginally significant (uncorrected, see Table 2). Although not significant in all ROIs examined, there is a general trend for clockwise motion toward the ROI at the 3 o’clock position to result in higher BOLD amplitudes than counter-clockwise
0 -2 -4 -6
hc-off
lc-off
hc-on
lc-on
Figure 2 | The mean perceived offset and onset positions from the psychophysics experiment outside of the MRI scanner (n = 5). A lowcontrast offset (lc-off) leads to a perceived overshoot, high-contrast offsets (hc-off) are perceived accurately. Onsets are mislocalized forward in the direction of motion, the well-documented Fröhlich effect. Error bars are standard errors of the mean.
Figure 3 | The ROIs in the left hemisphere of two participants. The view is on the occipital pole of “inflated” cortices. Blue-turquoise areas show positive, yellow-orange negative RC values (positive RC values are retinotopic positions below the horizontal meridian). The circled areas show the selected ROIs in V1 (in the Calcarine sulcus), along the V2/V3 border in dorsal and ventral cortex, and in V3A.
Frontiers in Psychology | Perception Science
November 2010 | Volume 1 | Article 186 | 6
Maus et al.
V3A predicts object position
B
A 0.8
0.4 0.2 0 5
10
0.6 0.4 0.2 0 5
10
0
hc-on
2
1.5
1.5
1
1
0.5
0.5 lc-off
lc-on
hc-off
0
hc-on
2
0.4
1.5
1.5
5
10
1
1 0.5 lc-off
lc-on
hc-off
0
hc-on
0.8
2.5
0.6
2
2
0.4
1.5
1.5
0
5
10
1
1 0.5 lc-off
lc-on
hc-off
0
hc-on
0.6 0.4 0.2 0
2
2
1.5
1.5
1
1
0.5
0.5
0 0
5
10
15
sum of beta values
0.8 0.6 0.4 0.2 0 0
5
10
Time after stimulus onset (s)
15
lc-off
lc-on
hc-off
0
hc-on
2.5 2 1.5 1 0.5 0
hc-on
lc-off
lc-on
hc-off
hc-on
lc-off
lc-on
hc-off
hc-on
lc-off
lc-on
hc-off
hc-on
lc-off
lc-on
hc-off
hc-on
lc-on
hc-off
hc-on
2.5
2.5
0.8
hc-off
2.5
0.5 0
15
lc-on
2.5
0.5 0
15
lc-off
2.5
2
2
0
beta value
hc-off
2.5
0.2
above meridian
lc-on
0.6
0
V3A
lc-off
0.8
0
V2v/VP
1 0.5
15
0.2
V1v
1 0.5
0 0
V3A
2 1.5
2.5
0.8
V2d/V3
2 1.5
0
15
2.5
sum of beta values
below meridian
0
Area under BOLD curve
2.5
lc-off lc-on hc-off hc-on
0.6
V1d
C
Sum of betas 3-8 s after stimulus onset
BOLD time courses
lc-off
lc-on
hc-off
Stimulus condition
hc-on
2.5 2 1.5 1 0.5 0
lc-off
Stimulus condition
Figure 4 | (A) BOLD time courses (as reconstructed by a fixed-effects deconvolution GLM) in response to the four motion conditions and fitted gammafunctions. (B) Sum of beta values from the deconvolution GLM in a time window 3–8 s after stimulus onset. (C) Area under curve as an index of BOLD response magnitude.
Discussion We were looking for predictive activity in response to moving stimuli. By comparing activity in a region next to the start-/endpoint of a moving object’s trajectory, we were able to assess whether the cortical representation of a moving object in the respective retinotopic map was shifted in the direction of motion. Higher activity for motion toward the ROI, especially in the unstimulated region below the meridian, is indicative of a forward shift of the object’s representation. Regarding the representation of the moving object’s start and end position, the following pattern emerges. In V1, positions are represented accurately with a small but not statistically reliable bias for higher activity in response to objects moving toward the ROI. The far bigger determinant of activity in V1 is contrast, with higher-contrast stimuli leading to higher activity.
www.frontiersin.org
In V2/V3 contrast is still the main determinant of strength of response, but the difference between high- and low-contrast conditions is smaller than in V1. Interestingly, there is a large difference between motion directions for high-contrast objects: motion toward the ROI leads to reliably higher activation than objects moving away from it. This might reflect the Fröhlich effect, indicating that the receding object only becomes visible in a later position of the trajectory, or extrapolation of the moving bar toward the endpoint of the trajectory. Psychophysically both effects are larger for lowcontrast objects, but the difference in BOLD is observed reliably only for higher contrast objects. Note that the low-contrast bar was barely visible near the ROI, and thus observing reliable differences in BOLD would also be difficult. The effects of both extrapolation at the trajectory endpoint and the Fröhlich effect are additive, i.e., both
November 2010 | Volume 1 | Article 186 | 7
Maus et al.
V3A predicts object position
Table 2 | Sum of beta weights for predictors 3–8 s after stimulus onset in each condition for all ROIs (the same data is plotted in Figure 4B). ROI
Cond.
Σ betas
Diff.
SE
t
p
V1d
lc-off
0.730
0.094
0.096
0.99
0.3247
lc-on
0.636
hc-off
1.191
hc-on
1.075
V2d/V3
lc-off
0.938
lc-on
0.830
hc-off
1.440
hc-on
1.005
V3A below
lc-off
1.607
lc-on
1.414
hc-off
1.815
hc-on
1.479
V1v
lc-off
1.052
lc-on
0.926
hc-off
1.715
hc-on
1.582
V2v/VP
lc-off
1.618
lc-on
1.578
hc-off
2.260
hc-on
1.913
V3A above
lc-off
1.859
lc-on
1.770
hc-off
2.003
hc-on
1.716
0.116 0.108 0.435 0.193 0.336 0.126 0.133 0.040 0.347 0.089 0.287
0.096 0.098 0.097 0.098 0.098 0.097 0.096 0.097 0.096 0.099 0.098
1.22 1.11 4.47 1.96 3.45 1.30 1.39 0.43 3.62 0.88 2.90
Sig
0.2215 0.2675