more accurate estimation of the soft error susceptibility of sequential circuits. The approaches presented in [2] and [5] are incorporated into our analysis of ...
MARS-S: Modeling and Reduction of Soft Errors in Sequential Circuits* Natasa Miskov-Zivanov, Diana Marculescu Department of Electrical and Computer Engineering Carnegie Mellon University {nmiskov,dianam}@ece.cmu.edu
Abstract Due to the shrinking of feature size and reduction in supply voltages, nanoscale circuits have become more susceptible to radiation induced transient faults. In this paper, we use a symbolic framework based on BDDs and ADDs that enables analysis of sequential circuit reliability from different aspects: output susceptibility to error, influence of individual gates on individual outputs and overall circuit reliability, and the dependence of circuit reliability on glitch duration, amplitude, and input patterns. The framework can be used for selective gate sizing targeting radiation hardening which is done only for gates with error impact exceeding a certain threshold. Using such a technique SER can be reduced by 80% for various threshold values, when applied to a subset of ISCAS’89 benchmarks.
1. Introduction Transient faults caused by radiation are becoming a major barrier to robust system design manufactured at technology nodes like 90nm, 65nm or smaller. Although once regarded as a concern only for space applications, the high data-integrity and reliability requirements make these faults an extremely important design aspect for microprocessors or other commodity components [1]. The free carriers (collected charge) that are created around the track of a radiation-induced charged particle passing through a microelectronic device can result in an electrical pulse, single-event transient (SET) which, if larger than the critical charge of the device, can disrupt normal device operation. This disruption is not associated with any permanent damage to the device and is thus called a soft error or a single-event upset (SEU). The effect of soft errors is measured by the soft error rate (SER) in FITs (failure-in-time), which is defined as one failure in 109 hours. Traditionally, memory elements have been much more sensitive to soft errors than combinational logic circuits. Three masking factors used to have a significant impact on logic soft error susceptibility: • logical masking – to be latched, a SET has to propagate on a sensitized path from the originating location to a latch; • electrical masking – due to the electrical properties of the gates the glitch is passing through, it can be attenuated or completely masked before it reaches the latch; • latching-window masking – only if the glitch reaches the latch and satisfies setup and hold time conditions, it will be latched. With technology scaling, the impact of the three masking factors on radiation-induced SET is decreasing [2]. Once a SET can propagate freely through logic, sequential circuits will * This work was supported in part by National Science Foundation Grant CCF-0542644.
become very sensitive to such events [3]. This is due to the fact that, once latched, soft errors can propagate through the sequential circuit in subsequent clock cycles and thus affect the outputs of the circuit more than once. Therefore, the protection from radiation induced transient faults has become as important as other product characteristics such as performance or power consumption [1]. When an estimated SER for a given product is higher than a given threshold, mitigation techniques need to be considered. The most obvious way to eliminate soft errors would be to get rid of the radiation sources that cause them. The solution for the remaining SER would be to make different process and technology choices. Furthermore, radiation sensitivity can be reduced significantly by design and layout changes. Any change, which increases critical charge while maintaining or reducing collected charge, will improve the SER of a device. In this work, we show how a methodology that includes symbolic modeling and efficient estimation of the susceptibility of a sequential circuit to soft errors can be applied to find the gates that have the highest soft error impact, that is, the gates that contribute the most to the soft error rate of the logic circuit. We use this information for selective gate resizing in order to significantly harden the circuit with a reasonable area overhead. The rest of this paper is organized as follows. In Section 2 we give an overview of related work and outline the contribution of our work. In Section 3, we briefly review the sequential circuit preliminaries. In Section 4, we describe our methodology for SER and gate error impact evaluation. Section 5 presents in more detail the proposed radiation hardening approach. In Section 6, we report experimental results for a set of common benchmarks. Finally, with Section 7 we conclude our work.
2. Related work Intensive research has been done so far in the area of analysis of transient faults in combinational [1-3] and more recently, sequential circuits [4,5]. In this section, we give a brief overview of the methods used to find the susceptibility to soft errors of combinational and sequential circuits, as well as some hardening techniques. We also outline the contributions of our work and compare it to previous work.
2.1. SER evaluation and hardening One obvious approach to analyze circuit soft error susceptibility is to use fault injection and simulate the circuit for different input vectors in order to find whether the fault propagates [1,3,6]. However, this approach becomes intractable for larger circuits and larger number of inputs and thus, indicates the need for approximate approaches that use analytical and symbolic methods to evaluate circuit susceptibility to soft errors.
A number of analytic methods have been proposed recently to evaluate the susceptibility of combinational logic circuits to soft errors. Several symbolic models have also been developed to estimate the susceptibility of logic circuits to soft errors. The approach proposed in [2] uses Binary Decision Diagrams (BDDs) and Algebraic Decision Diagrams (ADDs) to allow for a unified treatment of logical, electrical and latching-window masking effects. Compared to the number of methods proposed for modeling soft error susceptibility of combinational circuits, sequential circuits have received less attention. Most of the previous work in evaluating SER in sequential circuits has been done using simulation. Similar to combinational circuits, the alternative to simulation is analytical/symbolic modeling. One method that evaluates the probability of latching the error in sequential circuit in the cycles following the particle hit was proposed by Asadi et al. [4]. In that work, the authors assume hits can happen at state flip-flops only and then, based on this information, find the error probability at each output due to each individual flip-flop hit. This analysis excludes cases where internal gates of circuit’s combinational logic are affected. In their case, the error at the output of combinational logic due to a state line error is found considering logical masking only. Such an approach cannot be used for the case of internal gate hits where electrical and latching-window masking need to be included as well. Furthermore, the authors report their results in terms of the mean time to manifest error (MTTM), and not in terms of SER, which is the most common metric for measuring the soft error susceptibility of circuits. A method that assumes a particle hit can occur in both combinational logic and flip-flops and that evaluates the soft error susceptibility of sequential circuits using the SER metric, was recently proposed in [5]. In that work, the unified treatment of the three masking factors is used, allowing for more accurate estimation of the soft error susceptibility of sequential circuits. The approaches presented in [2] and [5] are incorporated into our analysis of sequential circuits and thus their main aspects will be discussed in Sections 3.3 and 4, respectively. Soft error mitigation techniques can be classified into three distinct categories [6]. Device-level hardening approaches mainly aim to reduce and mitigate the effects of charge collection at the site of the particle strike. Since these approaches require fundamental changes in the manufacturing process, methods that can be applied at the circuit level became a more popular research topic [2]. Circuit-level techniques rely on changes in the circuit design. So far, these techniques have been focused mostly on hardening memories, latches and flip-flops. However, as already mentioned, the SER sensitivity of sequential and combinational logic is increasing with scaling. Soft errors in logic are particularly a concern in high-reliability systems whose memory has been protected by error correction and the peripheral logic failure rate may be the dominant reliability failure mechanism. System-level techniques deal with soft errors at the system architecture level. System-level hardening techniques for logic circuits usually involve the introduction of redundancy into the design. One cost-effective approach that uses a fundamental method to harden the circuit against soft errors was proposed in [7], where authors use selective gate resizing for increasing the critical charge of the gates that have the largest impact on
the soft error susceptibility of the combinational circuit. In this work, we incorporate a similar hardening method into our framework, but for sequential circuit soft error modeling and reduction (not just combinational circuits). Thus, we describe the gate resizing in more detail in Section 5.
2.2. Paper contribution In this paper, we show how the methods proposed in [2] and [5] can be used for radiation hardening of sequential circuits, when gate resizing is applied. In the following, we briefly outline the contributions of our work. Unified masking effect modeling and efficient estimation of SER in sequential circuits. The framework proposed in [2] for soft error susceptibility evaluation of combinational circuits was chosen as the basis for sequential circuit analysis due to the fact that it provides a unified treatment of the three masking factors: logical, electrical and latching-window masking. To take into account the joint effect of logical, electrical and latching-window masking and, at the same time, to allow for the efficient estimation of the effects in time of SET on the outputs of the sequential circuit, we use one of the methods described in [5]. In [5], Markov chain analysis and sequential circuit unrolling are proposed for analyzing the SER in sequential circuits. Although there has been a lot of work in the area of modeling the probabilistic behavior of finite state machines (FSMs) by using the Markovian analysis [8,9], the main goal of those methods was calculating steady-state behavior of the circuit. As opposed to these approaches, sequential circuit unrolling allows for both transient and steady-state evaluation of the propagation of SET and the soft error susceptibility of sequential circuits. While [5] compares and contrasts Markov chain analysis and sequential circuit unrolling in terms of accuracy in SER evaluation, here we rely only on the latter due to its wider applicability and practicability. Gate resizing for sequential circuit hardening. Once soft error impact of individual gates is known, we can determine sensitive areas of the chip and therefore apply specific radiation hardening techniques. As already mentioned, in this paper we focus on circuit-level hardening technique that resizes selected gates such that the critical charge needed to change the output of a gate is increased. We determine the mean error impact (MEI) of a gate by averaging its error impact across all outputs and all probability
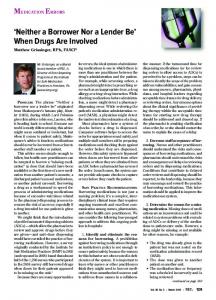
Fig. 1. SER changes in the cycles following the particle hit, compared to the SER during the first cycle, before and after gate resizing, for four benchmark circuits.
distributions. All gates with MEI larger than a given threshold are resized, such that the outputs of those gates are not affected when hit by particles with energies in a given interval. As criteria for choosing gates to be resized, we use: (i) the MEI of a gate averaged across all cycles under consideration in the target circuit, and (ii) the MEI of a gate determined only during the cycle when hit happens. In Fig. 1, we show how the SER changes in the cycles following the particle hit, before and after gate resizing, for a set of benchmark circuits, when the second criterion is used. The results on both curves in Fig. 1, “original” and “resized” are presented as a percentage of the original SER value during the first cycle. It can be seen from Fig. 1 that the SER decreases rapidly after the first cycle both before and after resizing. Furthermore, after resizing, the SER improves even during the first cycle by as much as 83%. As it will be seen from the results presented in Section 6, using the first criterion leads to a smaller number of resized gates (and potentially less area overhead). This is due to the fact that MEI, as well as SER, most often decreases when propagating through the unrolled circuit, while, usually, it is largest during the first cycle (when hit occurs). Thus, this once more supports the fact that: (i) considering only the combinational logic effects during the cycle when hit occurs is not sufficient for SER analysis; and (ii) time-dependent analysis is necessary in sequential circuits as opposed to just steady-state analysis which cannot give any insight into the transient behavior of the circuit.
3. Sequential circuits - preliminaries A typical sequential circuit consists of combinational logic and flip-flops (FFs). The inputs to the combinational logic are the primary inputs and the outputs of FFs, while the outputs of combinational logic are the primary outputs and inputs of the FFs.
3.1. Radiation-induced SET in sequential circuits When a particle hit occurs, there are two possible cases: • The particle hits an internal gate of the combinational logic; • The particle hits a flip-flop storing the internal state of the circuit. In both cases, a symbolic framework targeting combinational logic susceptibility to soft errors can be used, with the difference that in the second case no electrical masking is needed as errors are already latched as full swing signals. In addition, when considering their susceptibility to soft errors, sequential circuits differ from combinational circuits since the error can be propagated back to the inputs: while the outputs of combinational circuit are affected by error during a single clock cycle only, in sequential circuits outputs can be affected during several consecutive clock cycles.
3.2. Finite State Machines As an abstraction of sequential circuits we use a finite state machine (FSM). The probabilistic behavior of a sequential circuit is often analyzed using concepts of Markov chain (MC) theory, as described in [8,9]. A state transition graph that represents state transitions of the circuit, given input values, can be transformed into a discrete-parameter MC by attaching to each out-going edge of each state a label that represents the transition probability.
The transition probabilities of MC for a given circuit are calculated based on the input distribution characterizing the FSM. It is often required to determine the long-run behavior of MCs, that is, the limit state probability. For a given MC, the limit probabilities that exist for all states and do not depend on the initial state are called the steady-state probabilities.
3.3. BDD/ADD based modeling of SET propagation The framework in [2] captures all gate-output combinations, i.e., it determines the probability of a soft error at any output due to a fault originating at any internal gate. For each output Fj, initial duration dinit and initial amplitude ainit at the output of the gate hit by radiation, one can find mean error susceptibility (MES) as the probability of output Fj failing due to errors at internal gates: nf
MES ( Fjdinit , ainit ) =
nG
∑∑ P( F
j
fails | Gi fails ∩ init _ glitch = (d init , ainit ))
k =1 i =1
(1)
nG ⋅ n f
where nG is the cardinality of the set of internal gates of the circuit, {Gi} and nf is the cardinality of the set of probability distributions, {fk} associated to the input vector stream. For each gate Gi, dinit and ainit, one can find minimum, maximum, mean and median error impact over all outputs Fj that are affected by a glitch occurring at the output of gate Gi. Mean error impact (MEI) for gate Gi is defined as: nf
MEI (Gidinit ,ainit ) =
nF
∑∑ P( F
j
fails | Gi fails ∩ init _ glitch = (d init , ainit ))
k =1 j =1
nF ⋅ n f (2) where nF is the cardinality of the set of primary outputs of the circuit, {Fj}and nf is as in (1). Similarly, minimum, maximum and median error impact across all outputs and all output probability distributions can be found. For each input probability distribution used, the number of gates that do not affect any of the outputs is found as well. The probability of output Fj failing, P(Fj) can be defined using the MES metric and the SER for a given output can then be computed using the expression from [5] as: (3) SERF = P( F j ) ⋅ Reff ⋅ RPH ⋅ Acircuit j
where RPH is the particle hit rate per unit of area, Reff is the fraction of particle hits that result in charge generation, and Acircuit is the total silicon area of the circuit. Once P(Fj) is computed for every output (including state lines), one can use the error probability for the state lines to determine steadystate and time-dependent behavior of error propagation in the sequential circuit.
4. Circuit unrolling for SER analysis One obvious approach for analyzing the probabilistic behavior of sequential circuits is by using Markov chain theory. The problem with using this method for SER analysis is that soft error susceptibility analysis requires the knowledge of transient or time-dependent behavior of the circuit, while Markovian analysis is most suitable for evaluating steady-state behavior. Furthermore, it cannot include the effect of electrical and latching-window masking, and instead can model only logical masking, unless information is available about the likelihood of a latched error in a state line after a particle hit. Finally, it becomes impractical for analyzing circuits with larger number of state lines, and thus exponentially larger number of states. One possible solution is to use
approximation techniques such as Monte Carlo simulation, but this can negatively affect the accuracy of the method. In order to estimate the probability of errors in sequential circuits in an efficient manner that captures both transient and steady-state effects while easily incorporating the joint impact of logical, electrical, and latching window masking, we use the symbolic framework presented in [2]. The circuit is unrolled k times (Fig. 2) and analyzed as having two main stages: STAGE I – 1st cycle, STAGE II – 2nd to kth cycles (sub-stages). The probability of error at each output and each next-state line in STAGE I is then found using the model in [2] that we described in Section 3.3. In STAGE II, the logic of sub-stages 2 to k is lumped into a single logic circuit for which soft error analysis can be performed again using the techniques described in Section 3.3. STAGE II logic will have (k-1) times more inputs and (k-1) times more outputs. We can then find the probability of error for each pair (state line – output), that is, the probability that the wrong value is latched at the output, given that it occurred at state line. Since the analysis of the circuit that we convey is probabilistic in nature, we use initial input vector probability distribution for determining output error. The algorithm for this method is given in Fig. 3 (top).
or fanout transistors all defining the amount of critical charge required to trigger a change in the data state. Critical charge for technology nodes below 90nm decreases to 10fC [10]. One possible approach to increase the critical charge in a logic circuit would be to size all the gates over a range of particle energies. In this case, the charge collected due to the radiation hit cannot result in a SET. However, the overhead of such an approach in terms of area and performance is prohibitive. A more efficient solution is to selectively harden the most sensitive gates. We use the MEI metric (equation (2)) to determine the impact of individual gates on the error susceptibility of the circuit. From the MEI values per gate, one can determine which gates have largest impact on SER and resize them in order to decrease the SER. When the gate width-length ratio (W/L) is changed, the impact that radiation has on that gate is affected. In other words, if this ratio is larger, more charge needs to be generated by a radiation event, so as to result in a glitch of a magnitude larger than the switching threshold of that gate. The voltage Vout at the output of the gate can be found by solving the following differential equation [7]:
5. Gate resizing for circuit hardening
Ctotal ⋅
When a high-energy charged particle passes through a semiconductor material, it frees electron-hole pairs along its path as it loses energy. A total path length that the particle travels, until it comes to rest, is referred to as the particle’s range. The term linear energy transfer (LET) is often used to describe the energy loss per unit path length of a particle as it passes through a material. In silicon, an LET of 97 MEVcm2/mg corresponds to a charge deposition of 1pC/um [3]. Charge collection generally occurs within a few microns of the junction. The magnitude of the collected charge depends on a complex combination of factors: the size of the device, biasing of the various circuit nodes, substrate structure, device doping, the type of ion, its energy and trajectory, the initial position of the event within the device and the state of the device. The collected charge for the radiation-induced events in silicon can range from 1 to several 100 fC [3]. The device sensitivity to this excess charge is defined primarily by the node capacitance, operating voltages, the strength of feedback
where Ctotal is the total capacitance at the output of the gate hit by radiation, Iin(t) is the current pulse that resulted from the collection of charge induced by radiation (modeled as in [7]) and ID(Vout) is the effective drain current that drives the output of the gate. It has been shown before that, in the case of combinational circuits, resizing the gates with large error impact has a beneficial effect on SER. The three major design constraints, area, power consumption and delay, are all affected by the sizing of transistors. The radiation hardening approach proposed in this work is applied only to the nodes that have the highest soft error impact, that is, the nodes that contribute the most to the soft error failure rate of the logic circuit. This decreases the area overhead when compared to the approach where all gates are hardened. From the gate delay perspective, the effects of sizing a gate are not localized, since other gates are affected as well. This is due to the fact that sizing changes not only the
dVout W = Iin (t) − ⋅ ID (Vout ) L dt
Fig. 2. k-times unrolled sequential circuit divided into two main stages: STAGE I and STAGE II. STAGE II is further subdivided i th i into k-1 sub-stages (PI : primary inputs of the i sub-stage, PO : th i th primary outputs of the i sub-stage, PS : present state of the i i th sub-stage, NS : next state of the i sub-stage, B: state line buffers). In STAGE I, all three masking effects (L, E, LW: logical, electrical and latching-window masking, respectively) are modeled, while in STAGE II only logical masking (L) needs to be considered. Fig. 3. The algorithm for STAGE I initial error probability and STAGE II final error probability computation using circuit unrolling (top) and the gate resizing algorithm (bottom).
drive strength of a gate, but also the input and output capacitances. As described in [11], the delay of a logic gate can be modeled as:
applying the resizing mechanism in Case 2 will be more effective. This is due to the fact that more gates will be resized in this case, leading to a lower overall SER. The gate resizing algorithm is given in Fig. 3 (bottom).
where κ is a constant characteristic of the fabrication process, R is the equivalent resistance of the part of the circuit (pulldown or pullup) that is turned on, Cout is the external capacitance driven by the circuit and Cp is the internal (or parasitic) capacitance driven by the circuit. Given an original gate for which R = Rorig, Cin = Cinorig and Cp = Cporig, we can describe its delay when its width is scaled by a factor α and length by a factor β as follows:
6. Experimental results
d = κ ⋅ R⋅ (Cout + C p )
d
new
= κ ⋅ R new ⋅ (Cout + C pnew )= κ ⋅ R new ⋅ Cinnew ⋅ =κ ⋅
R
orig
α
⋅β
⋅ (α ⋅ β ⋅ Cinorig )⋅
= κ ⋅ R orig ⋅ β 2 ⋅ Cinorig ⋅
Cout
α ⋅ β ⋅ C inorig
Cout
α ⋅ β ⋅ C inorig
+
new Cout C p + new new Cin Cin
+
α ⋅β⋅C α ⋅β⋅C
(4)
orig p orig in
C porig Cinorig
6.1. MEI and SER evaluation
If, for an inverter described with the same model, the equivalent resistance is R = Rinv, and input capacitance is Cin = Cinv, then the previous expression for gate delay can be written as: d
new
= κ ⋅ β 2 ⋅ R inv ⋅ Cininv ⋅
C orig R orig ⋅ Cinorig Cout p ⋅ + orig inv orig inv R ⋅ Cin α ⋅ β ⋅ Cin Cin
= κ ⋅ R inv ⋅ C ininv ⋅ β 2 ⋅
(5)
R orig ⋅ C orig R orig ⋅ C inorig Cout ⋅ + β 2 ⋅ inv pinv R inv ⋅ C ininv α ⋅ β ⋅ Cinorig R ⋅ Cin
As described in [11], we can define unit delay: τ = κ ⋅ Rinv ⋅ C inv , orig orig logical effort: g = R ⋅ C in , electrical effort: m = C out , R inv ⋅ C ininv Cinorig orig R ⋅ C , and thus write the gate delay as: parasitic delay: p = inv ininv R ⋅ C in 1 (6) new d = τ ⋅ β ⋅ g⋅ m ⋅ + β2 ⋅ p orig
α
In this section, we show the results of our symbolic model for seven sequential circuits, given different glitch durations and different sets of input probabilities. The technology used is 70nm, Berkeley Predictive Technology Model [12]. The benchmark circuits are chosen from ISCAS’89 suite. The symbolic modeling framework is implemented in C++, and run on a 3GHz Pentium 4 workstation running Linux. It was already shown in [2] that the symbolic framework is within 7% accurate and allows for up to 5000X speedup when compared to HSPICE detailed circuit simulation, thus in the sequel we only show time-dependent and average SER results for sequential circuits before and after gate resizing.
We use the previous expression to incorporate the changes in transistor sizes into the delay model used in the symbolic framework. This expression is derived under the assumption that gate sizing is symmetrical, that is, both pMOS and nMOS parts of a gate are scaled by the same factors α and β. In this work, we assume that β = 1 and α is at most equal to 8 such that the gates selected for resizing cannot be affected by the particles within a given energy range. According to (6), the delay of a resized gate will be affected by the parameter α and thus will decrease. It is important to note here that the input capacitance of the gate that is resized is changed such that the new value is: Cinnew = α ⋅ β ⋅ Cinorig For the fanin gates of the resized gate, this capacitance is part of the load capacitance Cout, and gate resizing will therefore affect the delay of fanin gates through the electrical effort m. To find the gates that have largest error impact, we compare their MEI with a given threshold. MEI values computed as in (2) represent the error impact of a gate at each sub-stage of the unrolled circuit. Therefore, as a criteria for resizing, we can choose either an average MEI of a gate across all sub-stages (STAGE I and all sub-stages of STAGE II – Case 1), or an MEI for STAGE I only (Case 2). Since for most benchmarks analyzed SER decreases fast within a few cycles,
The results for one small benchmark S444 (153 gates, 3 inputs) and one larger benchmark, S1196 (487 gates, 14 inputs) are presented in Fig. 4. As it can be seen from Fig. 4, both circuits converge to steady-state after five clock cycles after the hit. The only difference between these two circuits is the magnitude of SER. The allowed interval for the initial duration of the glitch is assumed to be (dmin,dmax) = (60,140)ps, while initial amplitude is in the range (amin,amax) = (0.8,1)V. Since for glitches smaller than 60ps all benchmark circuits (except for a few that have very small number of gates) have output error induced mostly by output gates and their fanin gates in STAGE I, we use this duration as the lower bound of our interval. Similarly, for glitches longer than 140ps, all benchmarks propagate almost all the glitches, and thus we use this as an upper bound. The RPH used is 56.5 m-2s-1, Reff is 2.2·10-5, and the total silicon area for each benchmark circuit is derived as a function of gate count. For most of the benchmark circuits, SER decreases very fast. However, in case of the circuit S208, it stays at about the same level for all ten clock cycles for which the circuit is unrolled. In this case, the number of cycles needed for the circuit to go back to a non-erroneous state is determined by the logic of the circuit and its capability to do logical masking, as well as by the number of state lines that can drive errors back to the circuit.
6.2. Gate resizing impact on SER We show in Fig. 5 and Fig. 6 the SER for several benchmark circuits before (baseline) and after gate resizing (threshold 0.2, 0.1, 0.05, 0.02, 0.01, 0.005 and 0.002 columns). Additionally, in Fig. 4 (right two charts) we show the impact of gate resizing in five cycles following the particle hit, for a threshold 0.002 (Case 1) for benchmarks S444 and S1196. As it can be seen from Fig. 4, gate resizing can have different impact on the overall circuit SER for different input probability distributions and the improvement in SER can range up to 90% in STAGE I. In Fig. 5, resizing is applied to gates whose MEI averaged across all stages (STAGE I and STAGE II) of an unrolled circuit is larger than a given threshold ranging between 0.002 and 0.2. The difference between the range of SER values for circuits in Fig. 4 and Fig. 5 is due to the fact that, in Fig. 4 only four distributions are
average bit SER [FIT]
original th 0.02
6.00E-04
th 0.2 th 0.01
th 0.1 th 0.005
th 0.05 th 0.002
5.00E-04 4.00E-04 3.00E-04 2.00E-04 1.00E-04 0.00E+00 s27
s208
s298
s444
s526
s1196
s1238
Fig. 5. Average bit SER for several benchmarks without and with gate sizing for several MEI thresholds (Case 1: MEI averaged across all stages).
Fig. 4. SER changes in circuits S444 and S1196 during five clock cycles for different input probability distributions without gate resizing (left charts) and with gate resizing (right charts).
used, as opposed to ten different distributions for Fig. 5. In Fig. 6, we show the results when the resizing is applied to gates whose MEI in STAGE I only is larger than a given threshold ranging between 0.005 and 0.2. Assuming that the charge induced by radiation and collected by gate is 60fC, we find the resulting current pulse and from HSPICE simulations, we determine the new W/L ratio. As it can be seen from the presented results, resizing can improve SER by as much as 80% for a threshold of 0.01 (for circuit S444). The results presented in Fig. 5 (Case 1) show that SER decreases monotonically with the decrease in resizing threshold, while in Fig. 6 (Case 2) this is not the case. There are two factors that contribute to this kind of a behavior. First, different gates in the circuit can have different impact on overall circuit error: some gates have MEI that decreases fast through sub-stages of the unrolled circuit, while for some gates MEI remains at about the same level. Thus, there are cases when one gate has higher STAGE I MEI than some other gate, but on average, the MEI of the first gate is smaller than the MEI of the second one. Second, when gates are resized in order to increase the critical charge, the gate delay is actually decreased and this affects the glitch attenuation. If the impact of the glitches originating at the resized gate is not significant, but the attenuation that this gate provides is important, it may happen that the overall circuit SER increases due to resizing. Since in Case 2 the order in which gates are chosen for resizing does not reflect the monotonicity in their average MEI, the SER increase for smaller thresholds is more emphasized. On the other hand, Case 2 allows for more gates to be resized leading to the faster decrease in SER. However, there is a tradeoff, since this also leads to higher area overhead. The area overhead varies for different glitch sizes and different benchmarks. For example, when the initial glitch is 60ps long, the number of gates resized is minimal and varies from 5.2% for benchmark S444 (threshold 0.005) to 38% for benchmark S27 (threshold 0.002) in Case 1, and 0.4% for benchmark S1238 (threshold 0.01) to 55% for benchmark S208 (threshold 0.005) in Case 2.
7. Conclusion In this paper, we presented a symbolic modeling methodology for modeling and reduction of the soft error susceptibility of a sequential circuit. We have demonstrated the efficiency of our method by applying it on a subset of
average bit SER [FIT]
6.00E-04
original th 0.02
5.00E-04
th 0.2 th 0.01
th 0.1 th 0.005
th 0.05
4.00E-04 3.00E-04 2.00E-04 1.00E-04 0.00E+00 s27
s208
s298
s444
s526
s1196
s1238
Fig. 6. Average bit SER for several benchmarks without and with gate sizing for several MEI thresholds (Case 2: MEI in the ST 1 stage).
ISCAS’89 benchmarks of various complexities. We have also shown that, by using the information obtained from the framework, we can resize the gates that have largest impact on circuit reliability, such that their impact is decreased and SER is improved with minimal area overhead.
8. References [1] S. Mitra, N. Seifert, M. Zhang, Q. Shi, and K. S. Kim. Robust System Design with Built-In Soft-Error Resilience. In IEEE Computer Magazine, Vol. 28, No. 2, pp. 43-52, February 2005. [2] N. Miskov-Zivanov, D. Marculescu. MARS-C: Modeling and Reduction of Soft Errors in Combinational Circuits. In Proc. of Design Automation Conference (DAC), pp. 767-772, July 2006. [3] R. C. Baumann. Soft Errors in Advanced Computer Systems. In IEEE Design and Test of Computers, Vol. 22, Issue 3, 2005. [4] G. Asadi and M. B. Tahoori. Soft Error Modeling and Protection for Sequential Elements. In Proc. of IEEE Symposium on Defect and Fault Tolerance (DFT) in VLSI Systems, pp. 463-471, October 2005. [5] N. Miskov-Zivanov and D. Marculescu. Soft Error Rate Analysis for Sequential Circuits. To appear in Proc. of Design, Automation and Test in Europe (DATE), April 2007. [6] P. Dodd. Basic Mechanisms and Modeling of Single-Event Upset in Digital Microelectronics. In Proc. of the IEEE Transactions on Nuclear Science, Vol. 50, No. 3, pp. 583-602, June 2003. [7] Q. Zhou and K. Mohanram. Cost-Effective Radiation Hardening Technique for Combinational Logic. In Proc. of International Conference on Computer-Aided Design (ICCAD), pp.100-106 , November 2004. [8] D. Marculescu, R. Marculescu, and M. Pedram. Trace-Driven Steady-State Probability Estimation in FSMs with Application to Power Estimation. In Proc. of IEEE Design, Automation and Test in Europe Conf. (DATE), February 1998. [9] G. D. Hachtel, E. Macii, A. Pardo, and F. Somenzi. Markovian Analysis of Large Finite State Machines. In Proc. of the IEEE Transactions on Computer-Aided Design of Integrated Circuits and Systems, Vol. 15, No. 12, pp. 1479-1493, December 1996. [10] P. Shivakumar, M. Kistler, S. W. Keckler, D. Burger, and L. Alvisi. Modeling the Effect of Technology Trends on the Soft Error Rate of Combinational Logic. In Proc. of International Conference on Dependable Systems and Networks, pp. 389-398, 2002. [11] I. Sutherland,B. Sproull and D. Harris. Logical Effort: Designing Fast CMOS Circuits. Morgan Kaufmann Publishers, Inc., pp.5-15, pp. 63-73,1999. [12] Berkeley Predictive Technology Model (BPTM): http://wwwdevice.eecs.berkeley.edu/~ptm.