Mathematical Modeling of Feed Rations Using Solver Software Ancuţa Simona ROTARU1, Mihai BENŢEA1, Ioana POP2, Anamaria VATCA*, Luisa ANDRONIE1
Faculty of Animal Science and Biotechnologies, University of Agricultural Sciences and Veterinary Medicine, 3-5 Mănăştur Street, 400372 Cluj-Napoca, Romania 2 Faculty of Horticulture, University of Agricultural Sciences and Veterinary Medicine, 3-5 Mănăştur Street, 400372 Cluj-Napoca, Romania * corresponding author:
[email protected] 1
Bulletin UASVM Animal Science and Biotechnologies 74(1)/ 2017 Print ISSN 1843-5262; Electronic ISSN 1843-536X DOI:10.15835/buasvmcn-asb: 12210
Abstract
Animal nutrition is a very large area of study where mathematical modeling is a success, as in many areas. In addition to shaping the main physiological processes underlying the farm animals yielding, the objective function optimization issue (i.e. total expenditure on fodder) arises both in terms of protein and vitamin’s intake of nutrients and in terms of their cost. Optimising feed rations through mathematical modeling monitors the amount of food an animal needs throughout the day, so that the objective function (also called goal function of efficiency function) be minimum or maximum depending on the problem requirements. In order to solve mathematical model one needs fodder varieties that are part of the fodder basis and this feed (in kg) must be purchased or produced, and the solving method we use is the Solver tool of Microsoft Office Excel software . In order to optimize the objective function one should observe the following restrictions concerning the provisioning of total feed expressed in nutrients: provisioningof the necessary fodder by groups of fodder, observing proportions in fodder structure by groups of fodder, complying with fodderplants culture technologies and taking into account the availability of land designated for the forage and fodder crops. The mathematical model consists of three parts: the system of restrictions, non-negativity conditions and objective function. This paper shows the effectiveness of the Solver IT tools in dealing with many linear programming issues, including the establishment of feed rations as ensuring a good and well balanced food in terms of nutrition ensures both a good maintenance of the animals and an increased production. Keywords: feed rations, mathematical models,objective function, optimization, Solver
INTRODUCTION
In order to implement a good nutrition it is necessary to be familiar with the nutrient requirements for different species and categories of animals. Necessary nutrients for animals is expressed by feed rations, i.e. the amount of nutrients an animal needs for a period of 24 hours, both for insurance and maintenance of vital functions and for obtaining various yields. (Mierliţă, 2008). The feed ration is the quantity of feed administered to one animal for 24 hours. The ration must correspond to the standard, both in terms of quantity and quality. Şara and Benţea
(2003) consider that in order to be adequate, a ration should simultaneously fulfil the following constraints (restrictions): • to observe economic criteria, i.e. that consists of fodder obtained as lower costs as possible; • to be complete, that is to cover the necessary nutrients for the animal. Nutrients must observe a certain ratio (ratio that contains nitrogenous substances as against the nonnitrogenous compounds known as protein ratio or nutrient ratio); • to be satiating, that is to give the animal the feeling of fullness (satiety);
22
ROTARU et al
• to be palatable (tasty), i.e. be composed of as many good quality feed as possible; • to be healthy, i.e. not contain food which is tainted, toxic or detrimental to animal health. Modeling biological, economic and technical processes emerged in the second half of the twentieth century. By modeling one means drawing of a complex process by retaining the components/constituents which are considered important by the author of modeling. The main advantages of modeling are the new possibilities for analysis and synthesis of the process undergoing modeling and information on its development in the future. Art of modeling is to achieve a reasonable compromise between reaching the proximity of the process undergoing modeling and the calculation volume the model simulating entails. (Ene and Ioaniţescu, 2006).
MATERIALS AND METHODS
In the animal husbandry and agriculture field the optimization models are most common. According to Micula (2000) an optimization model consists of three parts as follows: 1. The variables of the model are positive real numbers to be determined. Let’s have x1, x2, …,xn. There are models where these variables are positive integers, and may represent for instance the livestock in a farm. 2. The constraintsto the model are m equations and inequalities containing thevariablesx1, x2, …,xn.. The right of each member is the resource limit restrictions addressed by restriction. This part of the mathematical model is also known as the system of restrictions.
3. The objective function contains the decision variablesx1, x2, …,xnand must be maximized/ minimized or otherwise optimized. A system of positive values for x1, x2, …, xn which meets the restrictions is called a possible solution, and those possible solutions that optimize the objective function are called the optimal solution. SOLVER is an Excel tool used in solving and reoptimization of linear programming problems. The method for solving linear programming is called “Simplex algorithm”, which is programmable and for which there is a lot of software products (such as Matlab, Maple). One of these products is the Solver tool within Excel software. Solver tools is not active when installing Exceland it is launched from the menu File/Options/Add-Ins, with a click on the “Go” button and a check on Solver option in the subsequent window (Pop, 2014). For livestock, fodder is classified into the following groups: fibber fodder (hay, green mass), roughage (straws, corncobs), concentratefodder (pulses and oilseeds), succulent fodder (roots, tubers, fruits), waste (bran), animal and mineral originfeed. These feed contains nutrients such as: dry matter (DM) in kg, nutrient units (NU), digestible protein (DP) - g, calcium (Ca) - g, phosphorus (P) - g, carotene - mg. Each animal by breed, group and subgroup has certain daily unitary nutritional needs. The analysis reports of animal nutrition laboratories containsthe nutritional contents per kg for each animal breed, group and subgroup.
RESULTS AND DISCUSSIONS
In this paper we designed the mathematical model and carried out its implementation in Solver tool for cattle breed, lactating cows group. For
Tab. 1. Data needed to develop an optimal feed ration for a cow weighting 500 kg * Fodder Resources DM NU DP MIN limit (kg) MAX limit (kg) Income (RON) Costs (RON)
Lucerne hay 0.84 0.48 122 10 15 0.72 0.52
Corn silage 0.25 0.25 9 15 25 0.30 0.20
Beet 0.13 0.12 10 10 15 0.24 0.18
Wheat bran 0.86 0.77 108 1 3 0.80 0.60
Daily nutritional 15.2 kg 11.7 NU 1,020 g
Ration mass 40 kg MAX ≥ RON 12 ≤ RON 12
* Data were retrieved and processed from the website of the Ministry of Agriculture and Rural Development – MADR, Minister’s Order no. 865/2014 for the approval of the nutritional composition of the main fodder used in feed for cows, buffaloes, sheep and goats (http:// www.madr.ro)
Bulletin UASVM Animal Science and Biotechnologies 74(1) / 2017
23
Mathematical Modeling of Feed Rations Using Solver Software
lactating cows of 500 kg and an output of 15 litters of milk/day (4% fat) there are daily nutritional requirements by fodder in thecold season which are distributed as in Table 1. In addition to dry matter, digestible protein and nutrient units, daily feed should also contain Ca (69 g), P (49 g), Carotene (375 g) and salt (53 g). Income from fodder is obtained by converting in RON the value of livestock production offered
by the animal in question consumption of 1 kg of feed, and costs are obtained by summing the costs with production (purchase), transportation, storage and feeding 1 kg of fodder to animals. In order to design the mathematical model let’s have x1 the amount of hay (alfalfa), x2 corn (silage), x3 beet and x4 bran (wheat), all the amounts above being measured in kg. For each animal breed there is a range comprising the minimum and maximum
Tab. 2. Linear models for optimizing feed rations Linear model with maximum income
Linear model with minimum costs
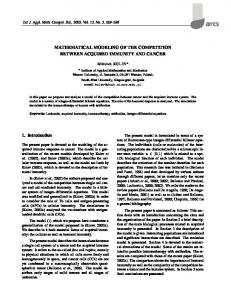
Fig 1.Solver corresponding window
Bulletin UASVM Animal Science and Biotechnologies 74(1) / 2017
24
ROTARU et al
amount of feed consumed by that animal during one day. Therefore, in the case of breed cattle these quantities are defined as follows: 10 ≤ x1 ≤ 25, 15 ≤ x2 ≤ 25, 10 ≤ x3 ≤ 15, 1 ≤ x4 ≤ 3 The mathematical model that was optimized in both cases is given in Table 2 below. “I” addresses the determination of fodder quantities (x1, x2, x3, x4) so that the objective function is maximized and “II” sets these amount so that the costs of fodder be minimal. The first four and last four restrictions in both models refer to the lower and higher limits respectively in terms of fodder quantities. The fourth requirement relates to the daily ration which should not exceed 40 kg.
The sixth restriction establishes feed costs that should be less than or equal to RON 12 in the case “I”, while in the case “II”the income from feed should be greater than orequal to RON 12. The following three restrictions relate to resources of DM, NU, DPwhich should contain at least 15.2 kg DM, 11.7 NUand 1,020g DP. Objective function optimum is a sum of products between the income coefficients/ costs coefficients and solution, depending on the requirements of the problem. One prepares an Excel spreadsheet with all data. At the beginning we mark the x1, x2, x3, x4 as zero value. Constraintscolumn contains SUMPRODUCT function which is a sum of products
It is noted that the daily ration for a lactating cow of 500 kg with a daily outcome of 15 l/day when one seeks for the maximization of income is as follows: x1 = 11.875 kg hay, x2 = 17.125 kg corn, x3 = 10 kg beet, x4 = 1 kg bran. Maximum value of objective function is RON 16.88.
Fig.2.Spreadsheet with the data required to calculate the objective function (MAX) and solutions
The daily ration for a 500 kg lactating cow with a daily production of 15l/day when one seeks for minimization of costs is as follows: x1 = 10 kg hay, x2= 15 kg corn, x3 = 10 kg beet, x4 = 2.53 kg bran. Minimum value of objective function is Ron 11.51.
Fig.3. Spreadsheet with the data required to calculate the objective function (MIN) and solutions
Bulletin UASVM Animal Science and Biotechnologies 74(1) / 2017
Mathematical Modeling of Feed Rations Using Solver Software
between the coefficient line and the solution line, for example F2 = SUMPRODUCT (B2: E2; B17: E17). SOLVER tool is launched in the menu Data/ Solver resulting window shown in Fig.1, where: Set Objective contains the cell with the optimum value of efficiency function, in this case, B18; To – the maximum or minimum of function, in our example Max; By Changing Variable Cells - cells that will change, i.e. cells corresponding to basic solution, their initial value being 0, B17: E17. In the Subject to the Constraints area systems restrictions were entered using the Add button. Once all restrictions were entered one returns to the original window, where Make Unconstrained Variables Non-Negative option is ticked because the condition is that all the variables be positive, and in the Select a Solving Method one ticks Simplex LP. These options are validated with Solve button.
25
CONCLUSIONS
Mathematical modeling is a very powerful and flexible tool that finds applicability in many fields. This paper shows how the SOLVER tools of Excel software is used easily for complex optimization problems, specifically for optimizing feed rations for cattle group, lactating cows subgroup, taking into account both the need of nutrients and total costs. The complexity of this software is given by the fact that it is able to solve problems where there are a large number of unknowns and restrictions.
REFERENCES
1. Ene D, Ioaniţescu E (2006). Cercetari operaţionale în agricultură, USAMV-ID, 2006 2. Micula M (2000). Matematici aplicate. Digital Data Printing house, Cluj-Napoca.
3. Mierliţă D (2008). Nutriţia animalelor domestice. AcademicPres Printing house, Cluj-Napoca: 3 -10. 4. Pop I (2014). Informatică aplicată-îndrumător de lucrări practice. Risoprint Printing house, Cluj-Napoca. 5. Şara A, Benţea M (2013). Alimentaţia animalelor – 2nd edition. Risoprint Printing house, Cluj-Napoca:9 – 15. 6. http://www.madr.ro/
Bulletin UASVM Animal Science and Biotechnologies 74(1) / 2017