Sep 12, 2011 - In this paper, we present a new multiple instance learning (MIL) method, called ... Since the instance labels in positive bags are unknown, a MIL.
arXiv:1109.2388v1 [cs.LG] 12 Sep 2011
MIS-Boost: Multiple Instance Selection Boosting
Emre Akbas Bernard Ghanem Narendra Ahuja Department of Electrical and Computer Engineering Computer Vision and Robotics Lab Beckman Institute for Advanced Science and Technology University of Illinois at Urbana-Champaign, IL USA 61801 {eakbas,bghanem2,ahuja}@vision.ai.uiuc.edu
Abstract In this paper, we present a new multiple instance learning (MIL) method, called MIS-Boost, which learns discriminative instance prototypes by explicit instance selection in a boosting framework. Unlike previous instance selection based MIL methods, we do not restrict the prototypes to a discrete set of training instances but allow them to take arbitrary values in the instance feature space. We also do not restrict the total number of prototypes and the number of selected-instances per bag; these quantities are completely data-driven. We show that MIS-Boost outperforms state-of-the-art MIL methods on a number of benchmark datasets. We also apply MIS-Boost to large-scale image classification, where we show that the automatically selected prototypes map to visually meaningful image regions.
1
Intoduction
Traditionally, supervised learning algorithms require labeled training data, where each training instance is given a specific class label. The performance and learning capability of such algorithms are impacted by the correctness of these instance labels especially when they are obtained through human interaction. In some applications (e.g. object detection, semantic segmentation, and activity recognition), ambiguities in human labeling may arise (e.g. when detection bounding boxes are not accurately sized or positioned). Traditional supervised learning methods cannot easily resolve these label ambiguities, which are inherently handled by multiple instance learning methods. These latter methods are based on a significantly weaker assumption about the underlying labels of the training instances. They do not assume the correctness of each individual instance label, yet they assume label correctness at the level of groupings of training instances. Multiple instance learning (MIL) can be viewed as a weakly supervised learning problem where the labels of sets of instances (known as bags) are given, while the labels of the instances in each bag are unknown. In a typical binary MIL setting, a negative bag contains instances that are all labeled negative, while a positive bag contains at least one instance labeled positive. Since the instance labels in positive bags are unknown, a MIL classifier seeks an optimal labeling scheme for the training instances so that the resulting labels of the training bags are correct. Due to their ability to handle incomplete knowledge about instance labels of training data, MIL methods have gained significant attention in the machine learning and computer vision communities. In fact, the MIL learning framework manifests itself in numerous applications that span from text categorization [1] and drug activity recognition [2] to many vision applications, where an image (or video) is represented as a bag of instances (interest points, patches, or image segments), only a subset of which are meaningful for the task in question (e.g. image classification). Recently, it has been shown that MIL methods can achieve state-of-the-art performance in a multiplicity of vision applications including content-based image retrieval [3, 4, 5], image classification [6, 7, 8], activity recognition [9], object tracking [10, 11], object detection [12, 13], and image segmentation [14]. In fact, label ambiguity and incompleteness lead to significant challenges in the MIL framework, 1
especially when positive bags are dominated by negative instances (e.g. an image of an airplane dominated by patches of sky). It is not surprising to see empirical evidence that the use of traditional supervised learning methods in MIL problems often leads to reduced accuracy [15]. Consequently, much effort has been done to develop effective learning methods that exploit the structure of MIL problems. We will give a brief overview of the most recent and popular MIL methods next. Related Work During the past two decades, many MIL methods have been proposed with a significant interest in MIL emerging in recent years especially within the machine learning and vision communities. The work in [16] is one of the earliest papers that address the MIL problem, whereby it was cast in the framework of recognizing hand-written numerals. Over the next twenty years, MIL literature has abound with algorithms that differ in two main respects: (1) the level at which the labeling is determined: instance-level (bottom-up) or bag-level (top-down) and (2) the type of data modeling assumed, i.e. generative vs. discriminative. (1). Bottom-up vs. Top-down: While most MIL approaches address the problem of predicting the class of a bag directly without inferring the labels of the instances that belong to this bag, some approaches use max margin techniques to do this inference [1, 17, 18]. The latter approaches exploit the fact that the instances of negative bags have negative labels (−1) and at least one instance in each positive bag has a positive label (+1). For example, a MIL version of SVM is proposed in [1], where the traditional SVM optimization problem is transformed into a mixed-integer program and subsequently solved by alternating between solving a traditional SVM problem and heuristically choosing the positive instances for each positive bag. (2). Generative vs. Discriminative: Some MIL approaches are generative in nature, since they assume that the underlying instances conform to a certain structure. An early generative approach is based on finding an optimal hyper-rectangle discriminant in the instance space [2]. Other prominent generative MIL approaches are based on the notion of diverse density (DD) [19]. These approaches seek a “concept” instance1 that is close to at least one instance of each positive bag and far away from all the instances in the negative bags. In other words, a concept instance is a vector in instance space that best describes the positive bags and discriminates them from the negative bags. The existence of such a concept assumes that positive instances are compactly clustered and well separated from negative instances. Such an assumption is strict and does not always hold in natural data, which tends to be multi-modal. DD-based MIL approaches compute this optimal concept by formulating the problem in a maximum likelihood framework using a noisy-OR model of the likelihood. Improvements on the original DD formulation have been made, where the EM algorithm is used to find the concept instance in [3] and multiple concepts are estimated in [20]. Moreover, standard supervised learning techniques, such as kNN, linear and kernel SVM, AdaBoost, and Random Forests, have been adapted to the MIL problem, thus, leading to citation kNN [21], MI-kernel [22], MIGraph/miGraph [6], mi/MI/DD-SVM [1, 23], MI-Boost [24], MI-Winnow [4], MI logistic regression [25], and most recently MIForests [11]. Furthermore, some MIL approaches actively seek instances in the training set (denoted prototypes) that carry discriminative power between the positive and negative classes. In what follows, we will denote these as instance selection MIL methods. Such approaches transform the original feature space into another space defined by the selected prototypes (e.g. using bag-to-instance similarities) and subsequently apply standard supervised learning techniques in the new space. In [7], all training instances are selected to be prototypes, while only one instance per bag is systematically initialized, greedily updated, and selected in [26, 6]. Our proposed instance selection method (dubbed Multiple Instance Selection Boost or MIS-Boost) is inspired by the instance selection MIL methods mentioned above (e.g. MILES [7, 8] and MILIS [6]) and the MI-Boost algorithm in [24]. It was hinted earlier that instance selection MIL methods comprise two fundamental stages. (i) In the representation stage, the original training bags are represented in a new feature space determined by the selected prototypes. (ii) In the classification stage, a supervised learning technique is used to build a classifier in the new feature space to optimize a given classification cost. Most of these methods treat the two stages independently and sequently, in such a way that representation (i.e. prototype selection) is unaffected by class label distribution. Here, MILIS is an exception, since it iteratively selects prototypes from the training set to minimize 1
This instance does not have to be one of the instances in the training set.
2
classification cost. This selection is further restricted, since only one prototype is selected per training bag. We consider this to be a restriction because we believe that the prototype selection process should be data dependent. For example, in the case of image classification, some “simple” object classes (e.g. airplane) may yield a smaller number of prototypes than other more “complex” classes (e.g. bicycle). As compared to previous methods, prototypes selected by MIS-Boost do not necessarily belong to the given training set and the number of these prototypes is not predefined, since they are determined in a data-driven fashion (boosting). Since the search space for prototype instances is no longer limited, more discriminative and possibly fewer prototypes can be learned. This learning process directly involves minimization of the final classification cost. As such, MIS-Boost learns a new representation based on the estimated prototypes, in a boosting framework. This leads to an iterative algorithm, which learns prototype-based base classifiers that are linearly combined. At each iteration of MIS-Boost, a prototype is learned so that it maximally discriminates between the positive and negative bags, which are themselves weighted according to how well they were discriminated in earlier iterations. The number of prototypes is determined in a data-driven way by cross-validation. Experiments on benchmark datasets show that MIS-Boost achieves state-of-the-art performance. When applied to image classification, MIS-Boost selects prototypes that map to meaningful image segments (e.g. class specific object parts). In Section 2, we give a detailed description of the MIS-Boost algorithm including our proposed instance selection/learning method. We show that MIS-Boost achieves or improves upon state-ofthe-art results on benchmark MIL datasets and popular image classification datasets in Section 3.
2
Proposed Algorithm
Given a training set T = {(B1 , y1 ), (B2 , y2 ), . . . , (BN , yN )} where yi ∈ {−1, +1} ∀i, Bi represents the ith bag and yi its label, our goal is to learn a bag-classifier F : B → {−1, +1}. Each bag consists of an arbitrary number of instances. The number of instances in the ith bag is denoted by ni , so we have Bi = {~xi1 , ~xi2 , . . . , ~xini }, where each instance ~xij ∈ RN ∀i, j. We propose the following additive model as our bag classification function: M X
F (B) = sign
! fm (B) ,
(1)
m=1
where each fm (B), called a base classifier, is associated with a prototype instance ~pm ∈ RN . The function fm : B → [−1, 1] is a bag classifier, like F , and it returns a score between −1 and 1, which quantifies the “existence” of the prototype instance ~pm within bag B. The “existence” of ~pm within bag Bi is determined by the distance from ~pm to the closest region to ~pm within Bi , that is: D(~pm , B) = min d(~pm , ~xij ), j
(2)
where d(·, ·) is a distance function between two instances, which we take to be Euclidean. We denote D(·, ·) as the instance-to-bag distance function. Here, we note that this instance-to-bag distance is used in other instance selection MIL methods (e.g. MILES and MILIS); however, the prototype ~pm in these methods is restricted to a discrete subset of the training samples. By removing this restriction on ~pm and allowing it to take arbitrary values in RN , more discriminative and possibly fewer prototypes need to be learned. The function fm (·) computes the instance-to-bag distances first, and classifies the bags using these distances. Although fm (·) can take any suitable form, we opt to use the simple scaled and shifted sigmoid function, parameterized by β0 , β1 , and ~pm . fm (B) =
2 − 1, 1 + e−(β1 D(~pm ,B)+β0 )
(3)
Since F is an additive model, we use additive boosting to learn its base classifiers [27]. We call our algorithm multiple instance selection boosting, or MIS-Boost for short. One of the main reasons for 3
choosing boosting for classification is its ability to select a suitable number of prototypes, in a datadriven fashion. By performing cross-validation, not only does the classifier avoid overfitting on the training set, but it also automatically determines the number of base classifiers (i.e. the number of prototypes) needed to form F . Note that other instance selection methods predefine or fix the number of prototypes that are used. Among the many variants of boosting, we choose Gentle-AdaBoost for its numerical stability properties [27]. 2.1
Learning base classifier fm
At each iteration of Gentle-AdaBoost, a weighted least-squares problem must be solved (step 2(a), Algorithm 4 in [27]). In our formulation, the following error should be minimized:
arg min εm where εm = ~ pm ,β0 ,β1
N X
� wi yi −
i=1
�2
2 1 + e−(β1 D(~pm ,Bi )+β0 )
+1
(4)
Here, wi is the weight of the ith bag at the current iteration. The main difficulty in optimizing the cost function above is the fact that the instance-to-bag distance term D(~pm , B) involves the nondifferentiable “min” function. It is this same function that forces other instance selection methods (e.g. MILES and MILIS) to restrict the prototype search space to a subset of the training samples. For example, MILES considers all training samples as valid prototypes, thus, making learning the classifier (`1 SVM) significantly computationally expensive. On the other hand, MILIS takes a brute-force approach to prototype selection by greedily choosing one instance from each training bag as a valid prototype. Although selection is done so that an overall classification cost is iteratively reduced, this selection strategy highly restricts the feasible prototype space. To alleviate the problem of non-differentiability in our formulation, we replace “min” in D(~pm , Bi ) with a differentiable ˜ pm , Bi ). By approximation (known as “soft-min”) to form the soft-instance-to-bag distance D(~ setting α to a large positive constant, we have: ˜ pm , Bi ) = D(~pm , Bi ) ≈ D(~
ni X
πj d(~pm , ~xij ), where πj =
j=1
e−αd(~pm ,~xij ) ni X
.
(5)
e−αd(~pm ,~xik )
k=1
˜ pm , B) in Eq. (4) renders the cost function differentiable, allowing for Replacing D(~pm , B) with D(~ gradient descent optimization. However, it is not a convex cost function, so there is a risk of settling into undesirable local minima. To alleviate this problem, we allow for multiple initializations of ~pm . Preferably, these initialization points should be sampled from the entire instance feature space. For this purpose, we cluster all the training instances using k-means, and use the cluster centers as initialization points for ~pm . We minimize the cost in Eq. (4) using coordinate-descent. We start by initializing ~pm to a cluster center and optimize over the (β0 , β1 ) parameters. Then, we fix these parameters and optimize over ~pm . We iterate this procedure until convergence; that is, the difference between successive errors becomes smaller than a given threshold. The overall algorithm used to learn a base classifier is summarized in Algorithm 1. 2.2
Determining the number of base classifiers
As the number of base classifiers increases, Gentle-AdaBoost tends to overfit on the training data. In order to prevent this and determine the number of base classifiers automatically, we perform 4fold cross validation, whereby we randomly split the training data into 4 equal-size pieces and use 3 pieces for training and the rest for validation. We run the algorithm for a large number of base classifiers and pick the number which gives the least classification error on the validation set. We give the pseudo-code of MIS-Boost in Algorithm 2.
3
Experiments
In this section, we evaluate the performance of MIS-Boost on five different MIL benchmark datasets and two COREL image classification datasets. We compare our performance to those of the most 4
Algorithm 1 Learning fm (Pseudo-code for learning a base classifier) Input: Training set {(B1 , y1 ), (B2 , y2 ), . . . , (BN , yN )}, Weights wi , i = 1, 2, . . . , N , cluster centers {c1 , c2 , . . . , cK }, Error tolerance Tol. Output: Base classifier fm (x) // Initialize ~pm to each cluster center for ~p0m = c1 , c2 , . . . , cK do error(-1) ← ∞ (β00 , β10 ) ← arg min ε˜m |(~pm =~p0m ) {Fix ~pm and minimize over β’s} error(0) ← ε˜m (~p0m , β00 , β10 ) t←0 while |error(t + 1) − error(t)| ≥ Tol do t←t+1 ~ptm ← arg min~pm ε˜m |(β0 =β t−1 ,β1 =β t−1 ) {Fix (β0 , β1 ) and minimize over ~pm } 0 1 (β0t , β1t ) ← arg min ε˜m |(~pm =~pt−1 m ) error(t) ← ε˜m (~ptm , β0t , β1t ) end while Keep (~p∗m , β0∗ , β1∗ ) with the least error so far end for Set (~pm , β0 , β1 ) ← (~p∗m , β0∗ , β1∗ ), and output fm Algorithm 2 MIS-Boost (Pseudo-code for the MIS-Boost algorithm) Input: Training set {(B1 , y1 ), (B2 , y2 ), . . . , (BN , yN )}, maximum number of base classifiers M , number of clusters K Output: Classifier F (x) Cluster all instances, xij , i = 1, 2, . . . , N ; j = ni , into K clusters. Cluster centers are {c1 , c2 , . . . , cK }. Split the training set into train-set and validation-set. Weights wi ← 1/N for i = 1, 2, . . . , N , and F (x) = 0. for m = 1, 2, . . . , M do Learn a base classifier fm using the algorithm given in Algorithm 1. Update F (x) ← F (x) + fm (x), P Update wi ← wi e−yi fm (Bi ) and normalize weights so that wi = 1. Evaluate F (x) on the validation-set, compute validation-error(m). end for M ← arg minm (validation-error) �P � M Output F (x) = sign f (x) m i=1
recent and state-of-the-art MIL methods available for each dataset. In another experiment, we use MIS-Boost in a large-scale image classification task and visualize samples of the instances that are closest to the learned prototype(s). The results of this experiment suggest that the learned prototypes are not only discriminative but also visually meaningful, that is they are similar to the parts of image that are relevant for classification. 3.1
Benchmark MIL datasets
The drug activity prediction datasets, “Musk1” and “Musk2” described in [2], and the image datasets, “Elephant”, “Fox”, “Tiger” introduced in [1] have been widely used and have become standard benchmark datasets for MIL methods. For each dataset, we perform 10-fold cross validation and report the average per-fold test classification accuracy. This is the standard way of reporting results on these datasets. In all our experiments in this section and the two following sections, we set the number of clusters K = 100, and the maximum number of base learners, or prototypes, to M = 100. We report our results in Table 1, where we list the results of the most recent and state-of-the-art MIL methods. To the best of our knowledge, this table gives the most comprehensive comparison 5
Table 1: Percent classification accuracies of MIL algorithms on results are marked in bold fonts. Method Musk1 Musk2 Elephant MIS-Boost 90.3 94.4 89.0 MIForest[11] 85 82 84 MIGraph[28] 90.0 90.0 85.1 miGraph[28] 88.9 90.3 86.8 MILBoost[24] 71 61 73 EM-DD[3] 84.8 84.9 78.3 DD[23] 88.0 84.0 N/A MI-SVM[1] 77.9 84.3 81.4 mi-SVM[1] 87.4 83.6 82.0 MILES[7] 88 83 81 MILIS[29] 88 83 81 MI-Kernel[22] 88 89 84 AW-SVM[30] 86 84 82 AL-SVM[30] 86 83 79 MissSVM[18] 87.6 80.0 N/A
benchmark MIL datasets. Best Fox 80.0 64 61.2 61.6 58 56.1 N/A 59.4 58.2 62 62 60 64 63 N/A
Tiger 85.5 82 81.9 86.0 58 72.1 N/A 84.0 78.9 80 80 84 83 78 N/A
Table 2: Percent classification accuracies on the COREL-1000 and COREL-2000 datasets. Method COREL-1000 COREL-2000 MIS-Boost 84.2 70.8 MILIS[29] 83.8 70.1 MILES[7] 82.3 68.7 MIForest[11] 82 69
between MIL methods on the benchmark datasets. Clearly, MIS-Boost outperforms other methods in all datasets except the “Tiger” class. There, we have the second best accuracy with only a 0.5% difference with the top performing method, miGraph [28]. Among all the methods in Table 1, MISBoost is the most similar to MILES and MILIS, as they are also instance-selection-based methods. Except on “Musk1”, our algorithm significantly outperforms these two methods. We believe that this improvement is largely due to the fact that our method, in contrast to MILES and MILIS, does not restrict the prototypes to a subset of the training instances, as we discussed in Section 2.1. 3.2
COREL dataset
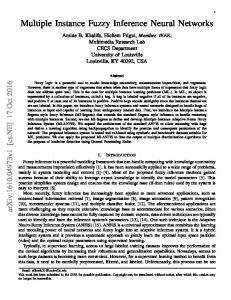
The COREL-2000 image classification dataset [7] contains 2000 images in 20 classes. COREL1000 is just a subset of this dataset, which contains the first 10 classes. We use the same features and experimental settings as in [7], and train one-vs-all MIS-Boost classifiers to deal with the multiclass case. The results of MIS-Boost and three most recent, state-of-the-art methods are given in Table 2. Our method outperforms the other methods on both datasets. To illustrate the data-driven nature of our algorithm, we give the number of prototypes learned per class in Figure 1. 3.3
PASCAL VOC 2007
The image categorization task of PASCAL VOC is inherently a MIL problem since the label of an image indicates the existence of at least one object of that label class within the image. However, to the best of our knowledge, no MIL results have been reported on this dataset. This is probably because of the large number of images (104 ) it contains. If we assume that each image has a few hundred instances, then the total number of instances is in the order of millions. Instance selection based methods like MILES would easily run into memory problems. In this section, we evaluate the performance of MIS-Boost on this large-scale image classification dataset, and visualize the selected instances, i.e. those instances that are closest to the learned prototypes to see if they overlap with the object(s) of interest. To this end, we run MIS-Boost on three selected classes from the dataset, “aeroplane”, “bicycle”, and “tvmonitor”. 6
COREL−2000 100
number of prototypes automatically learned
90 80 70 60 50 40 30 20 10 0
0
2
4
6
8
10 12 classes
14
16
18
20
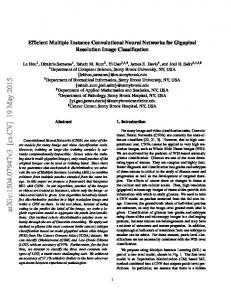
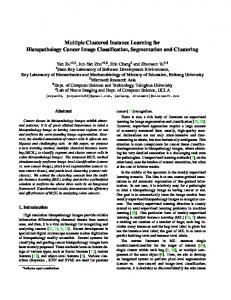
Figure 1: Number of base learners, or prototypes, per class as determined by MIS-Boost on the COREL-2000 dataset. To decide what type of instances (or features) to use, we did preliminary experiments with SIFT keypoint/descriptors [31] and regions obtained by the segmentation algorithm [32]. Regions gave better results (0.55 average-precision (AP))2 than the SIFT descriptors (0.38 AP) on the “aeroplane” class, so we decided to use regions. This dataset is not only huge but also unbalanced. The “aeroplane” class has 442 positive vs. 9518 negative; the “bicycle” class has 482 positive vs. 9458 negative; and “tvmonitor” has 485 positive vs. 9429 negative images (bags). This unbalancedness makes finding discriminative instances in the positive bags, among the clutter from the relatively large number of negative bags, quite challenging. MIS-Boost yields an average-precision (AP) score of 0.55 for the “aeroplane” class. This score is significantly below the state-of-the-art (e.g. 0.76 in [33]) on that dataset. We believe that this discrepancy is largely due to the fact that MIL methods do not model the context (or the background), while [33] and other similar approaches do so. Although the MIL approach seems to be the most appropriate one for the PASCAL dataset (given how the ground-truth is formed), these results suggest that the context/background information is highly discriminative. Another reason for the discrepancy might be the instance features we use, namely the segmentation might fail to capture the object or its parts. MIS-Boost yields an AP of 0.28 on “bicycle” (compared to 0.65 in [33]) and 0.36 on “tvmonitor” (compared to 0.52 in [33]). Next, we visualize the selected instances in each image that are closest to the learned prototypes. Figure 2 gives examples of true positives from the aeroplane class. On each image, we show the top three instances, i.e. regions, that are closest to the top 3 prototypes learned by MIS-Boost. These regions make the highest contribution to the correct classification of their images. Similarly, Figure 3 and Figure 4 present the same for the “bicycle” and “tvmonitor” classes, respectively. As one can observe from the images, the most discriminative regions usually overlap with the object of interest. Occasionally, some wrong instances are selected as shown in the lower-middle, and lowerright images of Figure 4. Apparently, the “tvmonitor” classifier learned square-shaped or frameshaped prototypes, and the window in the lower-middle image, and the door in the lower-right image are good selections for this prototype. We will make these challenging PASCAL datasets publicly available (online), in a MIL format, along with the code needed to visualize selected instances. We hope that these larger and more challenging datasets are used to compare MIL methods in the future.
4
Conclusion
We presented a new multiple instance learning (MIL) method that learns discriminative instance prototypes by explicit instance selection in a boosting framework. We argued that the following three design choices and/or assumptions restrict the capacity of a MIL method: (i) treating the prototype learning/choosing step and learning the final bag classifier independently, (ii) restricting the 2
This is the standard performance measure used in PASCAL VOC.
7
Figure 2: Example true positives from the “aeroplane” class (i.e. these images contain at least one instance of aeroplane). On each image, the three regions that are most similar to the top three prototypes learned by MIS-Boost are shown with yellow boundaries (Best viewed in color).
Figure 3: Example true positives from the “bicycle” class. See caption of Figure 2 for an explanation of the yellow boundaries (Best viewed in color).
8
Figure 4: Example true positives from the “tvmonitor” class. See caption of Figure 2 for an explanation of the yellow boundaries (Best viewed in color). prototypes to a discrete set of instances from the training set, and (iii) restricting the number of selected-instances per bag. Our method, MIS-Boost, overcomes all three restrictions by learning prototype-based base classifiers that are linearly boosted. At each iteration of MIS-Boost, a prototype is learned so that it maximally discriminates between the positive and negative bags, which are themselves weighted according to how well they were discriminated in earlier iterations. The number of total prototypes and the number of selected-instances per bag are determined in a completely data-driven way. We showed that our method outperforms state-of-the-art MIL methods on a number of benchmark datasets. We also applied MIS-Boost to large-scale image classification, where we showed that the automatically selected prototypes map to visually meaningful image regions.
References [1] S. Andrews, I. Tsochantaridis, and T. Hofmann, “Support vector machines for multipleinstance learning,” NIPS, pp. 561–568, 2003. [2] T. G. Dietterich, R. H. Lathrop, and T. Lozano-perez, “Solving the Multiple-Instance Problem with Axis-Parallel Rectangles,” Artificial Intelligence, vol. 89, pp. 31–71, 1997. [3] Q. Zhang and S. Goldman, “EM-DD: An improved multiple-instance learning technique,” NIPS, vol. 2, pp. 1073–1080, 2002. [4] S. Cholleti, S. Goldman, and R. Rahmani, “MI-Winnow: A New Multiple-Instance Learning Algorithm,” International Conference on Tools with Artificial Intelligence, pp. 336–346, 2006. [5] S. Vijayanarasimhan and K. Grauman, “Keywords to visual categories: Multiple-instance learning forweakly supervised object categorization,” CVPR, pp. 1–8, 2008. [6] Z. Fu, A. Robles-Kelly, and J. Zhou, “MILIS: Multiple Instance Learning with Instance Selection,” IEEE TPAMI, vol. 33, no. 10, pp. 1–20, 2010. [7] Y. Chen, J. Bi, and J. Z. Wang, “MILES: multiple-instance learning via embedded instance selection.” IEEE TPAMI, vol. 28, no. 12, pp. 1931–47, 2006. [8] J. Foulds and E. Frank, “Revisiting multi-instance learning via embedded instance selection,” Lecture Notes in Computer Science, 2008. [9] M. Stikic and B. Schiele, “Activity recognition from sparsely labeled data using multi-instance learning,” Location and Context Awareness, pp. 156–173, 2009. [10] B. Babenko, M.-H. Yang, and S. Belongie, “Visual Tracking with Online Multiple Instance Learning,” IEEE TPAMI, pp. 983–990, 2010. [11] C. Leistner, A. Saffari, and H. Bischof, “MIForests: Multiple-Instance Learning with Randomized Trees,” ECCV, pp. 29–42, 2010. 9
[12] P. Viola, J. C. Platt, and C. Zhang, “Multiple Instance Boosting for Object Detection,” in NIPS, 2007. [13] C. Zhang and P. Viola, “Multiple-instance pruning for learning efficient cascade detectors,” in NIPS, 2008. [14] A. Vezhnevets and J. Buhmann, “Towards weakly supervised semantic segmentation by means of multiple instance and multitask learning,” in CVPR, 2010, pp. 3249–3256. [15] S. Ray and M. Craven, “Supervised versus multiple instance learning: An empirical comparison,” in International Conference on Machine Learning, 2005, pp. 697–704. [16] J. Keeler, D. Rumelhart, and W. Leow, “Integrated segmentation and recognition of handprinted numerals,” in NIPS, 1990, pp. 557–563. [17] P.-M. Cheung and J. T. Kwok, “A regularization framework for multiple-instance learning,” International Conference on Machine Learning, no. 1, pp. 193–200, 2006. [18] Z.-H. Zhou and J.-M. Xu, “On the relation between multi-instance learning and semisupervised learning,” ICML, no. 1997, pp. 1167–1174, 2007. [19] O. Maron and T. Lozano-P´erez, “A framework for multiple-instance learning,” in NIPS, 1998, pp. 570–576. [20] R. Rahmani, S. a. Goldman, H. Zhang, S. R. Cholleti, and J. E. Fritts, “Localized content-based image retrieval.” IEEE TPAMI, vol. 30, no. 11, pp. 1902–12, 2008. [21] J. Wang and J. Zucker, “Solving the multiple-instance problem: A lazy learning approach,” in ICML, no. 1994, 2000, pp. 1119–1126. [22] T. Gartner, P. Flach, A. Kowalczyk, and A. Smola, “Multi-instance kernels,” in ICML, 2002, pp. 179–186. [23] Y. Chen and J. Wang, “Image categorization by learning and reasoning with regions,” JMLR, vol. 5, pp. 913–939, 2004. [24] P. Viola, J. C. Platt, and C. Zhang, “Multiple Instance Boosting for Object Detection,” in NIPS, 2007. [25] Z. Fu, “Fast multiple instance learning via l1, 2 logistic regression,” ICPR, pp. 1–4, 2008. [26] Z. Fu and A. Robles-Kelly, “An instance selection approach to Multiple Instance Learning,” in CVPR. IEEE Computer Society, 2009, pp. 911–918. [27] J. Friedman, T. Hastie, and R. Tibshirani, “Additive Logistic Regression: A Statistical View of Boosting,” The Annals of Statistics, vol. 28, no. 2, pp. 337–407, 2000. [28] Z.-H. Zhou, Y.-Y. Sun, and Y.-F. Li, “Multi-instance learning by treating instances as non-I.I.D. samples,” ICML, pp. 1–8, 2009. [29] Z. Fu, A. Robles-Kelly, and J. Zhou, “Milis: Multiple instance learning with instance selection,” IEEE TPAMI, pp. 958 – 977, Aug 2010. [30] P. Gehler and O. Chapelle, “Deterministic annealing for multiple-instance learning,” in Proc. of the 11th Int. Conference on Artificial Intelligence and Statistics, Meila, M., and X. Shen, Eds., March 2007, pp. 123–130. [31] D. G. Lowe, “Distinctive image features from scale-invariant keypoints,” IJCV, no. 2, pp. 91 – 110, 2004. [32] E. Akbas and N. Ahuja, “From Ramp Discontinuities to Segmentation Tree,” in Asian Conference on Computer Vision (ACCV’09). Xi’an, China: Springer, 2009, pp. 123 –134. [33] F. Perronnin, J. S´anchez, and T. Mensink, “Improving the Fisher Kernel for Large-Scale Image Classification,” in ECCV, vol. 6314. Springer Berlin / Heidelberg, 2010, pp. 143–156–156.
10