Apr 26, 2016 - biological mechanisms by which melanoma becomes resistant to the ..... killing of melanoma cells, tumor immune escape, and the intensity of systemic ..... without evasion mechanisms cannot survive in a context of high ...
www.nature.com/scientificreports
OPEN
received: 19 November 2015 accepted: 08 April 2016 Published: 26 April 2016
Model-based genotype-phenotype mapping used to investigate gene signatures of immune sensitivity and resistance in melanoma micrometastasis Guido Santos1,2,3, Svetoslav Nikolov1,4,5, Xin Lai1,2, Martin Eberhardt1,2, Florian S. Dreyer1,2, Sushmita Paul1,2, Gerold Schuler2 & Julio Vera1,2 In this paper, we combine kinetic modelling and patient gene expression data analysis to elucidate biological mechanisms by which melanoma becomes resistant to the immune system and to immunotherapy. To this end, we systematically perturbed the parameters in a kinetic model and performed a mathematical analysis of their impact, thereby obtaining signatures associated with the emergence of phenotypes of melanoma immune sensitivity and resistance. Our phenotypic signatures were compared with published clinical data on pretreatment tumor gene expression in patients subjected to immunotherapy against metastatic melanoma. To this end, the differentially expressed genes were annotated with standard gene ontology terms and aggregated into metagenes. Our method sheds light on putative mechanisms by which melanoma may develop immunoresistance. Precisely, our results and the clinical data point to the existence of a signature of intermediate expression levels for genes related to antigen presentation that constitutes an intriguing resistance mechanism, whereby micrometastases are able to minimize the combined anti-tumor activity of complementary responses mediated by cytotoxic T cells and natural killer cells, respectively. Finally, we computationally explored the efficacy of cytokines used as low-dose co-adjuvants for the therapeutic anticancer vaccine to overcome tumor immunoresistance. In many solid cancer types, the interaction between the tumor and the immune system is a key element governing critical steps in the tumor progression path1; its deep understanding is necessary to design efficient anticancer immunotherapies. In recent times, a number of published works suggest the use of a systemic approach combining quantitative experimental data and mathematical modeling to dissect the tumor-immune system interaction2,3. However, most of these modelling efforts focus on representing and simulating cell-to-cell processes and do not consider the intracellular networks controlling immune and tumor cells, thereby losing the chance to integrate and analyze omics data on the molecular events underlying the tumor-immunity interaction and the immune-based therapies. The immune system is by definition multi-scale because it involves complex biochemical networks that regulate cell fate across cell boundaries4, and also because immune cells communicate with each other by direct contact or through secretion of local or systemic signals3,6–8. Moreover, immune cells and cancer cells interact, and these interactions are affected by the tumor microenvironment. The complex nature of this tumor-immunity-microenvironment interaction favors and sometimes requires a systemic approach in its analysis2. 1
Laboratory of Systems Tumor Immunology, Friedrich-Alexander University of Erlangen-Nuremberg, Germany. Department of Dermatology and Erlangen University Hospital and Faculty of Medicine, Friedrich-Alexander University of Erlangen-Nuremberg, Germany. 3Systems Biology and Mathematical Modelling Group, University of La Laguna, Spain. 4Institute of Mechanics, Bulgarian Academy of Science, Sofia, Bulgaria. 5University of Transport, Sofia, Bulgaria. Correspondence and requests for materials should be addressed to J.V. (email: julio.vera-gonzalez@ uk-erlangen.de) 2
Scientific Reports | 6:24967 | DOI: 10.1038/srep24967
1
www.nature.com/scientificreports/ A systemic approach is able to combine quantitative experimental data, mathematical modeling and other methods from computational biology 7. In recent literature, several contributions have made use of this approach to dissect the tumor-immunity interaction9,10. The interplay between the tumor, the immune system and different types of therapies has been modelled in the last decade5,6,8,11, including a study that employed model simulations and patient data to predict the optimal timing and dosage for a therapeutic anticancer vaccination12. Although these models in some cases incorporate detailed descriptions of the underlying cell-to-cell communication, they do not take into account the intracellular networks governing immune or tumor cells. Thus, these models by design cannot take advantage of the large amount of omics data produced nowadays to provide molecular-level insights into immunotherapies and their assessment or re-engineering2. One option to overcome these limitations is to perform a model-based genotype-phenotype mapping in which model parameters are associated to gene ontology terms13. When trying to reconcile simulation results with experimental and clinical data, aggregation of the differentially expressed genes into metagenes will provide a means to connect omics data with model predictions. This is the approach we propose and explore in this paper. High-throughput data can be combined with mathematical modelling to assess the efficacy of anticancer therapies. For example, Hector et al.14 quantified apoptosis-regulating proteins in samples of colorectal carcinomas (stage II and III) and normal colonic tissue, and simulated apoptosis signaling to predict the efficacy of apoptosis-inducing therapeutics. Systems approaches have also been used for patient-data-based assessment of experimental immunotherapies. For example, Ulloa-Montoya et al.15 analyzed biopsy samples from metastatic melanoma patients and identified a pretreatment gene expression signature that can be used to predict the response to immunotherapy. In this paper we set up and characterized a kinetic model accounting for the interaction of the immune system with melanoma micrometastases as well as for the role of an immunotherapy in controlling and depleting them. It is important to highlight that the work will be focused on the simulation of distributed micrometastases instead of the dynamics of primary melanoma tumors. Here, the immunotherapy refers to treatments stimulating the adaptive immune response, like therapeutic vaccines which are based on melanoma antigens, or patient monocyte-derived dendritic cells loaded with antigens from primary tumor cells16. We combined mathematical analysis, systematic model simulations and statistical techniques to generate phenotypic signatures accounting for melanoma sensitivity and resistance to the inherent immune response and immunotherapy. In the context of this study, the term inherent immune response refers to the patient’s natural immune reactions without any artificial stimulus, while the immunotherapy refers to treatments like dendritic-cell or melanoma antigen vaccination. The phenotypic signatures were compared with metagene signatures derived from clinical data. The comparison not only confirmed the correlation of model predictions with clinical data, but it also allowed the mechanistic interpretation of the clinically derived metagene signatures underlying various biological processes. Furthermore, improvements in the therapeutic anticancer vaccination were proposed based on the model analysis. Taken together, our results highlight that mathematical models are useful tools for the assessment of tumor immunogenicity, and also that high-throughput data can be employed to detect key genes involved in the tumor-immune system interaction.
Materials and Methods
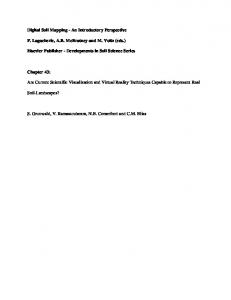
Overview of the methodology. The presented method makes use of mathematical modeling to a) infer
biological mechanisms explaining gene expression signatures obtained from clinical data and b) propose simulation result -based improvements in existing therapies. The workflow used was as follows (see Fig. 1 for a graphical illustration): 1. A mathematical model describing the biological system under investigation is derived and characterized using published data, and, when possible, model-driven experiments17; 2. The model parameters are systematically perturbed and simulations are performed for relevant biomedical scenarios; 3. According to the resulting simulated biological behavior, the model parameter sets are classified into groups. A statistical analysis of the model parameter sets extracted from those groups is used to obtain phenotypic signatures (e.g., patterns in the perturbed model parameter sets for each defined group); 4. Subsequently, clustering analysis is performed to obtain fine-grained signatures of subpopulations within each group. The features of these signatures are linked to the (de)regulation of given biological processes defined in the mathematical model; 5. Mathematical analysis is used to further investigate and define the gene signatures; 6. The genes in clinical signatures are annotated and grouped into metagenes. These metagenes represent genes with a similar gene ontology annotation in terms of the biochemical processes described in the model; 7. The clinical signatures are aggregated using the described metagenes; 8. Phenotypic signatures from the model are compared to metagene signatures from clinical data. Agreement between them allows a biological interpretation of the clinical signatures based on the identification of disrupted or deregulated biological processes. The derivation and calculation of the metagenes is presented in Gene annotation and Metagene grouping sections; 9. Analysis of additional simulation results are used to propose therapy improvements which must be validated in further experimental and clinical setups. In the following, the different elements of the procedure are discussed in detail.
Scientific Reports | 6:24967 | DOI: 10.1038/srep24967
2
www.nature.com/scientificreports/
Figure 1. Workflow of the study. Our goal was to generate phenotypic signatures and to compare them with signatures derived from patient data.
Mathematical model derivation. We used published knowledge and preexisting mathematical models
describing the interaction between the tumor and the immune system to derive a new simplified kinetic model based on nonlinear ordinary differential equations with time delay5,6,18 (Fig. 2). The model reflects the dynamics of cytotoxic T cells and tumor cells during the growth of melanoma micrometastases, as well as some features associated with the inherent and immunotherapy-induced immune response. It has the following structure: g
katg ⋅ M + V C (t ) 1 dT = kapc ⋅ 1 + k gir ⋅ V C (t ) ⋅ g g 1 dt k tapc + katg ⋅ M + V C (t ) 1
(
)
g2
+ katc ⋅ T ⋅
(katg ⋅ M) g g k tatc + (katg ⋅ M) 2
2
− kdtc [T 3 + k x ⋅ T 0.1 ⋅ T (t − τ dtc )0.9 ]
katg ⋅ M (HLA−1)nk dM = k pmc ⋅ M ⋅ (MT − M ) − kiap ⋅ T ⋅ − kink ⋅ M ⋅ 1 + kiev ⋅ M dt (knkc )nk + (HLA−1)nk
[1]
[2]
where T accounts for the population of cytotoxic T cells and M for the population of melanoma cells that compose a micrometastasis. In case of cytotoxic T cells, Equation [1] includes the first term accounting for the activation of
Scientific Reports | 6:24967 | DOI: 10.1038/srep24967
3
www.nature.com/scientificreports/
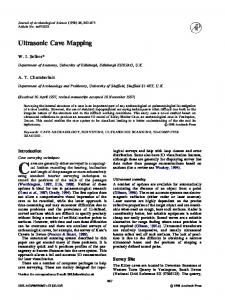
Figure 2. (A) Sketch representing the structure of the mathematical model derived to represent the interaction between a melanoma micrometastasis and the natural or therapy-mediated immune response. Parameters: kpmc – tumor proliferation rate; kiap – antitumor cytotoxic efficiency; katg – antigen presentation efficiency; kiev – immune evasion efficiency; kgir – global immune response efficiency; kdtc – depletion rate of activated cytotoxic T cells (fixed value) kapc – inherent immune response; tdtc – time delay; (B) The model can be used to simulate the kinetics of cytotoxic T cells (T) in a time-dependent manner and the growth of melanoma cells (M) under the corresponding immune stress (T(0) = 0; M(0) = 0.00081; nominal values for the model parameters). (C) Sketch of the immune therapy simulation used as described in Material and Methods section.
cytotoxic T cells by antigen-presenting cells as a result of a) the inherent immune response (kapc) or b) an immunotherapy, for example dendritic cell or antigen vaccination. The immunotherapy-mediated activation of naïve T cells is represented by a time-dependent input variable, Vc(t) (for details, see “Simulation of vaccine administration” below). An additional feature associated with the immunotherapy is the ability to promote a global unspecific immune response, which amplifies the process of cytotoxic cell activation (kgir).The efficacy of the cytotoxic T cell activation process is dependent on the amount of antigens (katg) presented by tumor cells (M) and follows a saturation dynamics represented by a Hill function with a Michaelis-Menten like parameter (ktapc)13 with exponent g1. The equation also includes a term accounting for the self-expansion of activated cytotoxic T cells upon interaction with tumor cells (katc) which follows a Hill function, with the corresponding Michaelis-Menten like parameter (ktatc) with exponent g2, and is proportional to the amount of antigens (katg) produced by the tumor cells (M). Finally, the equation includes a summand accounting for a biphasic depletion of activated cytotoxic T cells (kdtc). In this term, we included a fast third-order depletion term together with a slower, time-delayed one which accounts for the small fraction of activated cytotoxic T cells that have a longer lifespan (and represent memory T cells in a phenomenological fashion; for time delay estimation and previous kinetic model see19). By using this structure for the T cell depletion rate, our model is able to reproduce the basic features of the short-term and memory cytotoxic T cells dynamics with a single differential equation (Supp. Fig. S1). For the melanoma cells, Equation [2], the first rate term includes a logistic equation accounting for the self-limiting growth of the melanoma cell population (kpmc): we introduced this rate term under the assumption that the melanoma cells in the micrometastasis have not yet broken the blood vessel barrier and therefore achieve a maximum size represented by MT20. In addition, the model includes a term accounting for the T cell and NKC-mediated killing of melanoma cells on the second and third term respectively (kink ≈ 0.02·kiap). In our model, the strength of this process is proportional to the level of antigen presentation (katg) of the tumor cells M. In addition, we also consider the possibility that the melanoma cells could evolve an immune evasion strategy, thereby reducing the efficiency of T cell-mediated recognition and killing (kiev). The final Hill kinetics term, which features the Michaelis like constant knkc and the exponent gnk, accounts for the activation of natural killer cells (NKCs) by tumor cells that exhibit low levels of human leukocyte antigen (HLA) complexes on the cell surface, and for the ability of activated NKCs to target the tumor cells for killing. HLA accounts for the plasma membrane levels of HLA complexes, which is assimilated for simplicity into the model parameter katg (HLA ≈ katg). This model can be used to simulate the evolution of specific cytotoxic T cell (T) populations in a time dependent manner and the behavior of melanoma cells (M) under distinct immune-related scenarios (Fig. 2B). We point out that the derived kinetic model features a combination of mass-action, Hill kinetics and power-law terms, a strategy previously used to model complex regulatory processes in simplified model equations13,21,22. The values of the rate parameters were assigned by surveying published information. For example, the half-life of cytotoxic T cells was used to characterize kdtc. Also, ktapc and g1 were estimated to induce a sigmoidal APC (antigen presenting cell)-mediated cytotoxic T cell response within the interval of feasible values of the model variables. Alternatively, we reduced some parameters by normalization (e.g., normalizing the expression level of melanoma antigen presentation such that it is equal to 1 in the nominal version of the model). Model parameter values and further explanations are provided in Supplementary Table S1. Scientific Reports | 6:24967 | DOI: 10.1038/srep24967
4
www.nature.com/scientificreports/ Model simulations. To search for phenotypic signatures accounting for sensitivity or resistance of mela-
noma cells to inherent and immunotherapy-supported immune responses, we randomly perturbed the values of biologically relevant model parameters using the Latin hypercube sampling method in the logarithmic space. The parameters chosen account for tumor cell proliferation, antigen presentation, efficiency of T cell-mediated killing of melanoma cells, tumor immune escape, and the intensity of systemic immune responses induced by the immunotherapy (respectively kpmc, katg, kiap, kiev, and kgir). The parameter kpmc was perturbed in the interval [1, 5]. The upper bound corresponds to with a duplication time of approx. 12 hours for an nominal population M = 0.3. The lower bound was fixed to 1: preliminary simulations indicated that values of kpmc below initial value did not satisfy the conditions for tumor growth. The parameters katg, kiap, kiev, and kgir account for a rather complex aggregation of biological parameters and therefore they were perturbed in the wider interval [0.02 50]. Thereby, we generated 104 solutions, each one with a distinct set of parameter values. For each combination, we performed simulations in three scenarios relevant for describing the interaction between the tumor micrometastasis and the immune system: scenario 1) non-immunogenic tumor growth conditions (M(0) = 0.00081, which represents an initiating tumor cell cluster of 30 cells, T(0) = 0, no pre-existing T cell response, kapc = 0, Vc(t) = 0); scenario 2) inherent antitumor immune response (M(0) = 0.00081, T(0) = 0, kapc = 0.04, Vc(t) = 0); and scenario 3) immunotherapy-supported (vaccine) antitumor immune response (M(0) = 0.00081, T(0) = 0, kapc = 0.04, Vc(t) = Fvac(t)). Based on exploratory clinical results (data not shown), vaccine administration was simulated by introducing a step-like time-dependent function Fvac(t) simulated during six subsequent periods of 180 days, with the following structure: Fvac(t) = 1 if 0