Automated Software Engineering manuscript No. (will be inserted by the editor)
Model-Driven Reverse Engineering of Legacy Graphical User Interfaces ´ Oscar S´ anchez Ram´ on · Jes´ us S´ anchez Cuadrado · Jes´ us Garc´ıa Molina
Received: date / Accepted: date
Abstract Businesses are increasingly beginning to modernize those of their legacy systems that were originally developed with Rapid Application Development (RAD) or Fourth Generation Language (4GL) environments, in order to benefit from new platforms and technologies. In these systems, the Graphical User Interface (GUI) layout is implicitly provided by the position of the GUI elements (i.e. coordinates). However, taking advantage of current features of GUI technologies often requires an explicit, high-level layout model. We propose a Model-Driven Engineering process with which to perform the automatic reverse engineering of RAD-built GUIs, which is focused on discovering the implicit layout, and produces a GUI model in which the layout is explicit. As an example of the approach, we apply an automatic reengineering process to this model in order to generate a Java Swing user interface. Keywords Graphical User Interfaces, layout, modernisation, Model Driven Engineering, Reverse Engineering, Reengineering. ´ Oscar S´ anchez Ram´ on Facultad de Inform´ atica, Campus de Espinardo, 30100, Murcia, Spain Tel.: +34-868-884311 Fax: +34-868-884151 E-mail:
[email protected] Jes´ us S´ anchez Cuadrado Escuela Polit´ ecnica Superior, Universidad Aut´ onoma de Madrid, Francisco Tom´ as y Valiente, 11, 28049, Madrid, Spain Tel.: +34-91-4972222 E-mail:
[email protected] Jes´ us Garc´ıa Molina Facultad de Inform´ atica, Campus de Espinardo, 30100, Murcia, Spain Tel.: +34-868-884311 Fax: +34-868-884151 E-mail:
[email protected]
2
´ Oscar S´ anchez Ram´ on et al.
1 Introduction Most information systems dating from the 90’s were built using Rapid Application Development (RAD) environments. The RAD methodology appeared in the early 90’s as a response to the non-agile development processes that existed (Martin, 1991), and a number of integrated environments supporting third and fourth generation languages also appeared. Oracle Forms, Visual Basic or Delphi are well-known examples of RAD environments. They reduce development time by facilitating GUI design and coupling data access to graphical components. However, the evolution of these applications was hindered in the long term since bussiness logic tended to be mixed with GUI logic. This has motivated a large number of businesses to migrate their RAD legacy systems to new platforms (typically Web platforms), which better meet their needs of extensibility, maintainability or distribution, among others. Another reason for this migration is that some vendors are increasingly ceasing support in favour of other platforms. Reengineering is a form of modernisation that consists of the systematic transformation of an existing system into a new form in order to allow quality improvements to be made to several aspects of a legacy system (Tilley and Smith, 1995). This transformation involves a three-stage process to create the new system: reverse engineering, restructuring, and forward engineering (Chikofsky and Cross, 1990). A migration is a special case of reengineering in which a legacy software system is moved from one technology to another. In this paper we shall focus on the migration of GUIs built with a RAD environment. Migrating a legacy application to a new technology necessitates tackling three main aspects: data access, bussiness logic and graphical user interface (GUI). Various works have dealt with the migration of RAD-based legacy systems (Harrison and Lim, 1998; Andrade et al, 2006), but user interface migration has been typically regarded as a straightforward topic, in which the only concern is to establish mappings between widgets of the source and target technologies. However, dealing with current technologies and devices requires a thorough analysis of the user interface so that it can be suitably reengineered. Notably, reverse engineering the layout of the user interface (i.e. obtaining an explicit model from the spatial relationships among widgets) is crucial if subsequent reengineering activities are to be accomplished. Model Driven Engineering (MDE), meanwhile, has arisen as a new software development paradigm in which models, which are abstract representations of aspects of software systems, drive the whole development process. In this setting, model transformations are used to convert models between different levels of abstraction, which enables automation. MDE techniques are not only applicable to the creation of new applications, but can also be used to evolve existing systems by automating evolution activities, such as reverse engineering. Layout is the sizing, spacing, and placement of content within a window, which is a key aspect in GUI design. In this paper, we explore the concerns
Model-Driven Reverse Engineering of Legacy Graphical User Interfaces
3
involved in discovering layout relationships among user interface elements. We focus on GUIs built with RAD environments, in which the layout is implicitly represented by means of the explicit position of widgets. A set of algorithms to reverse engineer the layout is shown, so that an explicit layout model is obtained. These algorithms are the core of our MDE framework for reengineering GUIs built with RAD environments, which is also presented in this work. The reverse engineering stage of the proposed framework uses models to represent the information gathered and a model tranformation chain to automate the process of generating a layout model. The approach is reusable for different legacy source platforms and target platforms, i.e., it is independent of the platform. We have evaluated these algorithms by applying them to two real legacy applications, built by two different companies, and consisting of 57 and 107 windows of different types. The results of the evaluation indicate that, on average, 95% and 87% (respectively) of the widgets are properly laid out. The main contributions of our work are therefore: i) the model-based architecture proposed to reverse engineering the layout, ii) the metamodels (i.e. data structures) to represent the information gathered, and iii) the algorithms devised to infer the layout. A limited number of works have dealt with layout recovery (Lutteroth, 2008; Stroulia et al, 2003). Our work is novel in explicitly representing the layout extracted and using a model-driven approach to solve the layout detection problem in a platform-independent way. A preliminary version of this work was presented as a short paper at the ASE’10 conference (S´ anchez Ram´ on et al, 2010). This paper extends it significantly by detailing the solution architecture, presenting the metamodels and algorithms involved, and performing an evaluation of the approach. The paper is organised as follows. The following section motivates the need to migrate RAD-based legacy systems, introduces the technical context of the paper, and briefly describes the architecture of our solution. The main metamodels of the presented approach will be described in Section 3. Section 4 presents the algorithms involved in our reverse engineering approach. The following section shows implementation details of the architecture (Section 5), and Section 6 presents the evaluation of our approach. Finally, Section 7 presents the related work, and Section 8 finishes the paper. 2 Overview of the approach In this section we will first introduce the context and requirements of the migration of the GUI of RAD applications. We will then present an overview of the approach. Finally we will explain the benefits of the approach followed. 2.1 Migration requirements of the GUI of RAD applications As it was stated in the introduction, the migration of a legacy application must deal with the data access, the business logic and the GUI. In this paper
4
´ Oscar S´ anchez Ram´ on et al.
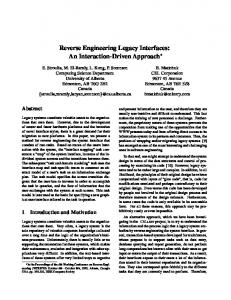
Fig. 1 Example window.
we focus on the automation of reverse engineering tasks related to GUIs built with a RAD environment. One of the key aspects involved in the migration of the GUI is the discovery of the layout, that is, obtaining a representation that reflects how the graphical panels and widgets are arranged on the screen and displayed to the user, i.e. the design of the interface. Discovering the layout of a GUI is important if subsequent reengineering activities are to be accomplished, and our aim is to tackle the reengineering of applications created with RAD environments (from here on referred as RAD applications). Figure 1 shows an example window created with Oracle Forms, which is a well-known RAD environment. Modern GUI technologies frequently provide developers with predefined layouts with which to create interfaces, such as GridLayout or BorderLayout in the case of Java Swing. However, the GUI of the RAD applications does not have an explicit notion of layout, and widgets are dragged from a palette and placed into a particular position (which is sometimes almost arbitrary) on a canvas. RAD applications therefore only provide a coordinate-based layout. The migration of RAD applications to modern platforms with explicit layout facilities poses the challenge of uncovering the implicit structure of the GUI in order to obtain an explicit representation of the layout. Various works have dealt with the reengineering of legacy applications, some of which migrate the user interface as part of the process. A typical example is the migration of legacy desktop applications to Web platforms (Chen et al, 2003; Bandelloni et al, 2005). However, the quality of the target layout of the user interface tends to be poor, since these proposals only map widgets between source and target technologies and replicate the original layout in a simple and straightforward manner. Hence they do not actually recover the layout of the application, thus hindering subsequent reenginering steps. Next,
Model-Driven Reverse Engineering of Legacy Graphical User Interfaces
5
we briefly comment on three cases in which an explicit recovery and representation of the layout would enable reengineering activities to be performed: – Layout-preserving migration. Application users are sometimes averse to change, and some migration projects have therefore a requirement which specifies that the original GUI layout must be preserved in the target application. Another example of the utility of layout preservation would be to generate a mock application which tracks user input in order to generate test cases (Memon et al, 2003). – Reengineering for GUI adaptation. Migrating to a new GUI technology requires taking advantage of the target technology’s features (e.g. usability standards, high-level layout models of modern GUI toolkits, etc.). A particular case of this category would be the migration to technologies with constraints related to the visualisation display, such as mobile devices. Given an explicit layout model, the developer could either refactor the layout manually or (semi-)automatic transformations could be applied. – Quality improvement. Perfective maintenance tasks may be required to improve the system quality, such as the detection of usability issues, nonvisible widget removal, GUI resizing and beautification (Lutteroth, 2008). An explicit representation of the GUI would enable this analysis, and would also permit refactoring. In this way, we propose a solution that can be used to extract a high level representation of the layout of the original application. In contrast to previous works, our solution is devised to be used not only for a specific technology but reused with little effort for all the source technologies that share the characteristics of RAD environments. We offer a concrete solution that takes advantage of the benefits of MDE, that is, as part of the solution we include the algorithms (in the form of model transformations) and data structures (metamodels) needed to tackle the problem. Our solution is driven by the following requirements: – Explicit GUI information. A high-level representation of the GUI must be discovered, i.e. metadata concerning the GUI. It must be possible to analyze and automatically transform this metadata. – Modularity and automation. Owing to the wide semantic gap between RAD environments and current technologies, it would be desirable to split the reengineering process into simpler stages to make it maintainable. We are also interested in automating it as much as possible. – Source and target independence. The reengineering process should be easy to reuse with different RAD technologies (source independence). Furthermore, it must be extensible, so that new target platforms can be added without changing the reverse engineering and restructuring stages (target independence).
´ Oscar S´ anchez Ram´ on et al.
6
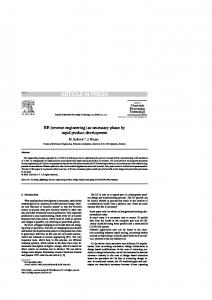
2.2 Overview of the MDE solution In order to fulfill the elicited requirements we have addressed the reverse engineering process by applying MDE techniques, that is, metamodelling and model transformations (Clark et al, 2004). A metamodel describes the structure of models, which are used to represent an aspect of a system at a particular abstraction level. In our case, GUI metadata will be explicitly expressed by means of models, and metamodels will define the structure of these metadata. Several metamodels have been defined to represent a source GUI and the metadata gathered during the reverse engineering process. Model transformations allow the conversion of models at different levels of abstraction to be automated, by establishing mappings between metamodels. In our case, we have automated the reengineering process by means of a transformation chain, that is, a sequence of model transformations performed in order to split the transformation process into several stages since the process entails bridging a wide semantic gap. Figure 2 shows the transformation chain devised. The process is split into the three typical stages of a reengineering process (reverse engineering, restructuring and forward engineering).
Reverse Engineering
Region model
Legacy artefact
Source technology model
RAD model
Restructuring
Forward Engineering
Other UIDL
Tile model
CUI model
Target technology model
Target code
Fig. 2 Model-based architecture used to migrate GUIs built with a RAD.
The reverse engineering stage of a model-driven reengineering process starts by injecting models from the source artefacts. This requires the implementation of a bridge between technical spaces (B´ezivin and Kurtev, 2005), particularly a bridge between the technical space of the source artefacts (e.g. grammarware or XML) and the MDE technical space (a.k.a. modelware). In our architecture, a model-based representation of the legacy GUI is obtained in the form of a Source Technology model. This model conforms to a metamodel that depends on the specific RAD technology. Afterwards the Source Technology Model is transformed into a RAD model. This model conforms to the so called RAD metamodel which generalises concepts common to GUIs built with a RAD environment. It is a kind of normalisation model that is intended to make the rest of the reverse engineering process independent of the source technology. The principal and most complex part of the reverse engineering process (which is the main focus of this work) is the layout abstraction step which takes a RAD model as input, discovers the implicit layout of the GUI and
Model-Driven Reverse Engineering of Legacy Graphical User Interfaces
7
returns a Concrete User Interface (CUI) model as output. According to the terminology of the Reference Framework given in (Limbourg and Vanderdonckt, 2004), a CUI model is a technology-independent representation of a GUI. This model provides a representation of the GUI at a higher-level of abstraction than the RAD model. The CUI model is the result of the reverse engineering process, and makes restructuring and forward engineering possible. Restructuring allows the GUI to be adapted and redesigned. This can be done manually, semi-automatically or automatically. On the other hand, forward engineering allows new software artefacts to be generated. For instance, our CUI model could be mapped (this can be considered as restructuring) into another User Interface Description Language (UIDL) such as UsiXML (Limbourg and Vanderdonckt, 2004) in order to take advantage of the existing tools. Finally, the CUI or UIDL representing the original or modified user interface can be moved to a different technology, thus obtaining a Target Technology model (e.g. a Java Server Faces model) from which it can automatically generate the final user interface code.
2.3 Benefits of the approach The proposed architecture satisfies the previously stated requirements. Firstly, explicit information about the layout of the graphical elements in the user interface is condensed in CUI models, thus allowing automatic restructuring and forward engineering processes and tools to be applied to these models. Secondly, resolving the layout abstraction by means of a transformation chain allows the problem solution (algorithms) to be split into smaller modules (transformations) which can be developed and evolved independently, since the metamodels act like the contracts of the modules. The transformations can be chained and executed sequentially to achieve automation, signifying that the most complex part of the process (the generation of the CUI models from the RAD models) is performed automatically. It can be observed that the application of the MDE principles results in a more maintainable solution. Lastly, as we have a RAD model as an input of the reverse engineering process and a CUI model as an output, we achieve source and target platform independence. Thus, only the corresponding injector plus the transformation to derive RAD models are required to support a new RAD technology. Note that the reverse engineering algorithms can be applied independently of the source and target technologies. Reusability and extensibility are thus also promoted in our approach. The contributions of this work are therefore: i) a set of algorithms with which to reverse engineer the layout of RAD GUIs, which are applicable to coordinate-based GUIs in general, ii) the metamodels (i.e. data structures) to represent the information gathered in the reverse engineering, iii) a concrete solution implemented as an MDE framework in order to reengineer the GUI of RAD applications.
´ Oscar S´ anchez Ram´ on et al.
8
3 Reverse engineering metamodels In this section we describe the RAD and CUI metamodels that were presented in the previous section. Contrary to Source and Target Technology models, RAD and CUI models are independent of a concrete technology.
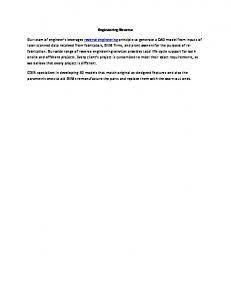
RAD metamodel The commonalities of the GUIs built with RAD environments are described by means of a metamodel denominated as RAD. This is a generic metamodel which allows the GUI of any source RAD application to be expressed in terms of features which are typically provided by RAD environments, such as widgets positioned with coordinates (which form an implicit layout) and a hierarchy of common widgets. Widget GUIElement Window
x: int y: int 0..n width: int height: int
0..n children
PrimitiveWidget Custom
TextBox
Container
DataGrid TabbedPanel
Panel
WidgetGroup PlainPanel
Fig. 3 Excerpt of the RAD metamodel.
The design of the RAD metamodel has been driven by the identification of common features of RAD-based GUIs. An excerpt of the metamodel is shown in Figure 3. Some of these features and their representation in the metamodel are outlined as follows: – Implicit layout. The position of GUI elements (e.g. widgets) is stated by means of coordinates that are relative to the main window or another container. The size of a widget is also given explicitly by the designer. This means that, for example, when a window is resized the widgets are not resized or rearranged accordingly. In the metamodel this is conveyed by the Widget metaclass which has x and y attributes (a coordinate), and an explicit width and height. – Clustering elements. There are special widgets which are intended to group and/or highlight semantically-related widgets. These widgets are represented as subtypes of Container in the metamodel. In particular, we distinguish between Panel s that are elements that arrange a window in
Model-Driven Reverse Engineering of Legacy Graphical User Interfaces
9
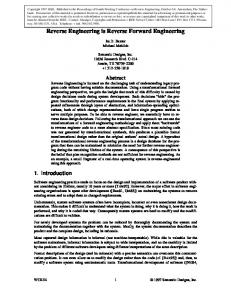
parts (in some RAD environments they can also be reused between windows), and WidgetGroups that are used to highlight a set of widgets in close proximity, frequently by means of a border. – Overlapping. Widgets are often loosely contained in their container, that is, they are overlapped with the container instead of having explicit containment relationships. A container could also be overlapped with another container. This means that a Container may not have any widget in the children reference, although there may be some widgets that would (visually) be expected to be contained. For example, the CardLabel element in Figure 6 is not actually contained in the PaymentFrame element, as can be seen in the GUI tree in Figure 7, but is simply overlapped with the region occupied by PaymentFrame. – Standard widgets. RAD environments share a common set of standard widgets, such as text boxes, buttons, combo boxes, tables, and so forth. They are represented in the metamodel with metaclasses inheriting from PrimitiveWidget. – Technology-dependent widgets. Source technology-dependent widgets (e.g. an ActiveX control) cannot be represented in the RAD metamodel (which is technology-independent), and cannot therefore be part of the subsequent reverse engineering. We propose two alternatives to deal with this issue: i) the metamodel provides a special widget (Custom), that allows the reverse engineering process to deal with them, and developers are in charge of giving them a proper meaning in a later reengineering stage, ii) some specific widgets can be emulated by one or more standard widgets from the metamodel. For instance, an Oracle Forms multirecord is a group of primitive widgets (e.g. text boxes) arranged in a tabular form, which can be mapped into a DataGrid. This mapping is typically carried out in the RAD normalisation stage. As stated previously, a RAD model is derived from a Source Technology model by means of a model-to-model transformation. Given that the RAD metamodel does not establish tight restrictions regarding the arrangement of widgets, defining this model-to-model transformation in order to translate Source Technology metamodel concepts into RAD metamodel concepts is normally straightforward. CUI metamodel In our solution, CUI models conform to the metamodel shown in Figure 4, in which the layout is explicitly modelled with compositions of high-level concepts which are present in most GUI frameworks, such as flows of elements, grids, and so forth. In this metamodel, a View represents a software artefact that displays the part of the GUI that a user sees at a particular moment, such as a desktop application window. From here on, the term View will be used to refer to the metaclass and the term view will be used as a general concept. View s are
´ Oscar S´ anchez Ram´ on et al.
10 FlowLayout
AbstractView
StackLayout
GridLayout
1 1
ExternalViewRef
1 AbstractPanel 0..n 1
PanelRef
TabbedPanel
PlainPanel 1..n
Layout
1
View
1
1
ArrangedPanel 1..n
1
1..n LayoutConnection
GraphicalStyle
Panel
BorderLayout
PanelConnection
Widget 0..n
InnerConnection
WidgetConnection 0..n
1
Fig. 4 Simplified CUI metamodel.
composed of AbstractPanel s (i.e. Panel s and PanelRef s), which are reusable parts of the GUI, in such a way that a panel could be used in several views. Panel s can contain subpanels or widgets. Views and panels have a graphical style (that defines the font type and background colour, for example) and a layout that describes how the subpanels or widgets are arranged. The layout is expressed in terms of hierarchies of high-level arrangements (e.g. FlowLayout, StackLayout, etc.), and has connections (LayoutConnection) that indicate which subpanels (PanelConnection) or widgets (WidgetConnection) are arranged according to it. InnerConnections do not refer to any panel or widget and are used to create a layout tree structure. A WidgetConnection can be related to other WidgetConnections, which is used to express dependencies between widgets (e.g. associate a text field and a label). It is worth noting that the metamodel supports the separation between three concepts: the panel as a reusable part of a view, its graphical style and the layout of the subpanels or widgets that it contains. This metamodel also covers some other aspects of a GUI, which are not within the scope of this paper, but which are of interest when reengineering, such as support for internationalisation. 4 Layout reverse engineering In this section we shall describe the algorithms involved in the layout reverse engineering process, along with the metamodels that support them. We shall focus on the main part of the reverse engineering process, which is the layout abstraction step (step from RAD to CUI in Figure 2)1 . This section therefore explains the technology-independent part of the reverse engineering process, whereas the obtaining of the RAD models will be explained for a particular RAD technology in Section 5. The wide semantic gap that exists between the RAD and the CUI metamodels, means that the transformation requires two additional steps which are 1 A case study GUI taken from a real application that illustrates the reverse engineering process in detail can be found at www.modelum.es/guizmo.
Model-Driven Reverse Engineering of Legacy Graphical User Interfaces
Region model
Tile model
RAD model
11
CUI model
Fig. 5 Model architecture used to obtain the CUI model from the RAD model.
used to gather some information implicitly expressed in the RAD model. Figure 5 shows how this process works, where generates indicates the models that are required to generate a target model, and references indicates the models that contain references to previous models. In a first stage, a Region model is obtained, and a model-to-model transformation is then applied to this model in order to generate a Tile model. Both models annotate a RAD model with additional layout information that is useful to derive a CUI model. We shall first outline the challenges faced when reverse engineering the layout in GUIs built with a RAD environment. The two stages that generate the Region and Tile models will then be explained in sections 4.2 and 4.3 respectively, while section 4.4 will show how we rely on the gathered information to derive a CUI model. The example view in Figure 6 and its partial GUI tree shown in Figure 7 are used as a running example in this section.
4.1 Challenges in layout reverse engineering In RAD environments the layout is implicitly defined by the position of the elements, which are expressed in terms of coordinates. Our aim is to capture the visual arrangement of the elements in such a way that both replicating the layout and redesigning it for a different technology is easy. Transforming an implicit, coordinate-based layout (represented by the metamodel in Figure 3) into an explicit, high-level layout (represented by the metamodel in Figure 4) poses the following challenges. 1. Region identification. A view can be seen as a composition of parts or regions (perhaps implicit) which provides the widgets of the view with a structure. Reverse engineering the structure of a view by identifying regions is necessary for layout redesign. In the example we can make out three regions in the window. Region R2 contains the widgets that are surrounded by the PaymentFrame frame, region R1 is composed of the widgets above the frame, and region R3 includes the widgets below the frame (note that R1 and R3 are implicit). 2. Explicit containment. As explained in Section 3, in some cases elements are not actually contained in a container, but are overlapped. In the example, PaymentFrame surrounds CardLabel, CardCombo, DiscountLabel and DiscountCheck (the checkbox next to DiscountLabel ), but these widgets are
´ Oscar S´ anchez Ram´ on et al.
12
R1
R2
R3
Fig. 6 Example view for entering personal information. Widgets are placed with explicit coordinates. RecordWindow: Canvas
a)
CardLabel: Label CardCombo: ComboBox DiscountLabel: Label DiscountCheck: CheckBox PaymentFrame: Frame ...
RecordWindow: Canvas
b)
PaymentFrame: Frame CardLabel: Label CardCombo: ComboBox DiscountLabel: Label DiscountCheck: CheckBox ...
Fig. 7 (a) Fragment of the original GUI tree. (b) The expected GUI tree.
only visually contained in the frame, that is, their parent element in the model is not PaymentFrame, but rather RecordWindow (see Figure 7). The region identification commented on above must also be taken into account. Matching the containment hierarchy and the visual structure of the layout greatly simplifies the reverse engineering and restructuring algorithms, and it is thus necessary to establish explicit containment relationships. 3. Widget structure recognition. While region identification aims to recognize those parts of which the view is structured, widget structure recognition is focused on how widgets that are spatially-close to each other are arranged. For example, the widgets inside the PaymentFrame form a line. Widgets are often not perfectly aligned, so heuristics are needed. To continue with the example, NameLabel, NameBox, SurnameLabel and SurnameBox could form a line, but it is not clear whether MailButton would be considered as a component of this line. 4. Coordinate abstraction. As already mentioned, a coordinate-based positioning system is not desirable, and thus an alternative means to represent relationships between elements is needed. For example, it would be desirable to know that NameLabel is above AddressLabel and on the left of NameBox. 5. Hole detection. The term hole refers to an area of a remarkable size that does not contain widgets but is surrounded by them. In the example view, there is a hole between DelButton and ExitButton. It is necessary to capture layout holes if a similar layout is to be reproduced in a different technology.
Model-Driven Reverse Engineering of Legacy Graphical User Interfaces
13
0..n children Region xMin: integer xMax: integer yMin: integer yMax: integer
1 associated
«from RAD» GUIElement
Fig. 8 Region metamodel.
The following subsections show the algorithms that deal with these issues.
4.2 Detecting regions and containers This stage is intended to tackle issues 1 and 2 commented on above (namely, region identification and explicit containment). Here, a Region model is automatically derived from a RAD model. A Region model is a model that annotates a RAD model in order to make visual containment relationships between widgets explicit. A Region model represents a tree of regions that conforms to the metamodel shown in Figure 8. It has a unique metaclass called Region, which has the two pairs of coordinates that define a rectangular area, and the children reference to the sub-regions contained in it. Note that Region elements are annotations for the GUIElements of a RAD model. Region models have three main features: i) each GUIElement is associated with a Region defined by two pairs of coordinates, ii) Container s and PrimitiveWidgets must not exist at the same level (i.e. a region that annotates a Container cannot be a sibling of a region that annotates a PrimitiveWidget), and iii) overlapped regions are not permitted. PrimitiveWidgets are prevented from being at the same level as Containers as a means to structure the GUI in a uniform manner, given that the windows are divided into parts which are disjointed and complementary. Each window therefore contains several separate regions (which can in turn contain more regions or widgets), and each widget belongs to a unique region. The goal of this design decision is twofold. On the one hand, we believe that conceptually a UI is composed of related parts like a puzzle in such a way that there are no widgets outside of a part. On the other hand, it makes the structure of the UI uniform and simplifies the later algorithms. A precondition of the algorithm used to create the regions is that the border of a Container must never cross the border of another Container. Our framework has a previous phase that checks whether frame border overlapping occurs. If this occurs, then the reverse engineering process is stopped and a message is shown to the developper so he can fix the GUI manually (although, in our experience this situation rarely arises). In the algorithm we distinguish between three types of regions: widget regions, base regions and extra regions. A widget region is a region associated with a widget. The term base region is used to refer to a region that is as-
´ Oscar S´ anchez Ram´ on et al.
14
RegionExample: Canvas SearchFrame: Frame KeywordLabel: Label KeywordBox: TextBox SearchButton: Button NextButton: Button CloseWindowButton: Button
Fig. 9 Left: example window for the region detection. Right: the logical structure of the widgets. RegionExample SearchFrame KeywordLabel KeywordBox SearchButton NextButton CloseWindowButton
Fig. 10 Structure of the regions after step 2 for the example in Figure 9.
sociated with a RAD container. Extra regions are artificial regions which are created to contain widgets that are not included in a base region. Note that base regions and extra regions will contain subregions, unlike widget regions. We will explain the region detection algorithm with the ad-hoc example window in Figure 9. The algorithm used to create the Region model (Algorithm 1) is summarised in the following steps: Algorithm 1 Region creation algorithm. 1: for all window do 2: r0 ← createRegion(window) 3: for all w ∈ getW idgets(window) do . Gets PrimitiveWidgets and Containers 4: r1 ← createRegion(w) 5: addChild(r0 , r1 ) 6: end for 7: 8: for all r1 , r2 ∈ children(r0 ) do 9: if r1 6= r2 ∧ contains(r1 , r2 ) then 10: if @r3 6= r2 6= r0 .(contains(r3 , r2 )) ∨ ∀r3 6= r2 6= r0 .(contains(r3 , r2 ) → contains(r3 , r1 )) then 11: addChild(r1 , r2 ) 12: end if 13: end if 14: end for 15: 16: createExtraRegions(r0 ) 17: end for
1. Create a region for every GUIElement (lines 2 to 6). r0 is a base region associated with the window, which is the root of the region tree. r1 is a
Model-Driven Reverse Engineering of Legacy Graphical User Interfaces
15
(widget or base) region associated with w, which can be a primitive widget or a container. add(r0 , r1 ) means that r1 is set as a child of r0 . The area of a new region is derived from the (x, y) coordinates, the width and the height of the GUIElement. For example, in Figure 9, a base region is created for each one of the containers (the RegionExample window and SearchFrame), and a widget region is created for each primitive widget (KeywordLabel, KeywordBox, SearchButton, NextButton, CloseWindowButton). 2. Create a tree structure by nesting the regions according to the visual containment relationships (lines 8 to 14). The expression contains(r1 , r2 ) is true if the coordinates of r2 are inside the rectangle defined by the coordinates of r1 . For each pair of regions, r1 and r2 , we make r2 a child of r1 if r1 contains r2 and one of the following conditions is true: i) there is not a different region r3 containing r2 (r2 is a direct child of r1 ), ii) there is another region r3 containing r2 but it also contains r1 (r2 is a direct child of r1 which in turn is a direct child of r3 ). The evolution of the example window after this step can be seen in Figure 10: SearchFrame now contains KeywordLabel and KeywordBox. At the end of this step, there can be widget regions which are siblings of base regions in the Region model. Following with the example we can see that SearchButton, NextButton CloseWindowButton are siblings of SearchFrame. 3. Create extra regions to prevent PrimitiveWidgets from being at the same level (siblings) as the Container s. The algorithm iterates once over every widget region that is a sibling of either a base region or an extra region (at the beginning there are only base regions). For each widget region we have three possible cases: – Case A: the widget is not partly contained in any existing base or extra region (i.e. the widget does not cross the bounds of any base or extra region), so a new extra region is therefore created for the widget region. The new region takes the maximum area available without interfering with the other regions. Following with the example, we assume that we have already dealt with KeywordLabel and KeywordBox, and now is the turn of CloseWindowButton. As this widget is not contained in the unique base region R1 (see left part of Figure 11), a new extra region R2 is created for it (right part of Figure 11). – Case B : the widget region is partly contained in a base region. In this case the size of that base region is increased to enable it to cover the area occupied by the widget region, and the widget is added to it. Augmenting the size of the base region may cause that the base region overlaps some extra regions, and the overlapped extra regions are therefore shrunk to avoid the overlapping. Continuing with the example, let us make the algorithm iterate over SearchButton which is partly contained in the region R1 associated with SearchFrame (left part of Figure 12), so we augment the base region to fully contain SearchButton (right part of Figure 12). This implies that the region R2 is shrunk. If a widget is partly contained in more than one sibling base region, then the widget is included in only one base region, and in this case the
´ Oscar S´ anchez Ram´ on et al.
16
R1
R1
R2
Fig. 11 Case A. Left: example window with a base region R1. Right: a new extra region R2 created to contain CloseWindowButton.
R1 R1
R2
R2
Fig. 12 Case B. Left: example window with a base region R1 and an extra region R2. Right: the base region R1 is augmented to include SearchButton completely and the extra region R2 is diminished.
widget is shrunk to fit into that base region. We have not found this case yet in practice. – Case C : the widget is partly contained in an extra region. It is necessary to reduce the extra region that partly contains the widget so that the widget no longer enters its area anymore. In addition, a new extra region to contain the widget is created. Going back to the example (see Figure 13), the algorithm iterates over NextButton. As the widget crosses the bounds of the extra region R2, this region is resized to exclude the widget. Hence, a new extra region R3 is created to contain the new widget without interfering with any of the already created regions. The cases are evaluated in the following order: case B, case C, case A. Note that in the example we have iterated over the widgets in a way that it facilitates the explanation of the cases, though other orders are also possible. The different orders will end up in regions that may differ in their coordinates but that group the widgets in the same way.
4.3 Uncovering relative positions The objective of this second stage is to make the layout independent of the coordinate-based system. This deals with issues 3, 4 and 5 mentioned previously (namely, widget structure recognition, coordinate abstraction and hole detection). The input of this stage is a Region model, and a Tile model is automatically generated.
Model-Driven Reverse Engineering of Legacy Graphical User Interfaces
R1
17
R1
R2
R2
R3
Fig. 13 Case C. Left: example window with a base region R1 and an extra region R2. Right: a new extra region R3 is created to contain NextButton, and the region R2 is diminished. Tile left 0..n
«from RAD» GUIElement
x: int y: int associated width: int height: int 0..1 hSize: float children vSize: float 0..n vAlignment: VAlignment hAlignment: HAlignment 0..n
PanelTile
TabbedPanelTile
0..n
down 0..n
right
CoarseGrainedTile
up
FineGrainedTile
LineTile
ColumnTile
children 0..n PairTile
«enumeration» HAlignment LEFT CENTER RIGHT «enumeration» VAlignment TOP MIDDLE BOTTOM
ItemTile
2
HoleTile SingleTile
Fig. 14 Tile metamodel.
Tile models are mainly focused on representing how widgets and containers are arranged, in terms of relative positions among them. We define a tile as a part of a view with spatial relationships with other neighbouring parts. For example, a certain tile could have another tile above it and a different tile below. This positioning system is useful for the later identification of high-level layout patterns, as will be shown in Section 4.4. Tile models also refine Region models by identifying sub-structures inside regions, such as groups of widgets that form a line. The Tile metamodel is shown in Figure 14. The main concept is that of Tile. Every Tile is associated with the GUIElement from which it originated, if one exists (i.e. some tiles originated from extra regions). Such references to the RAD model are propagated from the Region model. There are four zero-to-many relationships between tiles, which are used to relate the tiles spatially, namely right, left, up, down. We use hSize and vSize to measure the percentage of the width and height that is taken up by that tile in the view with regard to the width and height of the container tile. Tiles also include information about the area they take up by means of x, y, width, height. A tile can also be aligned with regard to its container tile, and hAlignment and vAlignment are used for this purpose. We distinguish four kinds of tiles: – Coarse-grained tiles: these tiles arrange a view in parts which can be visually distinguished. Each tile represents a block of related widgets which
´ Oscar S´ anchez Ram´ on et al.
18 T2 T1
T5
T3 T4
(a) Adjacency example
1/2
A
B
1/3
C
(b) Horizontal intersection value example
Fig. 15 Relative positions between tiles.
are in the same area and are likely to contain widgets to perform system actions (e.g. the bottom buttons in Figure 6), or data concerning a topic such as “payment details” in the middle part of Figure 6. All base and extra regions are mapped to this kind of tile. For instance, in Figure 6 the regions R1, R2, and R3 are mapped to PanelTiles. – Fine-grained tiles: these tiles arrange a set of widgets that are spatially close and have a certain spatial structure, such as a horizontal line (LineTile) or a vertical column (ColumnTile). Fine-grained tiles are aggregated inside coarse-grained tiles. To continue with the example, NameLabel, NameBox, SurnameLabel and SurnameBox are all mapped together to a LineTile. – Item tiles: they are associated with single widgets (SingleTile) and pairs (PairTile) of related widgets such as a text box (e.g. NameBox ) and its associated label (e.g. NameLabel ). Item tiles are contained in Fine-grained tiles. – Hole tiles: these tiles represent a portion of the view of notable size which has no widgets, such as the space between DelButton and ExitButton in Figure 6. Next, we establish some of the concepts which allow spatial relationships between tiles to be detected. Figure 15 is used to illustrate these concepts. All the following concepts are defined over tiles, but since we have the (X,Y) coordinates, the width and height of both regions and tiles, the concepts are applicable to regions too. We will define adjacency as a criterion with which to decide whether two tiles of the same kind are spatially related (for example, that a coarse-grained tile T1 is on the left of another coarse-grained tile T2). Our definition of adjacency is based on the concept of sharing. A pair of tiles is vertically sharing if the intersection of the projections of both tiles on the X axis is not empty, i.e. the x-range of both tiles is overlapped. Likewise, a pair of tiles is horizontally sharing if the intersection of the projections of both tiles on the Y axis is not empty, i.e. the y-range of both tiles is overlapped. As is observed in Figure 15(a), T2 and T3 are vertically sharing, and T2 and T4 are also vertically sharing, but T3 and T4 are not. The introduced definitions of sharing are too strict because they consider that overlapped projections always reflect horizontal lines or vertical columns. For instance, in Figure 15(b) A, B and C may (or may not) form a line, because they are not perfectly aligned. This can be addressed by modifying the sharing
Model-Driven Reverse Engineering of Legacy Graphical User Interfaces
19
definition to be more tolerant, and we introduce the intersection value with this aim. We define the vertical intersection value as the percentage of width that a pair of tiles have in common. It is calculated as the intersection of the x-ranges of the pair of tiles divided by the minimum width of both tiles. Similarly we define the horizontal intersection value between a pair of tiles as the percentage of height that a pair of tiles have in common, which is calculated as the intersection of the y-ranges of the pair of tiles divided by the minimum height of both tiles. Figure 15(b) shows how this function is applied. The percentage of the height that tile A has in common with tile B regarding tile A is 0.5, while the value is 0.33 as regards tile B. The result is therefore the maximum value, that is 0.5. Note that a pair of tiles that are horizontally sharing always have a positive horizontal intersection value (similarly with the vertically sharing). The sharing can be redefined (for horizontal sharing as well as vertical sharing) as follows: a pair of tiles are sharing if the intersection value is greater than a threshold which represents the tolerance level, currently set to 0.5. Based on the concept of sharing, we can now define adjacency. A tile t1 is vertically adjacent to another tile t2 if and only if both tiles are vertically sharing and there is no tile t3 between t1 and t2 . Likewise, a tile t1 is horizontally adjacent to another tile t2 if and only if both tiles are horizontally sharing and there is no tile t3 between t1 and t2 . There is a precondition that the tiles t1 and t2 must not be overlapped (in our case this is enforced by the RAD). To continue with the example in Figure 15(a), we can see that T2 and T3 are vertically adjacent, and T1 and T4 are horizontally adjacent, among others. The up, down, left, right relationships of the tiles are defined based on the adjacency as follows. For a tile t1 it is true that t1 .right = {t2 } and t2 .lef t = {t1 } if t1 and t2 are horizontally adjacent and t2 is to the right of t1 . The down, left, right relationships are defined in a similar way. Note that when one type of relationship is established for a tile, the opposite type is also set. In the example shown in Figure 15(a), we have the following relationships for T1, T2 and T4: T 1.right = {T 2, T 3, T 4} T 2.lef t = {T 1}; T 2.right = {T 5}; T 2.down = {T 3, T 4} T 4.up = {T 2}; T 4.right = {T 5}; T 4.lef t = {T 1}
As can be seen, T 2.down = {T 3, T 4}. However, there is a blank space between T2 and T4 that is not captured with the concept of adjacency. Thus, there is some layout information that is lost due to blank spaces being ignored. In order to tackle this issue, the first step is to set a criterion with which to decide whether two vertically/horizontally adjacent tiles are not sufficiently close, but there is a significant blank space between them. We define that a pair of widgets is horizontally close if the percentage of the horizontal distance between the pair, with regard to the container width is smaller than
20
´ Oscar S´ anchez Ram´ on et al.
a particular value. A pair of widgets is vertically close if the percentage of the vertical distance between the pair, with regard to the container height is smaller than a particular value. It is currently set at 20%. In the example shown in Figure 15(a), when using this criterion we have that T2 and T3 are adjacent and close, whereas T2 and T4 are adjacent but not close. When a blank space is detected, two complementary approaches are used to represent it. The first one is to specify that some tiles are aligned with regard to the container tile. To continue with the example, T1, T2 and T3 are aligned on the left, T5 is aligned on the right, and T4 is aligned in the bottom-center. There can be several adjacent tiles with the same alignment, which does not mean that all these tiles have to be attached to the bounds of the container. For instance, T1 and T2 are both aligned to the left but actually T2 is on the right of T1. The alignment solution has the disadvantage that there may be blank spaces that are not represented. The second approach is to include HoleTiles which represent blank spaces in the layout, thus signifying that an arbitrary distance between tiles must be maintained. These kind of tiles have dimensions that are specified as a proportion between the empty space and the width or height of the container. Since they are not exclusive solutions, both have been implemented in order to facilitate the obtaining of an accurate high-level layout in the CUI model. The hAlignment and vAlignment attributes were introduced for the first alternative and the HoleTile metaclass for the second one. Next, the algorithm that takes a Region model and generates a Tile model is presented. Some auxiliary functions are not explained, but their names denote what they do. The algorithm is organised in four phases: i) creating the tiles, ii) establishing up, down, left, right relationships between tiles, iii) setting the spatial alignment of the tiles with regard to the container tiles, and iv) creating hole tiles to represent blank spaces. Each phase will be explained separately. Phase 1. The first phase (see Algorithm 2) generates tiles based on regions. The algorithm traverses the Region model recursively from the root region. It has two parameters: i) the container region (base or extra region) to be traversed, and ii) the parent tile which will contain the created tiles. For each container region (the parameter) to which the procedure CreateTiles is applied, it creates a coarse-grained tile (line 5), and for each widget region that is a child of the parameter region, it creates an item tile (lines 10 to 13). Fine-grained tiles are generated for the content of container regions which include widget regions (lines 7 to 15). This is done by using a clustering algorithm that is applied to the container region in order to identify structures of widget regions (line 24). The clustering algorithm makes a first attempt to group widgets in horizontal lines or columns (horizontal lines have priority over columns) based on the vertical/horizontal sharing. As it has already been said, a pair of regions are sharing if their intersection value is higher than a threshold (set by default at 0.5), and will therefore be classified in the same group. In cases it happens that some widget regions have such a big height
Model-Driven Reverse Engineering of Legacy Graphical User Interfaces
21
Algorithm 2 Tile creation algorithm. Phase 1: Mapping and clustering. 1: 2: 3: 4: 5: 6: 7: 8: 9: 10: 11: 12: 13: 14: 15: 16: 17: 18: 19: 20: 21: 22: 23: 24: 25: 26: 27: 28: 29: 30: 31: 32: 33: 34: 35: 36: 37: 38:
root ← getRootRegion() createT iles(root, ∅) procedure createTiles(region, parentT ile) coarseT ile ← createCoarseGrainedT ile(region) if containsW idgetRegions(region) then . All children are widget regions groups ← clusterW idgets(region) for all group ∈ groups do f ineT ile ← createF ineGrainedT ile(group) for all itemRegion ∈ group do itemT ile ← createItemT ile(itemRegion) add(f ineT ile, itemT ile) end for add(coarseT ile, f ineT ile) end for else . All children are container regions for all childRegion ∈ children(region) do createT iles(childRegion, coarseT ile) end for end if addChild(parentT ile, coarseT ile) end procedure function clusterWidgets(region) . Clustering algorithm G ← detectGroups(children(region)) . Uses horizontal/vertical sharing for all G1 , G2 ∈ G.(G1 ∩ G2 6= ∅) do Gnew ← G1 ∩ G2 remove(G1 , Gnew ) remove(G2 , Gnew ) add(G, Gnew ) end for for all G1 ∈ G do if ∃r1 , r2 ∈ G1 .(areAdjacent(r1 , r2 ) ∧ notClose(r1 , r2 )) then . Uses horizontally/vertically close splitGroup(G1 ) end if end for return G end function
that they are horizontally close to widget regions in more than one line, that is, they can belong to different lines of widgets (e.g. tile T1 in Figure 15(a)). Similarly, some widget regions may be so wide that they are vertically close to widget regions in more than one column. In order to avoid this, we create new groups for those regions that are classified in more than one group (lines 26–31). Finally, we check that adjacent regions inside the groups are vertically/horizontally close, and if this is not the case, then the group is split (lines 32–36). Phase 2. The second phase of the tile creation algorithm establishes the up, down, left, right relationships between adjacent tiles. For each ordered pair of tiles (t1 , t2 ) which are children of the same coarse or fine-grained tile, t1 .up ←
22
´ Oscar S´ anchez Ram´ on et al.
t2 and t2 .down ← t1 if: i) they are vertically adjacent, ii) they are vertically close and iii) t2 is above t1 . The left, right sets are obtained in the same manner. Algorithm 3 Tile creation algorithm. Phase 3: Alignment. 1: for all t0 ∈ Tcoarse ∪ Tf ine do . t0 is a coarse-grained or fine-grained tile 2: HAlignedSeq = {} 3: OrderedT iles ← topologicalSort(children(t0 )) . Topological sort from up to down and left to right 4: for all t1 ∈ OrderedT iles do 5: /* For simplicity we are only considering the horizontal alignment */ 6: add(HAlignedSeq, t1 ) 7: if t1 .right = {} then 8: xM inP ercent ← f irst(HAlignedSeq).x/t0 .width 9: xM axP ercent ← (last(HAlignedSeq).x + last(HAlignedSeq).width)/t0 .width 10: if xM inP ercent ≤ Lower threshold then 11: for all t2 ∈ HAlignedSeq do t2 .hAlignment ← LEF T 12: else if xM axP ercent ≥ U pper T hreshold then 13: for all t2 ∈ HAlignedSeq do t2 .hAlignment ← RIGHT 14: else 15: for all t2 ∈ HAlignedSeq do t2 .hAlignment ← CEN T ER 16: end if 17: HAlignedSeq = {} 18: end if 19: end for 20: end for
Phase 3. The third phase (see Algorithm 3) is in charge of aligning tiles with regard to their container tile. The idea behind this algorithm is based on the following two principles: i) if a tile is very close to the boundaries of its container tile, then the tile is aligned with regard to them, and ii) if several tiles are next to each other, then all of them have the same alignment. For instance, let us assume that in Figure 15(a) the tiles T1, T2, T4 and T5 are very close to the boundaries of the container tile. Therefore T1 is aligned to the left because it is close to the left boundary, and T2 and T3 are aligned to the left because they are on the right of T1 which is aligned to the left. In the algorithm the tiles are iterated in a topological order (lines 4–19), which is computed from the directed graph that results from taking into account only the right and down relations of the tiles. We add each tile to the current alignment group (line 6) and when there are no more adjacent close tiles on the right (line 7), then we assign an alignment type to each one of the tiles in the group (lines 8 to 18). If the most-left tile of the group (the first tile) is close to the left boundary, the alignment is LEFT (line 11). If the most-right tile of the group (the last tile) is close to the right boundary, the alignment is RIGHT (line 13). If none of the previous cases is applicable, then the alignment is set to CENTER.
Model-Driven Reverse Engineering of Legacy Graphical User Interfaces
23
Phase 4. The last phase of the algorithm identifies significant blank spaces in the view, and creates hole tiles for them. For each pair of tiles that are children of a coarse or fine-grained tile, if the tiles are adjacent and are not close, then we create a hole tile. This new hole tile is placed between t1 , t2 and the up, down, left, right relationships of both tiles are modified. These properties are also initialised for the hole tile according to its relative positioning regarding the t1 and t2 tiles. Finally the new hole tile is added to the parent tile.
4.4 High-level layout At this stage, information about the relationships among elements of the GUI has been gathered. However, it is interesting to take a further step forward in the way in which the layout is represented in the Tile model to make it more similar to the layout managers provided by modern GUI frameworks. To this end, the CUI metamodel introduced in section 3 defines explicit high-level layouts such as grids (GridLayout) or stacks of elements (StackLayout). For example, if we had a sequence of tiles sorted vertically (each tile below another one), we would explicitly “mark” those tiles as forming a stack layout. The layout types which we use are included in common GUI frameworks such as Java Swing, as well as in diagram editors and other domains (Jacobs et al, 2003; Li and Kurata, 2005). CUI models are generated from RAD models by using the information provided by the Tile model, in the form of annotations. The algorithm that creates CUI models from Tile models is split into three phases: 1. Create the structure tree. The RAD widgets are mapped to CUI widgets, and the tree structure of the widgets of the CUI model is created according to the containment relationships detected in the Region identification stage. With this aim, the tile model is traversed in a recursive manner, and the following actions are performed according to the tile type: if the tile is a coarse-grained tile, it creates a Panel, adds it to its container View or Panel, and continues with the tile children; if the tile is a fine-grained tile, it simply navigates its children; if it is a single tile, it creates a widget for it and adds it to the container Panel. 2. Create the layout tree. In order to get the high-level layout tree, the Tile model is traversed recursively. For each coarse-grained tile we apply several fitness functions on its children and the layout type whose fitness function returns the greatest value is selected. The fitness functions return a number between 0 and 1 that represents the estimated percentage of tiles that fit the layout out of the tiles in the group. A new layout of the selected type is created by applying a heuristic associated with the layout type. In the case of fine-grained tiles, LineTiles are directly mapped to FlowLayouts, and ColumnTiles are directly mapped to StackLayouts. 3. Link both trees. It links the GUI and layout trees, by selecting the layout for each container and the container of each child connection of each layout.
24
´ Oscar S´ anchez Ram´ on et al.
The tree structure of the layout tree in step 2 is achieved by means of the LayoutConnections. Each new layout that is created is nested in the parent LayoutConnection. Depending on the type of children tiles, different LayoutConnections will be created: PanelConnection if the child is a coarse-grained tile (it is associated with a Panel in the step 3), InnerConnection if the child is a fine-grained tile, and WidgetConnection if the child is a item tile (it will be associated with a Widget in the step 3). Then, the same process is applied for each children coarse or fine-grained tile with the LayoutConnection as a parameter. As can be noticed from step 2, we have a set of layout types and each of them has an associated heuristic and a fitness function. The heuristics select a starting tile and navigates its left, right, up, down references in an attempt to discover whether related tiles form a high-level layout. In general, several alternative layouts can be found to obtain a similar GUI from a visualisation point of view. In order to decide which layout best fits a group of tiles, the fitness functions are calculated for the group, and the layout heuristic whose fitness function is maximum is applied. It may happen that two or more functions return the highest values. In this case, the best layout is selected according to the following priority criterion: FlowLayout, StackLayout, GridLayout, BorderLayout, VHLayout, HVLayout. Next we will detail each type of layout, as well as the heuristics and fitness functions. FlowLayout and StackLayout A FlowLayout is a set of tiles arranged in a row (horizontal line). Similarly, a StackLayout is a set of tiles arranged in a column (vertical line). The tiles are contiguous, i.e. there cannot be a big separation between a pair of tiles. If the layout defines some kind of alignment (horizontalAlignment and verticalAlignment), all the widgets to which the layout is applied are aligned in that way. The heuristic for the FlowLayout takes the top-left tile and navigates the tiles to the right until there are no more tiles. When there are several tiles to the right of a tile, only the uppermost tile is selected. For the StackLayout, the heuristic starts with the top-left tile and navigates to the bottom until there are no more tiles. When there are several tiles below a tile, only the leftmost is selected. As it has already been said, these heuristics are only applied to the content of coarse-grained tiles, since fine-grained tiles are directly mapped. The fitness function for the FlowLayout obtains the percentage of tiles that can be navigated from left to right (starting with the most top-left tile). The fitness function for the StackLayout obtains the percentage of tiles that can be navigated from top to bottom (starting with the most top-left tile). In these functions HoleTiles are considered to be tiles that have not been navigated and then they reduce the fitness value. Let us focus on the Figure 6 to show some layout examples. We can find a FlowLayout in the region R2 composed of CardLabel, CardCombo, DiscountLabel and DiscountCheck. A StackLayout is formed by the three regions R1,
Model-Driven Reverse Engineering of Legacy Graphical User Interfaces
25
R2, R3. In the region R3 we could see a non-perfect match of the FlowLayout heuristic. Assuming that AddButton and DelButton form a fine-grained tile and ExitButton forms another fine-grained tile, the fitness function would return 0.66. This value is caused by the hole that exists between both tiles (2 fine-grained tiles / 2 fine-grained tiles + 1 hole). GridLayout This is a set of tiles arranged in a grid of n rows × m columns. The number of rows and columns may be different, but all the rows (and columns) must have the same number of tiles. In this case the heuristic starts with the top-left tile and navigates the group of tiles from left to right and from top to bottom in a tabular way. The fitness function returns the percentage of tiles that can be matched by a rectangular grid. It starts with the top-left tile and counts the number of tiles of the biggest grid possible. HoleTiles are not counted (they reduce the fitness value). When some tiles fit a FlowLayout or StackLayout, then they also fit a GridLayout. For this reason, FlowLayout and StackLayout have a higher priority than GridLayout. There are no GridLayouts in the example introduced in Figure 6. BorderLayout This layout divides the container into five parts: left, right, top, bottom and center. The heuristic selects at most one tile for each one of the five given parts as follows. A tile t will be: in the top part if t.vAlignment = T OP , in the left part if t.hAlignment = LEF T , in the center part if t.hAlignment = CEN T ER, in the right part if t.hAlignment = RIGHT , and in the bottom part if t.vAlignment = BOT T OM . In addition, for a tile to match a part it must keep some relations with the rest of the tiles (e.g. the left tile must be below the top tile, on the left of the center tile, and above the bottom tile). The fitness function evaluates the tiles that can fit any of the five areas predefined by a BorderLayout. If there is more than one tile that can fit one part, these ”excess” tiles are penalised. In contrast to other layouts, a HoleTile is not penalised but permitted. Note that because the FlowLayout and StackLayout have a higher priority, a BorderLayout with emtpy parts (i.e. HoleTiles) that matches FlowLayout or StackLayout will be never selected. For instance, in Figure 6, the regions R1, R2 and R3 could be considered as a BorderLayout with top, center and bottom parts, but they are detected as a StackLayout. In Figure 6, we can find an example of BorderLayout in the region R3. In that region, the widgets AddButton and DelButton are grouped in a finegrained tile and ExitButton is another fine-grained tile. Thus, AddButton and DelButton are the left part and ExitButton is the right part of the BorderLayout (there are only two parts). In this case the fitness function associated
26
´ Oscar S´ anchez Ram´ on et al.
with the BorderLayout returns 1 (i.e. the maximum value), so we can see that the hole has not been penalised. HVLayout and VHLayout An HVLayout is a FlowLayout composed of StackLayouts. A VHLayout is a StackLayout composed of FlowLayouts. An HVLayout can have a different number of elements in each column while in a GridLayout all the columns must have the same number of rows. Similarly VHLayout is not restricted to have the same number of elements in the lines (rows) as in a GridLayout. The HVLayout heuristic obtains the group of tiles that have no upper tiles. From the top-left tile it navigates the tiles from the top to the bottom until there are no more tiles below, and it thus obtains the first column. The tile from the upper tiles that is next to the top-left tile is then selected and navigated to the bottom until it obtains a second column which will be to the right of the first column. This process is repeated while new columns on the right of existing ones can be found. The heuristic penalises HoleTiles. The heuristic for VHLayout is similar to the HVLayout heuristic but in this case it searches for rows until there are no more rows below the previous one. VHLayout and HVLayout are more general than the others and may fit in most cases, in fact VHLayout is the most common layout found in RAD applications. On the other hand they are less specific and do not capture the visual design as well as other layouts such as GridLayout and BorderLayout. Because of this, GridLayout and BorderLayout have a higher priority than VHLayout and HVLayout, but a lower priority than FlowLayout and StackLayout since the latter are more specific. In the example window in Figure 6, we can see a VHLayout in region R1, where there are two lines of widgets. Unknown If the maximum value returned by all the fitness functions is below a certain threshold (it has been set to 0.65, which means that equals or more than 65% of the elements in the group must fit the layout), then an UnknownLayout is created, which is a special layout that indicates that the layout of the group must be determined by the developer.
5 Implementation This section briefly presents the tools involved in and some of the implementation details of our GUI reengineering framework, focusing particularly on Oracle Forms as the legacy technology. The framework has been implemented on top of the Eclipse platform, and is based on the Eclipse Modeling Framework (EMF ) (Eclipse, 2003). The metamodelling language that has been selected to represent the models and
Model-Driven Reverse Engineering of Legacy Graphical User Interfaces
27
FormModule
0..n Window
1
0..n Graphics type: GraphicsType visible: boolean
0..n
0..n Canvas type: CanvasType visible: boolean
0..n TabPage
0..n DataBlock itemsDisplayed: int 0..1
0..1
«enumeration» CanvasType CONTENT SEPARATOR ...
0..n Item xPosition: int yPosition: int visible: boolean type: ItemType itemsDisplayed: int prompt: String promptAttachment: AttachmentType attachmentOffset: int promptAlignment: AlignmentType alignmentOffset: int
«enumeration» ItemType TEXTELEMENT BUTTON CHECKBOX ...
«enumeration» GrahicsType TEXT FRAME IMAGE ...
«enumeration» AttachmentType BEGINNING END TOP BOTTOM
«enumeration» AlignmentType BEGINNING CENTER END
Fig. 16 Excerpt of the Oracle Forms metamodel.
metamodels is Ecore. The workflow of the reengineering process is defined and managed by a task management tool called Rake (Rake, 2012), a sort of Make for Ruby.
5.1 Injection Let us first consider the injection step (from legacy artefacts to Source Technology models) shown in Figure 2. An injector is required for every RAD technology for which we want to migrate applications. It is worth noting that this step is particularly dependent on the source artefact format and the export facilities of the RAD environment. Some environments such as Delphi and Visual Basic use plain text files to store the GUI specification. Oracle Forms, however, uses a binary format (FMB files), but there is an export facility that generates XML files conforming to an XML schema which is available in the Oracle Developer Suite. In our case, we have built an injector for Oracle Forms on the basis of the aforementioned XML schema. This has been done by using EMF which, given an XML schema, automatically generates a metamodel and the injector that takes XML files and creates models conforming to this metamodel. The Oracle Forms metamodel automatically derived by EMF mirrors the structure of the XML schema provided by Oracle, as is shown in Figure 16. The following points summarise the structure of this metamodel. – A form (FormModule) in Oracle Forms is a set of Windows with its related business logic expressed in PL/SQL triggers. The code is extracted from the XML files in a separate process, which is not within the scope of this paper. – A Window can show one or several Canvases, which are the panels on which the widgets are displayed. There is a special type of Canvas called SEPARATOR which can contain TabPages.
28
´ Oscar S´ anchez Ram´ on et al.
– A Canvas is a surface that is used to display Graphics and Items. Graphics are graphic decorators such as fixed text (TEXT ), or graphical frames (FRAME ). Items are widgets such as buttons or text fields, which are distinguished by the type property. Contrary to what might be expected, Canvases contain Graphics but not Items. Items are contained in DataBlock s and they are associated to zero or one Canvases. An Item will be displayed if it is associated with a Canvas, its width and height are greater than zero, and it has visible set to true. – A DataBlock is a logical group of widgets that are often associated with columns of the same table in the database. – The coordinates of Items and Graphics are relative to the Canvas that displays them, whereas Canvases are located with absolute coordinates. In the metamodel there are no explicit relationships to specify whether a graphical frame contains other widgets or graphical frames, or whether two canvases are overlapped. – Moreover, the itemsDisplayed property of Item indicates the number of instances of the same kind of widget that are shown. This feature is referred to as multi-record items, and can be regarded as a form of data grid. – It is possible to specify a prompt for an Item, i.e. a text that is associated with the Item. The coordinates of the prompt elements are defined with regard to the associated Item. The prompt can therefore be on the left (promptAttachment=BEGINNING), on the right (promptAttachment=END), above (promptAttachment=TOP ), or below (promptAttachment=BOTTOM ) the Item, and it can also be aligned to the left (promptAlignment=BEGINNING), in the middle (promptAlignment=CENTER) or to the right (promptAlignment=END) of the Item.
5.2 Mapping Oracle Forms to RAD models Once the source artefacts related to the GUI have been injected into a model, the latter must be transformed into a RAD model that represents the same GUI but is independent of the source technology (step from Source Technology models to RAD models in Figure 2). The RAD model can be considered as a normalised form of the source artefacts. The Forms to RAD transformation is, in general, fairly straightforward, since there is a direct mapping between the source technology metamodel elements and the RAD metamodel elements. This mapping is summarised in Table 1. However, Oracle Forms has some specific features which are not found in other RAD applications such as Delphi or Visual Basic. We shall now discuss two specific features that hinder the Forms-to-RAD transformation, which are prompts and multi-record items. In some RAD environments, there is a kind of widget that is frequently called Label which is a piece of static text that can be placed anywhere in a window. In contrast, Oracle Forms includes a similar widget, but it also offers
Model-Driven Reverse Engineering of Legacy Graphical User Interfaces Forms Window Canvas (type=CONTENT) Canvas (type=SEPARATOR) TabPage Graphics (type=TEXT) Graphics (type=FRAME) Item (type=TEXTELEMENT) Item (type=BUTTON) Item (prompt) Item (itemsDisplayed >1 )
29
RAD Window PlainPanel TabbedPanel PlainPanel Label WidgetGroup TextBox Button Label Table
Table 1 Forms to RAD mappings.
another possibility, which is to use a Prompt element which is associated with a widget. The location of the Prompt can be expressed with regard to different reference points, which always refer to the associated widget. Specifically, the Prompt can be above, below, on the left or on the right of the widget and aligned to the beginning, the middle, or the end of the widget, which results in twelve possibilities. In order to calculate its coordinates it is necessary to obtain the width or height of the text of the Prompt, which is not easy since it depends on both the font type and the font size. Moreover, Forms by default does not express coordinates in pixels, but in proprietary measures. This implies that Prompt coordinates can contain a small error owing to the width/height calculation and the conversion between measures. In our case, we did not find a coordinate error greater than 8 pixels. Another specific feature is multi-record widgets, that is, a widget that is replicated a number of times. For example, let us assume a window that must show some aspects of people’s personal data. In this case, it will be necessary to have some text fields to display the name, surname and other data, and one multi-record text field could therefore be used for the name, another for the surname and so on. In current GUI technology we use data tables for this purpose. Since multi-record widgets can be scattered on the canvas and show different kinds of information, there is the challenge of deciding when certain multi-record widgets must be in the same table (i.e., each multi-record widget is a column of the table). The criterion used to group widgets in tables is the following: we group multi-record widgets that are closer than a fixed value where no non-multi-record widget exists between them. Moreover, when buttons that belong to the same datablock as multi-record widgets exist, they are also included in the table. Since this is a heuristic to group widgets in tables, developers might need to modify the RAD models in order to correctly rearrange widgets in tables. Finally, the transformation from the source technology to RAD performs some clean up tasks. In particular, it marks the elements that are not visible and checks that widgets do not overlap. A GUI frequently includes nonvisible widgets which are intended to store values that are used in transactions, so they never appear in the interface. The elements that are not visible are marked in the RAD model, so the layout algorithms ignore them. Overlapped
30
´ Oscar S´ anchez Ram´ on et al.
widgets are sometimes found in applications. Developers can use overlapping to show different information with different widgets that are displayed and hidden by means of programming. Since this is not a good practice and widget overlapping hinders layout detection algorithms, overlapping is detected, and developers must fix this to ensure that the rest of the process continues properly.
5.3 Reverse engineering With regard to the reverse engineering stage of Figure 2, the algorithms presented in Section 4 have been implemented as a chain of model-to-model transformations. To this end we have chosen the RubyTL (Cuadrado et al, 2006) language. RubyTL is a rule-based model-to-model transformation language embedded in Ruby which is integrated in the AGE environment (Cuadrado and Molina, 2007). It provides powerful query facilities, in addition to a modularity mechanism, called phasing, that has facilitated the implementation and modularisation of the solution (Cuadrado and Molina, 2009).
5.4 Forward engineering Restructuring and forward engineering tasks are made possible with the CUI model obtained in the reverse engineering step. As part of our prototype we have implemented a generator from CUI models to Java Swing, using the Textplate code-generation language integrated into the AGE environment. The transformation is relatively straightforward, since the CUI model represents the layout information explicitly. This also allows the original legacy GUI to be recreated using features that are only available in the target technology. For instance, the proportion of the space that is occupied by a widget or layout is used to generate resizable windows that preserve the original proportions. When a window is resized, its content (i.e. the widgets) must be resized accordingly. However we do not wish to resize all the widgets, but only those widgets that can contain or display more information if they are resized. Therefore, some widgets will be resized while others will maintain a fixed size. Widgets such as JLabels and JButtons will have a fixed size, which will be their preferred size. Widgets such as JTextField or JTable will have a variable size, which will depend on the size of the window. It is interesting to note that further advantage can be taken of the information expressed explicitly in the CUI in order to generate a GUI in the most suitable manner for a target technology. For example, in our CUI it is possible to represent some relationships among widgets (think, for example, of a widget and its associated label) by means of the association between WidgetConnections in the CUI metamodel presented in Figure 4. This information can be used to define gaps between pairs of widgets, and the gap between related widgets can be made narrower than the gap between unrelated widgets.
Model-Driven Reverse Engineering of Legacy Graphical User Interfaces
31
6 Evaluation In order to evaluate our approach and demonstrate its applicability we have applied our prototype to the GUI of two real applications in two different domains created by two different companies. The case study A is a business management application which is intended to be used to manage the research projects and grants that are assigned to the research groups of a Spanish university. It is composed of 107 windows, which indicates a medium-high complexity. The application was developed by different developers of the same company and the conventions concerning the style of the forms were not particularly strict, signifying that there is a variety of form styles. The case study B is a business management application targeted at being used by a department of the Regional Government to deal with budgets, income sources, expenses, investment projects and human resources. The application consisting of 57 windows has a medium complexity. Though this application was also programmed by different people, the windows follow a more strict style (imposed by the company) than in the case study A. Both applications were developed in Oracle Forms 6 and both applications needed to be migrated to the Java platform. 6.1 Methodology When recovering the visual appearance of a window, it frequently occurs that different layouts applied to the same widgets could result in a window with a similar visual appearance. The evaluation of our approach cannot therefore be accomplished by simply comparing the layout produced by our tool with an expected layout visually. Instead, the following steps are performed for each window: 1. The original window is manually analysed by a member of our team (different to the developer of the tool) in such a way that certain data concerning the following criteria are registered: – Window parts. Identify the parts of the window and register the relationships among them. A part is defined as a group of widgets that form a distinguished area of the window. A part is a set of close widgets which: – is visually highlighted by means, for example, of a surrounding frame or is enclosed in a coloured rectangle. – is distant to other groups of widgets. – has other parts around it to which the widgets do not belong. Note that in our approach, parts are normally represented with coarsegrained tiles, although this is irrelevant to the person in charge of performing the evaluation. – Relationships among widgets. The structure of the widgets within each part is identified: the position of every widget regarding the others and
32
´ Oscar S´ anchez Ram´ on et al.
the part, and the alignment which exists among them and with regard to the part. The rationale for identifying parts is to have a layout-independent notion of the coarse-grained structure of the windows, while the relationships among the widgets are related to the fine-grained structure of the window. 2. The complete reverse engineering transformation chain is executed for the given window to obtain a CUI model. This CUI model is used to execute an additional generation step in order to obtain a Java Swing GUI, which uses the layout discovered. 3. The GUI generated is now assessed by the same person and using the same criteria as in step 1, and is compared with the data gathered from the original window. The CUI model is also analysed in order to avoid that mistakes in the Java Swing generator could mislead the evaluation, since in some cases the generated GUI had layout mistakes because of bugs in the Swing template. Two main metrics are obtained in the evaluation process for each window: – Parts laid out OK. For a part to be correct, it must contain the same widgets and it must be located in the same place as the original window. – Widgets laid out OK. The widgets within each part are analysed, by counting which widgets are located in the right place with regard to the container part and other widgets, also taking into account their alignment. The criteria used to assess both the original and the generated windows are obviously subjective. In order to reduce the inconsistencies between the results, the evaluation of all the windows has been performed by the same person. 15% of the windows (with a range of complexity) were also evaluated by a second member of our team to check whether his evaluation matches to a great extent with the one carried out by the main evaluator. This aims at ensuring that the main evaluator has not introduced a strong systematic bias. 6.2 Evaluation results The results of the evaluation of the two case studies are summarised in Table 2 and Table 3. In order to show the scalability of our approach we have classified the windows used in the evaluation into three groups, according to the number of widgets involved. As can be observed, there are a large number of small windows in both cases (63.55% for the case study A and 66.67% for the case study B) which are used as dialogs, for example, to perform searches based on certain criteria. Almost 20% of the windows in the case study A are large (an average of 86 widgets/window), and commonly use tabbed panels to arrange the widgets (an average of 4.24 canvases/window). In contrast, the case study B contains more medium-size windows (28.07%) and a few large windows (5.26%). Figures 17 and 18 show the dispersion of the success rate (as a percentage) of our approach when identifying parts for both case studies, and Figures
Model-Driven Reverse Engineering of Legacy Graphical User Interfaces
Total amount of windows Windows of each type (out of the total) Total canvases Canvas/window average Widgets/window average Parts/window average Parts laid out OK Widgets laid out OK
Large (>60) 21 19.63% 89 4.24 86.00 10.18 83.24% 87.14%
33
Medium (20 - 60) 18 16.82% 19 1.06 36.43 3.14 98.06% 85.61%
Small (