2011 International Conference on Advances in Social Networks Analysis and Mining
Modeling Socialness in Dynamic Social Networks Tuan-Anh Hoang, Ee-Peng Lim, Palakorn Achananuparp, Jing Jiang
Loo-Nin Teow
School of Information Systems DSO National Laboratories, Singapore Singapore Management University Email:
[email protected] Email:
[email protected],{palakorn,eplim,jingjiang}@smu.edu.sg
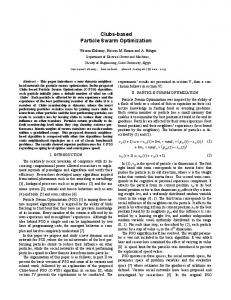
in the same social events or using the same social products, people who have not known each other before will more likely be friends. The ability to determine socialness of entities is important to many applications. In marketing, it is important to identify social products that may sell better. In event organization, one needs to know which events are good at bringing people together. In social computing research, socialness may provide additional insights into patterns of item adoption and the process of diffusion. High socialness items may be adopted faster, and thus diffuse faster than low socialness ones. The task of recommendation in social network also can benefit from socialness when one may introduce social items to users who want to improve their social skills. Motivated by above considerations, our work aims to answer the question that whether we can measure the socialness quantitatively. We want to design models that can compute the socialness values of items. In our approach, we believe that the socialness of an item depends on the communities which its adopters belong to. In this paper, we therefore consider the following problem. ”Given a set of communities and a set of entities (items) followed by their adopters, determine the socialness of entities” Different from most previous research on item adoption in social networks which mainly focuses on item adoption and diffusion at user level, our proposed model works at community level studying socialness of items from the community’s point of view. This brings the problem more challenges as follows. • The information about community structure is not always explicitly known. We therefore have to firstly identify communities based on network structure and user interaction. • Although the socialness of an item depends on the nature of its adopters’ communities, this relationship is not obvious since the item’s adopters are from several communities which are different from one another. • There is no ground truth for comparison due to a lack of previous research on this theme. To deal with above challenges, we adopt a modeling framework shown in Figure 1. In this framework, we first employ a clustering algorithm to detect communities. We then apply some model to measure socialness of items based on the community users adopting the items. Using the model, we measure
Abstract—Socialness refers to the ability to elicit social interaction and social links among people. It is a concept often associated with individuals. Although there are tangible benefits in socialness, there is little research in its modeling. In this paper, we study socialness as a property that can be associated with items, beyond its traditional association with people. We aim to model an item’s socialness as a quantitative measure based on the how popular the item is adopted by members of multiple communities. We propose two socialness models, namely Basic and Mutual Dependency, to compute item socialness based on different sets of principles. In developing the Mutual Dependency Model, we demonstrate that items’ socialness can be related to the socialness of communities. Our model have been evaluated on a set of users and application items from a mobile social network. We also conducted experiments to study how socialness can be related to network effects such as homophily, social influence and friendship formation.
I. I NTRODUCTION Socialness or sociability refers to the quality or state of being social. It is a concept often associated with people who are good at making friends and interesting interactions with others. They have strong social skills, e.g., ability to please and entertain others, well versed in pop culture, etc. We often call such individuals socialites. Individuals with high socialness are potentially the ones liked by many, and conversely, they often like enjoy communicating with others. With such personality, such individuals are easier to gain recognition within their communities and potentially assume leadership positions. In this paper, we seek to go beyond socialness as a property of individuals. We would like to associate socialness with any form of entities through their adoption by people from the community. Just as sociable people, a physical or abstract item is sociable if it can solicit social interactions and help to foster social relationships. While there is little formal research on social entities, examples of social entities are many. Social media sites are generally more sociable than university homepages; football as a sport is more sociable than swimming; and a multi-player online game is more sociable than a simple tictat-toe. On the other hand, social items are ways to reveal the socialness of people by mean that social people like to adopt social items than others, e.g. they likely more interest in using social communication products and participating in social events than using traditional communication media and taking part in formal meetings. Another motivation to study item socialnees is that high socialness items may reinforce the social network by encouraging communication and relationship creation between their adopters. Through taking part 978-0-7695-4375-8/11 $26.00 © 2011 IEEE DOI 10.1109/ASONAM.2011.91
344
item socialness for all items in the network. To evaluate the proposed model, we consider the correlation between the item socialness with phenomenon which is believed to demonstrate social aspects of items. Community Discovery
Socialness Modeling
needs and socializing as the main goal of software design. Kurvinen, Koskinen and Battarbee introduced a set of design principles for making software design conducive for social interaction [8]. Forlizzi, in [3], proposed a set of qualitative design factors and principles known as product ecology to design products that can evoke social behaviors. The above work however does not give quantitative measure for social products which is the main objective of this paper. The research of item adoption and diffusion in network has a long history which focuses on the diffusion of item adoptions within the network structure while ignoring the properties of items being diffused. This topic of research is also known as diffusion of innovations. Social scientists and economists had proposed qualitative models which have been covered in the survey by Strang and Soule [12] and the book by Valente [14]. Quantitative models, on the other hand, had been developed at both the macro and micro levels. They have been summarized in [2]. Unlike the previous works that treat all items the same, our research looks into the different socialness of items. We aim to explain item adoption and diffusion by considering not only network structure but also item characteristics.
Evaluation of Socialness
Fig. 1: Socialness modeling framework. Socialness modeling is a new topic in computational social research. To the best of our knowledge, there has not been any work on modeling socialness in social network. Our main contributions in this paper are as follows. • We propose a novel quantitative socialness modeling framework which utilizes community information to measure socialness. We also propose two models using basic and mutual dependency principles. • We apply these models on a real mobile social network known as myGamma. The dataset contains both messages and friendship links between users. Socialness of items and communities are quantitatively measured and evaluated using this dataset. • We finally show that our socialness measures has strong correlations with social effects related to friendship links creation and influenced item adoption in social network. In the rest of this paper, we first cover the related work in Section II. Our proposed socialness models (Basic and Mutual Dependency Models) and the computation of item socialness using myGamma datatset are described in Sections III and IV respectively. Section V presents our experimental results to evaluated the two proposed models. Finally, we conclude in Section VI.
III. S OCIALNESS M ODELS In this section, we introduce two models for measuring the socialness of items. Each model follows a different set of principles, and assigns a numerical value between 0 and 1 to each item corresponding to smallest and largest socialness values respectively. We first give model definitions which use a standard set of notations shown in Table I. Both models use iscore(xi ) to denote the socialness value of an item xi . TABLE I: Notations. X C U M = |X| N = |C| P = |U | Q U (xi ) U (cj ) C(uk ) iscore(xi ) csore(cj )
II. R ELATED W ORK Preece described sociability and usability as two factors contributing to the success of online communities[11]. The sociability factor can be determined through several attributes, e.g., number of messages, amount of on-topic discussions, interactivity, reciprocity, quality of contribution, etc. Although the paper does not propose an overall sociability measure for a given community, it makes the observation that different communities may demonstrate different extent of sociability. In our research, we offer a specific sociability measure of community based on the general notion of item adoptions where items can be topics at different granularity levels, usage of services of different types (e.g., messaging), or interactions of different types (e.g., reciprocity) such that different items demonstrate different sociability. Recognizing socialness as a property of item is a very new idea and there are very few relevant works in the product or software design domain. The traditional computer supported cooperative work (CSCW) focuses on software systems as items to support multiple individuals working together to complete specific tasks related to their work or organization they belong to [6]. CSCW does not treat social interaction
set of items set of communities set of users number of items number of communities number of users number of mutual friendship links set of users who adopted item xi set of users in community cj community/cluster of user uk social score of item xi social score of community cj
A. Basic Model The simplest approach to measure socialness of an item is to determine the proportion of communities having at least |{c :U(xi )∩U(cj )6=∅}| one user adopting the item, i.e., j . There is |C| however a shortcoming in this approach. Firstly, the number of users adopting the item varies among communities. A community having a single user adopting the item should not contribute as much to socialness of the item as another community having many users adopting the item. In other words, we should use |U (xi ) ∩ U (cj )| as a weight for the community cj .
345
by the proportion of adopters of xi in the communities. In a similar way, cscorem (cj ) is derived from the socialness of items with adopters belonging to community cj weighted by the proportion of members of cj adopting the items. The mutual dependency model is very much similar to the |U(xi )∩U(cj )| and HITS model[7] except the additional weights |U(cj )|
We therefore define a Basic Model to measure socialness of an item xi by taking the average proportion between users adopting xi and users of different communities cj ’s. That is, iscoreb (xi ) =
N 1 X |U (xi ) ∩ U (cj )| N j=1 |U (cj )|
(1)
|U(xi )∩U(cj )| . |U(xi )|
|U(x )∩U(c )|
i j Note that the expression returns zero when there |U(cj )| is no overlap between the community members and item adopters, and one when the two subsets are identical. The socialness score is thus a value between 0 and 1.
Community socialness in Basic Model. To compare with Mutual Dependency Model, we can also introduce a community socialness definition to the Basic Model similar to the way item socialness is defined. Here, communities of high socialness are the ones with many users adopting different items. M 1 X |U (xi ) ∩ U (cj )| cscoreb (cj ) = (4) M i=1 |U (xi )|
B. Mutual Dependency Model Basic model is conceptually simple and computationally efficient. It assumes all communities to be of the same kind, and any two communities contribute to item socialness the same way as long as they have the same proportion of overlap with the item adopters. This assumption nevertheless does not always hold. Let us consider the following scenario. Suppose communities cclub and ccom represent a group of university club members and a group of company employees respectively, and cclub and ccom have the same overlap proportion with adopters of a target item. We would think cclub should contribute more to the item’s socialness as its members are likely to adopt the item for social purposes. Members of ccom may on the other hand adopt the target item for other reasons, e.g., direction from their superior, or requirement of some assigned tasks. Model definition. We thus propose a new model that involves differentiating the communities created for social purposes from those for less social purposes. This is made possible by assigning socialness values to communities using the following mutual dependency principles that relate the socialness of items with that of communities: • Items with high socialness are the ones adopted by large proportions of members of communities with high socialness; and • Communities with high socialness are the ones that adopt large proportions of adopters of items with high socialness. According to the principles, an item’s socialness depends on the socialness of communities with members adopting the item. The reverse can be said about the socialness of a community. The above two principles lead us to the following Mutual Dependency Model: iscorem (xi ) =
N X
cscorem (cj ) ·
|U (xi ) ∩ U (cj )| |U (cj )|
(2)
iscorem (xi ) ·
|U (xi ) ∩ U (cj )| |U (xi )|
(3)
j=1
cscorem (cj ) =
M X i=1
Matrix Formulation of Mutual Dependency Model. Formally, we use a matrix formulation below to express the above socialness definitions. VI = (iscorem (x1 ), . . . , iscorem (xM ))T
(5)
VC = (cscorem (c1 ), . . . , cscorem (cN ))T
(6)
W = (wij )M×N where wij = Z = (zij )M×N where zij =
|U (xi ) ∩ U (cj )| |U (cj )|
|U (xi ) ∩ U (cj )| |U (xi )|
(7) (8)
Then, we have the following system of equations: VI = W · VC
(9)
VC = Z T · VI
(10)
By replacing VC in Equation 9 by Equation 10, we obtain: VI = W · Z T · VI
(11)
In other words, VI is the principal eigenvector of W · Z T . Similarly, we can derive that VC is the principal eigenvector of Z T · W . To compute VI and VC simultaneously, we employ the iterative power method[5]. We first initialize VI by assigning random values to all its elements. Then, we compute VP its elements C by Equation 10 and Pnormalize N N such that j=1 cscorem (cj ) = j=1 cscoreb (cj ). VC is in turn used to compute new values of VI by Equation 9. Normalization of VI P elements is then performed, that is, PM M i=1 iscorem (xi ) = j=1 iscoreb (xi ). The normalization is done to ensure we preserve the total socialness in the equation system as well as to allow us to compare the socialness between the basic and mutual dependency models. The new item socialness values are in turn used to compute a new set of community socialness values and the process repeats until all socialness values converge. In our experiments, we assume convergence is achieved when the Euclidean distance between the socialness vector of two consecutive iterations is less than 10−16 .
In the above formulation, the socialness of community cj , cscorem (cj ), is defined and used in the definition of item socialness. The iscorem (xi ) of an item xi is derived from the socialness of communities with members adopting xi weighted
346
TABLE II: Dataset statistics. Users Friendship links Applications Appln adoptions Chat sessions
IV. S OCIALNESS
IN A
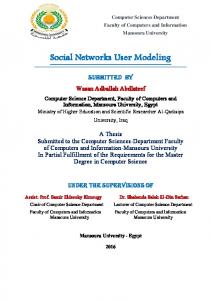
myGamma allows users to form groups themselves for sharing messages. Many groups however are non-active and they do not represent communities well. We therefore chose to discover communities from the dataset by applying modularitybased clustering. Modularity, proposed by Newman[10], is an objective function that measures the quality of cluster results of a network. Given a network of P nodes represented by an adjacent matrix A = (akl )P ×P where akl is the weight of the edge between node k and node l if such an edge exists or 0 otherwise, the modularity of a cluster result C, q(C), is defined as: 1 X deg(uk ) · deg(ul ) q(C) = (akl − )·δ(C(uk ), C(ul )) 2Q 2Q uk ,ul ∈U (12) P PP where Q = P a denotes the sum of weight of ij i=1 j=i+1 all edges in the network, U denotes the set of users, C(uk ) denotes the cluster (∈ C) of user uk , deg(uk ) denotes the degree of user uk , i.e., sum of weight of all edges adjacent to uk , and δ(C(uk ), C(ul )) is Kronecker delta function, i.e., δ(C(uk ), C(ul )) = 1 if C(uk ) = C(ul ), and = 0 otherwise. q(C) falls within the range [−1, 1], and the larger q(C) the better is the result clusters C. The problem of maximizing q(C) is known to be N P − hard[13]. Newman et. al proposed some heuristic and approximate algorithms including a top-down algorithm that removes the most betweenness edge one at a time[10], another bottomup algorithm that merges local best pair of subsets of nodes [1], and the spectral method that divides the network into two sub-networks based on the sign of elements in second largest eigenvector of the adjacent matrix[9]. The spectral method has a low computational cost but does not guarantee the nodes in every cluster to be connected[4]. Therefore, in our work, we choose the agglomerative method as described in [1] to determine clusters as communities. We performed modularity-based clustering and removed clusters with less than three nodes. We obtained 134 communities with size distribution given in Figure 2. The figure shows that most communities are small. The largest community consists of more than 20,000 users.
74,445 939,160 74 1,196,011 5,765,006
M OBILE S OCIAL N ETWORK
In this section, we apply our proposed socialness models on a real mobile social network known as myGamma1. Before that, we need to induce a new network that is based on mutual friendship links and messaging interaction among users. Based on the induced network, we detect communities in the network. We then analyze the distribution of socialness of items and communities in this network, and identify the high social items and communities. A. Dataset MyGamma is a well established mobile social networking site that supports friendship linking, messaging, and application adoptions. Most myGamma users are young adults between the age of 20 to 30. The network data we used for measuring socialness comes from a 100-week period of interaction starting from September 17th , 2008. We first selected a set of users such that every user has at least one mutual friendship link with another user in the set. This resulted in a set of 74, 445 users with 939, 160 mutual friendship links among them. The items considered are the 74 simple applications which users can sign up or adopt. These include games, chat, calculator and other software which can be used without charges. The dataset also keeps the timestamp of every friendship creation or application adoption. Table II summarizes the statistics of the extracted dataset. B. Network Construction and Community Detection We induced from the myGamma dataset a network consisting of 74,445 users and 939, 160 mutual friendship links. Each link is weighted by the number of chat sessions between the two linked users. This resulted in a network of 384 connected components with a giant component including 99% number of nodes. On the other hand, there are 351 connected components of size 2. The size distribution of the connected components is given in Table III.
70 60 50
Size 73633 6 4 3 2
# Communities
TABLE III: Connected component size distribution Number of components 1 3 5 24 351
40 30 20 10 0 3
We next determine communities in this network such that users within a community interact with one another more frequently than with those outside the community. Actually,
4
5
6
7
8
9
Community Size
Fig. 2: Community size distribution.
1 http://m.mygamma.com
347
>=10
Community Socialness (Basic)
C. Socialness Distribution
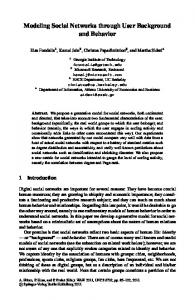
Item Socialness (Basic)
Based on the communities obtained from clustering the friendship network and the set of applications adopted by users in our myGamma dataset, we compute both item and community socialness using both Basic Model and Mutual Dependency Model. Item Socialness. We first examine the item (application) socialness values derived by the two models in a scatterplot shown in Figure 3. Each point in the scatterplot represents an application with two item socialness values, one by Basic Model and another by Mutual Dependency (MD) Model. The figure shows that both models produce quite similar but not identical item socialness values. The pairs of item socialness values by the two models do not fall exactly on the diagonal dash line.
0.14 Community 17
0.12 0.1 0.08 0.06 Community 24
0.04 0.02
Community 47
0 0
0.02 0.04 0.06 0.08 0.1
0.12
Community Socialness (MD)
Fig. 4: Community socialness (Basic vs Mutual Dependency)
’Em Up” constitute major proportions of more socialness communities.
0.25 0.2
TABLE IV: Top items by social score. 0.15
Application Name Gifts Hug Me Tarot Card Funky Pix Love Calculator Text Translator E-Cards MSN.Live.Yahoo Chat Fortune Cookie myGamma Forum Blow ’Em Up
0.1 0.05 0 0
0.05
0.1
0.15
0.2
0.25
Item Socialness (MD) . Fig. 3: Item Socialness (Basic vs Mutual Dependency)
Community Socialness. Figure 4 depicts the community socialness values derived by Basic and MD Models. Again, most socialness values are very small. Unlike in the case of item socialness, the Basic and MD Models are more different in community socialness scoring. Items receiving similar scores from both models have near zero socialness, i.e., they are non-social. MD Model assigns community 24 a very high socialness value (0.101, rank 1) while Basic Model assigns it a lower socialness value (0.039, rank 3). Community 17, on the other hand, is assigned non-zero socialness value (0.012, rank 7) by MD Model but 0.121 (rank 1) by Basic Model.
Rankb 1 2 3 4 5 6 7 8 9 10 11
iscoreb 0.225 0.207 0.117 0.100 0.071 0.056 0.052 0.044 0.041 0.033 0.032
Rankm 2 1 3 4 5 10 7 9 11 8 6
iscorem 0.194 0.235 0.094 0.093 0.066 0.046 0.053 0.048 0.034 0.050 0.055
TABLE V: “Text Translator” vs “Blow ’Em up”. Blow ’Em Up Top 3 Communities Community 20 Community 10 Community 39
% adopters, Rankm 60%, 20 50%, 21 50%, 18
Text Translator Top 3 Communities Community 102 Community 125 Community 36
% adopters, Rankm 67%, 48 50%, 27 40%, 24
Table VI lists the top 10 socialness communities by Basic Model and top 10 socialness communities by Mutual Dependency Model. As shown in the table, the two models share the same top 10 communities although their rank orders are somewhat different. Community 17 and Community 24 are ranked 1st and 3rd respectively by Basic Model but 7th and 1st respectively by Mutual Dependency Model. This difference is due to the reason that the socialness of items adopted by Community 17 is lower than that adopted by Community 24. Table VII shows that Community 17 has all members of low socialness applications such as “FriendsProfileAlbert”, “GroupsAlbert”, and “TestAboutAlbert” joining the community. On the other hand, Community 24 has 17% to 18% of adopters of high socialness applications joining the community. Hence, the Mutual Dependency Model assigns higher socialness value to Community 24.
D. Top Items and Communities The top 10 socialness items by Basic Model and top 10 socialness items by Mutual Dependency Model are shown in Table IV. The table shows that most of the top ranked socialness items are similar between the two models. 9 out of 10 top items are common between the models. Two applications, “Text Translator” and “Blow ’Em Up”, are ranked more differently. To examine the two applications further, we enumerate the top 3 communities with highest proportion adopters for each application as shown in Table V. We found the adopters of “Text Translator” constitute major proportions of less socialness communities while item adopters of “Blow
348
TABLE VI: Top communities by social score. Community ID 17 5 24 1 47 33 23 18 7 26
Rankb 1 2 3 4 5 6 7 8 9 10
cscoreb 0.121 0.095 0.039 0.029 0.018 0.009 0.006 0.003 0.002 0.002
Rankm 7 2 1 4 3 5 6 8 9 10
socialness applications are more likely to form friendship links. To verify this, we evaluate the Pearson rank correlation between socialness values of applications and the number of homophily links as shown in Table VIII. As shown in the first row of Table VIII, the rank correlation values show that the number of homophily links formed in the 20-week period is highly correlated with the number of item adopters during the 100-week period. The rank correlations between item socialness, for both Basic and Mutual Dependency models, are also very high with the correlation scores (0.851 and 0.852) slightly higher than that of number of item adopters (0.829). The Mutual Dependency model has marginally higher correlation than the Basic Model. These results suggest the high socialness items have a significant contribution to fostering friendship links between their adopters.
cscorem 0.012 0.087 0.101 0.029 0.041 0.021 0.014 0.007 0.005 0.003
TABLE VII: Community 17 vs Community 24. Community 17 Top 3 Items FriendsProfileAlbert GroupsAlbert TestAboutAlbert
% members, Rankm 100%, 38 100%, 38 100%, 38
V. S OCIALNESS
AND
Community 24 Top 3 Items E-Cards Gamma Hoops Fortune Cookie
% members, Rankm 18%, 7 17%, 22 17%, 11
TABLE VIII: Pearson Rank Correlation between item socialness and homophily links. Item Socialness # homophily links # social influence adoptions
N ETWORK E FFECTS
As its name suggests, we hypothesize that social items have some relationship with network effects that are found in the social network. In this section, we present the results of studying the correlation between the socialness of items and two network effects: the formation of friendship links due to homophily, and the adoptions between users and items by social influence. Homophily refers the tendency of individuals to establish friendship links with others with high similarity. In our context, a homophily link is a mutual friendship link that is created after its two users adopt a common item. Social influence, on the other hand, refers to the tendency of a user adopting an item after one or more friend adopts the same item. Homophily and social influence effects are important topics in network research and separating the two effects is known to be extremely difficult. In this paper, we simply assume the two effects to be independent and examine their correlation between socialness. In this section, we use the socialness values of applications and communities computed in Section III. To examine how the item and community socialness are related to homophily and social influence, we use 20 additional weeks of myGamma data after those used in Section IV-A. New users, their friendship links and application adoptions created in this new time period are however excluded from the study as we want to focus on the effect on known users and applications. In this new time period, we observe 67,723 new application adoptions by users, and 248,076 new friendship links among the users.
# Adopters 0.829 0.826
Basic Model 0.851 0.850
MD Model 0.852 0.850
Item socialness and social influence. The second row of Table VIII shows the correlation between item socialness and number of social influence adoptions. Social influence adoption refers to an item adoption by one user after her friend has adopted the same item. We examine the correlation between the number of social influence adoptions in the 20week period and item socialness. We also include item ranking based on number of adopters in the 20-week period for comparison. The results show that number of social influence adoptions is slightly highly correlated with all three ways of ranking items. Item socialness appears to enjoy slightly higher correlation. Item socialness and time to reach k new adopters. We next examine the rank correlation between item socialness and the time required for an item to reach k new adopters. The purpose is to examine if a high socialness item will reach k adopters sooner than the low socialness ones. We experiment with k = 100, 200, 500, and 1000 and the results are shown in Table IX. The results show high correlation exists between item socialness and time to reach k adopter. These correlation scores are slightly higher than that involving number of adopters (during 20-week period). Furthermore, we observe little difference between Basic and Mutual Dependency models in the results. TABLE IX: Pearson Rank Correlation between item socialness and time to reach k adopters.
A. Item Socialness
k= # Adopters Item Socialness (Basic) Item Socialness (MD)
Item socialness and homophily. For each application, we count the number of homophily links among the item adopters during the new 20-week period. These are the mutual friendship links which are created after the users co-adopt some applications. We envisage that users who co-adopt high
349
100 0.829 0.849 0.849
200 0.835 0.854 0.854
500 0.829 0.848 0.849
1000 0.807 0.822 0.825
B. Community Socialness
correlation exists between socialness and social effects. As part of the future work, we will further extend the framework to model the socialness of not only items and communities but also users and explore the social factors underlying item diffusion in a social network.
Community socialness and friendship formation. As our communities are obtained from an induced friendship network, the membership (or community adoption) is static. Hence, we are not able to determine homophily links due to co-adopting a community nor social influence adoptions due to friends adopting a community. We therefore turn to evaluating the correlation between community socialness and friendship formation. Table X shows the Pearson rank correlation between number of friendships formed during the 20-week period and the community socialness. The results indicate that both Basic and Mutual Dependency Models have positive correlation with number of new friendships formed, and the latter has slightly higher correlation.
ACKNOWLEDGMENT This work is supported by the Singapore’s DSO National Labs research grant (number: DSOCL08276). R EFERENCES [1] A. Clauset, M. Newman, and C. Moore. Finding community structure in very large networks. Phys. Rev. E, 70, 2004. [2] J. K. D. Easley. Networks, Crowds, and Markets: Reasoning About a Highly Connected World. Cambridge University Press, 2010. [3] J. Forlizzi. The product ecology: Understanding social product use and supporting design culture. International Journal of Design, 2(1):11–20, 2008. [4] S. Fortunato and M. Barthlemy. Resolution limit in community detection. Proc. Natl. Acad. Sci. USA, 20(2):8577–8582, 2006. [5] G. H. Golub and C. F. V. Loan. Matrix Computations, 3th Edition. Johns Hopkins University Press, 1996. [6] J. Grudin. Computer-supported cooperative work: History and focus. Computer, 27(5):19–26, 1994. [7] J. Kleinberg. Authoritative sources in a hyperlinked environment. Journal of ACM, 46:604–632, 1999. [8] E. Kurvinen, I. Koskinen, and K. Battarbee. Prototyping social interaction. Design Issues, 2(3):46–57, 2008. [9] M. E. J. Newman. Finding community structure in networks using the eigenvectors of matrices. Phys. Rev. E, 74, 2006. [10] M. E. J. Newman. Modularity and community structure in networks. Proc. Natl. Acad. Sci. USA, pages 8577–8582, 2006. [11] J. Preece. Sociability and usability: Twenty years of chatting online. Behavior and Information Technology Journal, 20(5):347–356, 2001. [12] D. Strang and S. Soule. Diffusion in organizations and social movements: From hybrid corn to poison pills. Proc. Natl. Acad. Sci. USA, 20(2):8577–8582, 2006. [13] M. G. R. G. M. H. Z. N. D. W. Ulrik Brandes, Daniel Delling. On modularity clustering. IEEE Trans. Knowledge and Data Engineering, 20(2):8577–8582, 2008. [14] T. Valente. Network Models of the Diffusion of Innovations. Hampton Press, 1995.
TABLE X: Pearson Rank Correlation between community socialness and new friendships. Community Socialness # new friendships
Basic Model 0.527
Mutual Dependency Model 0.529
Community socialness and time to reach k% new friendships. We now evaluate the rank correlation between community socialness and the time required for a community to reach k new friendships among its members during the 20week period. Recall that community membership is static but people in the community can still make friendships among themselves. We want to tell if a high socialness community will have k% friendships formed sooner than the low socialness ones. The percentage of friendships is obtained by dividing the number of new friendship links by total number of friendships not found in the 100-week period. We experiment with k = 0.0001%, and 0.0002% and the results are shown in Table XI. The results show high correlation (> 0.50) exists between community socialness and time to reach k% new friendships. Again, the difference between Basic and Mutual Dependency Models is very minor. TABLE XI: Pearson Rank Correlation between community socialness and time to reach k% friendships. k= Community Socialness (Basic) Community Socialness (MD)
0.0001% 0.530 0.530
0.0002% 0.525 0.526
VI. C ONCLUSIONS We propose a novel framework to model the socialness in social network. The basic model measures the socialness purely based on the presence of associated community while the mutual dependency model exploits the dependency between the socialness of items and communities. We evaluate the socialness models on a real mobile social network with users linking with one another by friendships and adopting applications. Using the data, we measure the correlation between socialness and two social effects, namely homophily and influenced adoptions. Our experiments show that strong
350