Modified Testing Procedure for the Two Parameter Fracture
Model for Concrete
Daniel C. Jansen&, W. Jason Weiss#, and Stefan H. F. Schleuchardt+ &
Asst. Prof., Dept. of Civil and Env. Engr., Tufts Univ.,
[email protected] Asst. Prof., Dept. of Civil Engr., Purdue Univ.,
[email protected] + Civil Engineer, Wörner und Partner, Darmstadt, Germany,
[email protected] #
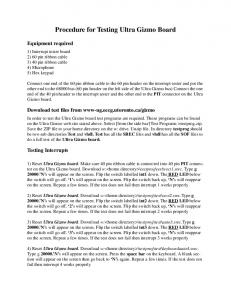
INTRODUCTION Cement-based materials exhibit pre-peak crack growth, therefore linear elastic fracture mechanics cannot be directly applied to these materials. Several experimental and theoretical approaches have been developed over the last two decades to determine reliable parameters that characterize the behavior of the cementitous systems and account for the development of the fracture process zone.1-6 Despite the existence of several recommended procedures, research continues to develop a standardized test procedure that is accurate, requires relatively few samples, is reasonably accurate, and does not require a great deal of specialty test equipment. One method which has been developed to account for the precritical crack growth is the Two-Parameter Fracture Method (TPFM)2 which is based on the simple premise that a change in specimen compliance can be correlated to the length of the effective crack at the time the critical (i.e., peak) load is reached. Despite this simple approach, it is difficult to unload the specimens exactly at the peak load and as a result the current RILEM draft recommendation7 suggests unloading when the load decreases to 95% of the maximum load. While this procedure has several advantages related to the use of one specimen, three potential concerns result. First, the crack can extend between the time the peak load is reached and the time of unloading resulting in larger measured change in compliance than that associated with the change exactly at peak load, which in turn would result in an overestimation of KIC and CTODC. Second, the rapid decrease in strength immediately after peak load in highly brittle materials, such as paste or high strength concrete, make it extremely difficult to initiate unloading at exactly 95% of the peak load. Third, the response rate dependency of the testing equipment may result in differences between the measurements taken between different laboratories. This paper focuses on a modification to the existing TPFM which provides systematic methods for determining unloading compliance that better correspond to the unloading compliance and thereby eliminating these three concerns. BACKGROUND Although it is possible to use a number of specimen geometries to perform the TPFM, a center point loaded notched beam was used in this investigation, as shown in the inset of Figure 1. As the specimen is loaded, the compliance of the pre-peak load versus crack mouth opening displacement (initial compliance, CI) is measured. Using this initial compliance, CI, and the initial crack length, ao, the elastic modulus, E, of the concrete can be determined. After the specimen reaches the peak load, it is unloaded (at 95% of the peak load) and the compliance of the unloading response, Cu, is determined (see Figure 1). The critical effective crack length, ae, is determined using an iterative based on the unloading compliance, CU, and the elastic modulus, E. The fracture
toughness, KIC, and the critical crack tip opening displacement, CTODC, are determined from the critical effective crack length, ae, and the peak load, LoadC. 4 C
First Unloading
Initial Loading
Peak Point (CMOD , Load )
Second Unloading
Third Unloading
C
1
3 Ci
1 CU2
CU1
1
1 C
U3
2
C
Load (kN)
uc
1
1
Load
0
Thickness = 50.8 mm 127 mm a0
-1
Focal Point (CMOD , Load ) f
-2
-0.02
0.00
f
0.02
ae CMOD
508 mm 559 mm
0.04
0.06
CMOD (mm)
Figure 1. Load vs. CMOD and Compliance Definitions One potential drawback of using the TPFM is that it requires closed-loop testing equipment. To overcome this limitation, Tang et al.4 proposed an alternative method for determining KIC and CTODC requiring only the peak loads from two or more geometrically dissimilar specimens (i.e., different notch lengths or loading conditions). With this method at least two tests must be performed instead of one since the KIC is determined which causes the smallest standard deviation in the CTODC. In addition, the elastic modulus can be taken from compression tests, from the initial compliance (if measured), or by estimation, however the elastic modulus may not be the same in tension as in compression due to bond between cement paste and aggregates.8 While the TPFM and the PLM should provide similar results, the TPFM sometimes gives higher values due to crack extension after the peak load.9 Recently, Lee and Willam10 re-illustrated the idea that the unloading stress-strain response can be extended to meet at a unique focal point. Lee and Willam's10 tests were performed on concrete cylinders tested in compression, and the identified focal point could be used for assessing the change in stiffness from this point and the load displacement curve. Using these results, Tasdemir et al.11 demonstrated that multiple unloading response for load-deflection and load-CMOD curves from notched beam tests also meet at a mutual focal point (a similar load-CMOD is shown in Figure 1). This implies that changes in compliance can be determined for a beam specimen at any point on the load-CMOD response thereby implying that the length of the effective crack can
be determined at any point along a load-CMOD curve provided the focal point of the material is known. This paper will take advantage of this feature to suggest an improvement to the TPFM. PROPOSED METHODS This section outlines potential procedures for accurately determining the compliance corresponding to the case where the load is removed exactly at the point of peak load. The focal point method is proposed to improve the implementation of the TPFM. Determination of the focal point will be divided into two methods, Focal Point Method I and Focal Point method II, to provide a correction to determine a new unloading compliance. Once the ‘true’unloading compliance is known, KIC and CTODC can be determined using the same procedure as in the current TPFM.2,7 Focal Point Method I Focal Point Method I finds the focal point based on the three unloading compliances during the post-peak as illustrated in Figure 1. The focal point is determined by the centroid of the triangle defined by the three unloading lines.12 A line is extended from the focal point back to the peak load (see Figure 1) from which the unloading compliance corresponding to the peak load, Cuc, is found. Focal Point Method II Focal Point Method II finds the focal point from the intersection of the loading compliance and the first unloading compliance during the post-peak as illustrated in Figure 1. As with Focal Point Method I, a line is extended from the focal point back to the peak load (see Figure 1) from which the unloading compliance corresponding to the peak load, Cuc, is found. EXPERIMENTAL VERIFICATION Experimental Program To compare the four methods described, 15 mortar notched beam specimens were tested.12 In addition, 5 cylinders, 102 mm diameter by 203 mm long, were tested in compression. The water:cement:sand ratio for the mortar was 0.50 : 1.00 : 3.00. All specimens were tested between 32 and 33 days after casting. From the cylinder tests, the compressive strength of the mortar was determined to be 41.4±1.4 MPa and the modulus of elasticity, EC, was 25.4±0.7 GPa. The dimensions of the beams which were tested are shown in Figure 1. Notches were cast into the beams; 4 different initial notch lengths were used (12.7 mm, 25.4 mm, 43.1 mm, and 50.8 mm) corresponding to 10, 20, 30 and 40% of the beam depth. The notched beams were tested using a 100 kN closed-loop servo-hydraulic test machine. To measure the crack mouth opening displacement, two ±0.5 mm LVDTs were attached to the sides of the specimen level with the crack mouth. The average signal from the two LVDTs was used as the feedback control and recorded as CMOD. The tests were performed at a CMOD rate of 0.0004 mm/second and data was recorded at a rate of 1 Hz throughout the test. Each specimen was unloaded 3 times and the points at which unloading occurred were manually signaled to the test machine. A summary of the specimens, unloading history, and notch lengths is provided in Table 1.
Data Analysis and Results The data was analyzed to determine KIC and CTODC by the four methods described above: 1) the Two Parameter Fracture Method2,7, 2) the Peak Load Method4, 3) Focal Point Method I, and 4) Focal Point Method II. With the TPFM, only the compliance from the first unloading was used. With the peak load method, all specimens were included in the analysis, and KIC and CTODC were determined to be 23.9 N/mm3/2 and 0.00571 mm, respectively. The unloading compliances that were used for the three methods (all except the Peak Load Method), are given in Table 1 along with the KIC and CTODC for each specimen. In calculating the mean and standard deviations for the TPFM, only results of specimens where the first unloading compliance started near 95% of the peak load (specimens M*A and M*D) are used. Comparison of Results Figure 2 provides a comparison of the KIC and CTODC results determined by each of the methods. The KIC and CTODC determined by Focal Point Method I are 12% and 38%, lower than the TPFM values, and the values determined by Focal Point Method II are reduced by 10 % and 33%, respectively. The results from the focal point method also corresponds more closely to the results from the peak load method than does the two parameter fracture method, as illustrated in Figure 2. These results are not unexpected. As discussed earlier, the crack extends significantly during the post-peak, and the TPFM uses this effective crack length when unloading takes place, ae, as the critical crack length in calculating KIC and CTODC. The longer crack lengths result in high reported values for KIC and CTODC. With the focal point corrections, KIC and CTODC are not significantly affected by the point at which the initial unloading takes place. 0.018
35
0.016
30
0.014 25
CTODC (mm)
3/2
KIC (N/mm )
0.012 20
15
0.010 0.008 0.006
10
0.004 5
0.002 0.000
0 Two Parameter Fracture Method
Peak Load Method
Focal Point Method I
a) KIC
Focal Point Method II
Two Parameter Fracture Method
Peak Load Method
Focal Point Method I
Focal Point Method II
b) CTODC
Figure 2. Comparison of Results from the Four Test Methods DISCUSSION AND CONCLUSIONS This paper suggests a modification to the TPFM that incorporates a focal point to determine the fracture properties of concrete that correct for crack extension that occurs after the peak load. The focal point was found using both the intersection of three
unloadings and the intersection of a single unloading compliance and the initial compliance and no significant difference was observed between these two approaches. These focal point methods extend the application of the existing TPFM by allowing the first unloading at nearly any point along the post-peak (above approximately 50% of the peak load). Implementation of this type of approach, can be used in conjunction with the existing RILEM method and requires only one additional step in the analysis process. In addition, operator controlled unloading is no longer needed and preset points of CMOD can be used to signal when unloading is to occur. ACKNOWLEDGEMENTS The third author thanks the Department of Civil and Environmental Engineering at Tufts University for partial support during his visit at Tufts from May to December 1997. REFERENCES 1.
Bazant, Z. P, "Size Effect in Blunt Fracture: Concrete, Rock, Metal," Journal of Engineering Mechanics, Vol. 110, 1984, pp. 518-535 2. Jenq, Y., and Shah, S. P., "Two Parameter Fracture Model for Concrete," Journal of Engineering Mechanics, Vol. 111, No. 10, Oct. 1985, pp. 1227-1241. 3. Hillerborg, A., Modeer, M., and Petersson, P.-E., "Analysis of Crack Formation and Crack Growth in Concrete by Means of Fracture Mechanics and Finite Elements", Cement and Concrete Research, Vol. 6, No. 6, Nov. 1976, pp. 773-782. 4. Tang, T., Ouyang, C., and Shah, S. P., "A Simple Method for Determining Material Fracture Parameters from Peak Loads," ACI Materials Journal, Vol., 93, No. 2, MarchApril, 1996, pp. 147-157. 5. Bazant, Z. P., and Li, Z., "Zero Brittleness Size Effect Method for One Size Fracture Tests of Concrete," Journal of Engineering Mechanics, ASCE, Vol. 122, No. 5, May 1996, pp. 458-468. 6. Nallathambi, P., and Karihaloo, B. L., "Determination of Specimen Size Independent Fracture Toughness of Plain Concrete," Magazine of Concrete Research, Vol. 38, No. 135, 1986, pp. 67-76. 7. RILEM Committee on Fracture Mechanics of Concrete-Test Methods, "Determination of the Fracture Parameters (KICS and CTODC) of Plain Concrete Using Three-Point Bend Tests on Notched Beams," Mat. and Str., Vol. 23, No. 138, 1990, pp. 457-460. 8. Jansen, D. C., Palmquist, S. M., Swan, C., Al-Mufarrej, D., Arya, B., and D'Annunzio, C. O., "Physical Properties of Concrete with Vitrified Coarse Aggregate," accepted for publication in ACI Mat. Journal. 9. Weiss, W. J., "Shrinkage Cracking in Restrained Concrete Slabs: Test Methods, Material Compositions, Shrinkage Reducing Admixtures and Theoretical Modeling," M.Sc. Thesis, Northwestern University, Evanston, IL, June 1997. 10. Lee, Y.-H., and Willam, K., "Mechanical Properties of Concrete in Uniaxial Compression," ACI Mat. Journal, Nov.-Dec. 1997, Vol. 94, No. 6, pp. 457-471. 11. Tasdemir, C., Tasdemir, M. A., Mills, N., Barr, B. I. G., Lydon, F. D., "Combined Effects of Silica Fume, Aggregate Type, and Size on Post Peak Response of Concrete in Bending," ACI Mat. Journ., Jan.-Feb. 1999, Vol. 96, No 1, pp 74-83. 12. Schleuchardt, S. H. F., "Modification of the Two-Parameter Fracture Model by Jenq and Shah," Diplomarbeit in partial fulfillment of the degree of Diplomingenieur, Technical University of Darmstadt, Germany, December 1998, 199 pp.
0.4 -
M4C Mean St. Dev.
3.60
1.55 -
1.59
1.61
1.94
2.01
2.13
2.04
2.77
2.86
2.39
2.46
3.70
3.63
84%
75% -
84%
95%
92%
75%
85%
98%
93%
74%
84%
99%
94%
74%
0.00220
0.01460 -
0.01290
0.01320
0.01000
0.00776
0.00779
0.00794
0.00460
0.00431
0.00474
0.00554
0.00227
0.00209
0.03560 -
0.02990
0.02670
0.01700
0.02650
0.01980
0.01390
0.00843
0.01880
0.01750
0.01280
0.00484
0.01090
0.01760 -
0.01940
0.02000
0.01390
0.01070
0.01230
0.01100
0.00651
0.00533
0.01040
0.01100
0.00342
0.00242
0.00349
0.00325
0.00436 0.00709
FPM I Cuc (mm/kN)
TPFM Cu1 (mm/kN)
0.01900 -
0.01910
0.02040
0.01410
0.01140
0.01240
0.01140
0.00666
0.00570
0.01010
0.01100
0.00347
0.00341
0.00357
0.00332
(35.1)* 29.6 1.5
(34.5)*
31.5
27.6
(40.8)*
(37.3)*
28.7
29.5
(48.1)*
(37.3)*
30.4
31.2
(46.2)*
(36.1)*
28.5
(0.0232)* 0.01380 0.00293
(0.0196)*
0.0170
0.0138
(0.0295)*
(0.0214)*
0.0122
0.0128
(0.0365)*
(0.0278)*
0.0185
0.0120
(0.0319)*
(0.0194)*
0.0103
CTODC (mm)
Two Parameter Fracture Method
FPM II KIC Cuc (mm/kN) (N/mm3/2)
Unloading Compliances
3/2
23.5 26.0 1.7
27.0
26.7
24.9
24.8
28.8
25.4
26.1
25.4
28.4
28.1
26.8
23.1
26.1
25.0
(N/mm )
KIC
0.00612 0.00854 0.00316
0.00978
0.01050
0.00940
0.00750
0.01040
0.00788
0.00807
0.00547
0.01440
0.01490
0.00690
0.00311
0.00724
0.00643
CTODC (mm)
Focal Point Method I
24.6 26.6 1.2
26.8
27.0
25.2
25.8
29.0
25.9
26.4
26.2
28.1
28.2
27.1
26.9
26.4
25.3
(N/mm3/2)
KIC
0.00796 0.00930 0.00252
0.00965
0.01090
0.00984
0.00878
0.01070
0.00855
0.00851
0.00664
0.01400
0.01510
0.00716
0.00745
0.00760
0.00671
CTODC (mm)
Focal Point Method II
*Specimens M*B and M*C were not used to calculate the mean and standard deviation for the Two Parameter Fracture Model because the first unloading did not occur near 95% of peak load.
0.4
0.4
M4A
M4B
0.3
0.3
0.3
M3B
M3C
0.3
M3A
M3D
0.2
0.2
M2B
M2C
0.2
M2A
M2D
0.1
0.2
M1D
0.1
0.1
M1B
M1C
Initial Initial 1 Notch Peak Unloading Compliance Ci Specimen Length Load, Pc % of Peak a = a0/d I.D. Load (mm/kN) (kN) M1A 0.1 3.53 94% 0.00211
st
Table 1. Test Parameters and Measured Values