Monitoring Probabilistic SLAs in Web Service Orchestrations Sidney Rosario, Albert Benveniste
Claude Jard
INRIA-IRISA Universit´e Europ´eenne de Bretagne Campus de Beaulieu 35042 Rennes, France
[email protected]
Ecole Normale Sup´erieure de Cachan-IRISA Universit´e Europ´eenne de Bretagne Campus de Ker-Lann 35170 Bruz, France
[email protected]
Abstract—Web services are software applications that are published over the Web, and can be searched and invoked by other programs. New Web services can be formed by composing elementary services, such composite services are called Web service orchestrations. Quality of Service (QoS) issues for Web service orchestrations deeply differ from corresponding QoS issues in network management. In an open world of Web services, service level agreements (SLAs) play an important role. They are contracts defining the obligations and rights between the provider of a Web service and a client with respect to the services’ function and quality. In a previous work we have advocated using soft contracts of probabilistic nature, for the QoS part of contracts. Soft contracts have no hard bounds on QoS parameters, but rather probability distributions for them. An essential component of SLA management is the continuous monitoring of the performance of called Web services, to check for violation of the agreed SLA. In this paper we propose a statistical technique for QoS contract run time monitoring. Our technique is compatible with the use of soft probabilistic contracts.
I. I NTRODUCTION Web services are building blocks for creating open distributed applications. They are software applications that are published over the Web which can be searched for and called by other programs. Web services may be composed together to form new Web services. A composition involving a central entity which calls different services (in sequence, parallel, etc) is called a Web service orchestration. The central entity which controls the flow in the composition is called the orchestrator. In an open world of Web services, service level agreements (SLAs) play an important role. They are contracts defining the obligations and rights between the provider of a Web service and its client with respect to the services’ quality. In Web service orchestrations in particular, the orchestrator is a client of the services called in the orchestration. In order to design a contract with its own clients, the orchestrator can in turn have contracts with the services it calls. Sometimes, the called services are freely available and the orchestration has no contracts with them. In this case, some estimation method This work was partially funded by the ANR national research program DocFlow (ANR-06-MDCA-005), Dots (ANR-06-SETI-003) and the project CREATE ActivDoc. We also thank Mayur Yadav, intern from IIT India, who participated to the development of our tool.
(e.g., ping-based measurements) can be used to estimate the service’s performance. The contracts with the services and the QoS estimates can then be composed to derive the orchestration’s contract. In this article, we focus on the Quality of Service (QoS) part of contracts, with emphasis on response time. Also, we will only consider monotonic orchestrations for which it can be proven that an improvement in the performance of the services called in the orchestration results in an improvement in the orchestration’s performance. Monotonicity is essential for sound contract composition in orchestrations. Surprisingly, monotonicity is not always achieved, though implicitly admitted. The response times of a service may vary over a large range. Consequently, it may be problematic to have deterministic contracts with hard bounds on response times. Such “hardcontracts” can be over-pessimistic. In [1] we have proposed the use of probabilistic contracts. Probabilistic contracts consist of agreeing on some probability distribution for the QoS parameters in consideration. Using probabilistic contracts for the contracted sub-services, in combination with measurements based QoS estimates for the others, it is possible to synthesize the probabilistic contract of the overall orchestration [1]. An essential component of SLA management is the runtime monitoring of contracts. SLA monitoring must be continuous to timely detect possible SLA violations. In case of a violation, the called service may have to incur some agreed penalty. If the service is called by an orchestrator, the orchestrator might consider reconfiguring the orchestration to call an alternative service. We stress that it is not possible, in a probabilistic framework, to ensure that violation detection is certain (false alarms are unavoidable) and that all violations are detected (some violations may go unnoticed). The monitoring of probabilistic contracts requires using methods from statistics. We propose using statistical testing to check if the observed performance deviates from the performance promised in the contract. The paper starts by presenting a small example of orchestration, which is used to illustrate the different notions along the paper and has served to perform some experiments. Then, we introduce the notion of monotonic orchestration and probabilistic contracts. The core of the paper is dedicated
to the synthesis of monitors for each contracted service. We present the approach in section IV and our experimental results in section V. We end the paper by reviewing some related works and giving a short conclusion. II. E XAMPLE OF ORCHESTRATION We perform our experiments on the CarOnLine example developed in the SWAN project [3]. CarOnLine is a composite service for buying cars online, together with credit and insurance. A simplified graphical view of it is shown in Figure 1.
CarOnLine request (car)
GarageA
GarageB
timer
timer
p yes
no car = deluxe
AllCreditPlus
GoldInsure
InsureAll
min
InsurePlus
min
merge c
p
CarP rice(car) ∆ {M ux(p1, p2) where p1 :∈ (N etGA ! GarageA(car)) | T imer(T ) p2 :∈ (N etGB ! GarageB(car)) | T imer(T ) } >p> { if (p "= F ault)) ! let(p) } GetCredit(p) ∆ M in(c1, c2) where c1 :∈ N etC ! AllCredit(p) c2 :∈ N etCP ! AllCreditP lus(p) GetInsur(p, car) ∆ { if (car = deluxe) ! GoldInsure(p)} | { ifnot(car = deluxe) ! {min(ip, ia) where ip :∈ InsureP lus(p) ia :∈ InsureAll(p, car) }} Table I C ARO N L INE IN O RC .
mux
AllCredit
CarOnLine(car) ∆ CarP rice(car) >p> let(p, c, i) where c :∈ GetCredit(p) i :∈ GetInsur(p, car)
i
CarOnLine response
Figure 1. A simplified view of the CarOnLine orchestration. The calls to GarageA and GarageB are guarded by a timer that returns a “Fault” message whenever the timeout occurs—this is not shown on the figure.
On receiving a car model as an input query, the CarOnLine service first sends parallel requests to two car dealers (GarageA, GarageB), getting quotations for the car. The calls to each garage are guarded by a timer, which stops waiting for a response once the timeout occurs. If a timeout occurs, the response of the call is a Fault value. The best offer is chosen by the (local) function Mux which returns the minimum non-faulty value. If both timeouts occurs, Mux returns a Fault. Credit and insurances are found in parallel for the best offer. Two banks (AllCredit, AllCreditPlus) are queried for credit rates and the one offering a lower rate is chosen. For insurance, if the car belongs to the deluxe category, any insurance offer by service GoldInsure is accepted. If not, two services (InsurePlus, InsureAll) are called in parallel and the one offering the lower insurance rate is chosen. In the end, the (car-price (p), credit-rate (c), insurance-rate (i)) tuple is returned to the customer.
The O RC program for CarOnLine is given in Table I. O RC is a language for Web services orchestrations that was proposed by J. Misra and W. Cook [4]. We haven chosen using it for its elegance and availability of formal semantics [5], [6]. O RC defines three basic operators. For O RC expressions f, g, “f | g” executes f and g in parallel. “f >x> g” evaluates f first and for every value returned by f , a new instance of g is launched with variable x assigned to this return value; in particular, “f ! g” (which is a special case of the former where returned values are not assigned to any variable) causes every value returned by f to create a new instance of g. “f where x :∈ g” executes f and g in parallel. When g returns its first value, x is assigned to this value and the computation of g is terminated. All site calls in f having x as a parameter are blocked until x is defined (i.e., until g returns its first value). CarPrice calls GarageA and GarageB in parallel for quotations. Calls to these garages are guarded by a timer site Timer which returns a fault value T time units after the calls are made. The let site simply returns the values of its arguments—sites can only execute when all their parameters are defined and thus can be used to synchronize parallel threads. The value returned by CarPrice (here the variable p) is passed as argument to GetCredit and GetInsur which parallelly find credit and insurance rates for the price. The service NetGA in NetGA ! GarageA(car) is a dummy service that captures the contribution of the network to the response time of GarageA as perceived by the orchestration. No such call occurs in GetInsur. This is because the orchestration does not enter into contracts with the insurance sites, which are assumed to be freely available. The absence of a contract requires estimating the insurance sites’ and the associated network’s performance. This is discussed in the next section. III. Q O S PROBABILISTIC C ONTRACTS An orchestration could call two types of services. The first category consists of the sub-contractors having promised to
answer according to some agreed contract. This is the case for the Garage and Credit services in our example. But since contracts only involve the local behaviour of the server, they cannot reasonably include the contribution of the network, which may for e.g., add to the response time of a call. This justifies modeling the network access explicitly, by inserting network calls before each contractual service call (NetGA, NetGB, NetC and NetCP). The QoS of these network calls can be estimated using measured QoS parameters of “pings” to the considered services. Using pings, we can estimate the round-trip time of a message, i.e., the sum of the client to server latency and the server to client latency. The second type of services are “public” services (e.g. Google) that are freely available. No particular QoS contract can be established with such services and QoS can only be estimated via end-to-end measurements. Since such end-to-end measurements include the contribution of network access to QoS, there is no need for an explicit mention of the network in this case. In our example, we consider that this is the case for the insurance servers (GoldInsure, InsurePlus and InsureAll).
the performance of GarageB, could lead to an improvement in the performance of the orchestration. Such a pathological situation does not occur in our original example since the response time of GetInsur depends only on the external parameter car. Once car is fixed, response times behave in a monotonic way. We say that our example is monotonic. A systematic study of monotonicity can be found in [7]. B. Probabilistic SLAs It is typically the case that QoS contracts are stated in the form of hard bounds on QoS parameters [8], [9]. For instance, response times and query throughput are required to be less than a certain fixed value and validity of answers to queries must be guaranteed at all times. When composing contracts, hard composition rules are used such as addition or maximum (for response times), or conjunction (for validity of answers to queries) [10], [11]. The problem is that tails in the random response time distributions of services cannot be neglected in practice as the following example reveals. 400
An implicit assumption in contract based QoS management is: “the better the component services perform, the better the orchestration’s performance will be.” Surprisingly, this property that we called “monotonicity” [7] can easily be violated, meaning that the performance of the orchestration may improve when the performance of a component service degrades. This is highly undesirable since it can make the process of contract composition inconsistent. Consider the CarOnLine orchestration of Figure 1, but slightly modified. The condition “car = deluxe” for deciding calls to insurance services is changed as follows: if the best price returned by the garages is p, then GoldInsure is called if p ≥ limit where limit is a certain constant value. If p < limit, InsurePlus and InsureAll are called in parallel. Assume that the credit services AllCredit and AllCreditPlus respond extremely fast (almost 0 time units) and so the response time of the orchestration only depends on the response time of the garage and insurance services. Let response times of the garage and insurance services GarageA, GarageB, GoldInsure, InsureAll and InsurePlus be δA , δB , δG , δI1 and δI2 respectively. Also assume that the price quotes p of GarageA are always greater than limit and that the price quote of GarageB is always less than limit. Now, the overall orchestration response time is δO = max(δA , δB ) + max(δI1 , δI2 ), assuming that both δA and δB are less than the timeout value T. Suppose that the performance of GarageB now deteriorates, and it does not respond before timeout time T . GarageA’s price quote is now the best quote. Since we assumed that the quotes of GarageA are always greater than limit, GoldInsure is called and the orchestration’s latency is δO! = T + δG . In the case when δG # max(δI1 , δI2 ), it is possible that δO! < δO . In other words, the deterioration of
350 No. of occurences
A. Monotonicity
300 250 200 150 100 50 0 0
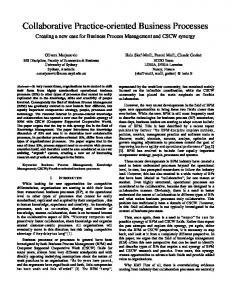
Figure 2. StockQuote.
0.5
1
1.5 Delays
2
2.5
3 4
x 10
Measurement records for response times, for Web service
Figure 2 displays a histogram of measured response times for a “StockQuote” Web Service, which returns stock prices of a queried entity [16]. Here, the 90%, 95%, and 98% quantiles correspond to response times of 6.494 ms, 13.794 ms, and 23.506 ms respectively. Setting hard bounds in terms of response time would amount to selecting, e.g., the 98% quantile of 23.506 ms, leading to an over pessimistic promise. A pragmatic answer to this issue consists in ruling out “bad instances” for the QoS parameter, e.g., by phrasing contracts such as: “less than 13.794 ms in 95% of the cases” [12], [13]. This is fine. Unfortunately, such contracts do not compose well and, therefore, do not support contract composition as a mean to design contracts for the overall orchestration [1]. This is why we proposed in [1] probabilistic contracts, where probability distributions are agreed upon instead of
hard bounds. Probabilistic contracts are specified through their distribution function F (x) = Pr(δ ≤ x) where “Pr” denotes the probability corresponding to the considered contract, δ is the random response time, and x ≥ 0. Probabilistic contracts do compose, as we shall see below. In practice, probabilistic contracts will be stated as a finite set of quantiles for the considered QoS parameters. For example, the histogram of Figure 2 could be approximately stated as: quantiles of 25%, 50%, 90%, 95%, and 98%, corresponding to maximal response times of 2.5 ms, 4.5 ms, 6.4 ms, 13.8 ms, and 23.5 ms respectively. Such soft contracts can be described in WSLA [13] by the introduction of the notion of lists of quantiles in the XML template.
the probabilistic contracts? Definitely this would be much more efficient than running simulations. We insist on the use of simulations for the following reasons: 1) Analytic composition of probability distributions works typically only for simplistic distributions (eg, exponential distributions) which are not realistic performance models in general. 2) Orchestrations have non-deterministic control-flow choices, often depending on the value of a parameter. The presence of timeouts can also affect such choices. Traditional max-plus composition rules do not apply in this case. IV. M ONITORING
C. Synthesis of the orchestration contract To synthesize the orchestration contract, we simply compose the different probabilistic sub-contracts. Contract composition consists in running the following Monte-Carlo procedure at design time [1]: • The list of quantiles given by the sub-contractors defines a probability distribution for the time responses; • For public sites, for which no contract is available, we replace the missing probability distribution by empirical estimates of it, based on end-to-end time measurements; • For given values of the external parameters of the orchestration, its execution structure is a partial order of calls and actions. The latter is used to run timed Monte-Carlo simulations to derive empirical estimates for the distribution of the global response time of the orchestration. Delays are aggregated using max-plus rules to deal with concurrent tasks;1 • Having these empirical probability distributions, we can properly select quantiles defining soft contracts for the end user. So far the resulting contracts depend on the values of the external parameters of the orchestration. The latter are typically not fixed a priori but rather vary with the call. The resulting issue can be dealt with using one of the following approaches. First, if few values can occur, a set of contracts can be stated, one for each case—this could be a proper approach for the parameter car of CarOnline example, which possesses deluxe as its unique modality. A second approach could consist in taking the most cautious probability distribution, when the values for the external parameters range over their respective domains. Finally, one could also randomize the external parameters and then take the resulting average contract. The approach has been implemented in our TOrQuE (Tool for Orchestration simulation and Quality of service Evaluation) tool, which computed the experimental results shown in the paper. The use of simulations for contract composition raises an obvious question: Can’t analytical methods be used to combine 1 Observe that, in contrast to QoS of networks, QoS parameters of orchestrations are correlated to the involved data. This makes SLA management for orchestrations much more delicate.
In this section we describe our technique for monitoring soft contracts. The performance of the contracted services is monitored at run-time, when they are called by the orchestration. A. Statistical monitoring of services We want to compare the observed performance of a service S to that promised in its soft contract FS . The soft contract FS is a distribution on the response times of S. Let ∆ be a finite set of sample response times of S—call it a population. For X a set, let |X| denote its cardinality. Then |{ δ | δ ∈ ∆ and δ ≤ x}| F!S,∆ (x) =def |∆|
(1)
is the empirical distribution function, defined as the proportion of sample response times less than x among population ∆. Then, informally, the contract is met if: ∀x ∈ R+ : F!S,∆ (x) ≥ FS (x)
(2)
∃x ∈ R+ s.t. F!S,∆ (x) < FS (x)
(3)
sup (FS (x) − F!S,∆ (x)) ≥ λ
(4)
holds, i.e., the observed empirical probability that the response time is less than x is not smaller than that promised. R+ is the set of positive reals, the domain of latencies. Equivalently, a contract violation occurs if
The problem with equations (2) and (3) is that F!S,∆ (x) can randomly fluctuate around FS (x), especially when |∆| is small. A solution to this problem is to have a tolerance zone for such deviations. We can thus rewrite the violation condition as x∈R+
where λ is a small positive parameter which defines the tolerance zone. Reducing λ improves the chances of detecting contract violation, but it also increases the risk of a false alarm. Thus, tolerance parameter λ has to be tuned in a meaningful way. This is done in an offline “calibration phase”, performed prior to the monitoring.
1) Calibration Phase: As sketched in Section III, during contract composition, sample response times are drawn from the contract distribution FS (x) for each service S involved in the orchestration. Suppose the total number of samples drawn for a given service S is M , i.e. the set of sampled delay values for S during the simulation is ∆ = {δ1 , . . . δM }. In the calibration phase, we apply the following bootstrapping method [2]: a) Generate ∆∗ by re-sampling ∆ at random. This means that ∆∗ is a randomly selected subset of ∆, of fixed size |∆∗ | = N . According to bootstrapping discipline, N should be smaller than log(M ). Using ∆∗ , we can produce a bootstrap estimate F!S,∆∗ (x) of FS (x) using equation (1). Denote by Ω be the set of such randomly generated ∆∗ ⊆ ∆. In our experiments, we have chosen its cardinal |Ω| to be about 10, 000. b) A false alarm level L (e.g., 5%) during monitoring is agreed between the orchestrator and the service S. Taking F!S,∆∗ (x) as a population, where ∆∗ ranges over Ω, the tolerance parameter λ is tuned to the smallest value such that sup (FS (x) − F!S,∆∗ (x)) ≤ λ
over Ω, thus resulting in the need for increasing tolerance parameter λ to maintain the agreed false alarm rate, which in turn increases the delay for detecting violation. This results in a tradeoff leading to an optimal choice for N . Anyway, this need not be part of the agreed contract. B. How to measure deviation from contracts Is there a natural way of assessing how much the subcontractor possibly deviated from its contract? A natural answer in our approach consists in considering the one-sided Kolmogorov-Smirnov gap, defined as follows: δ(GS , FS ) = sup (FS (x) − GS (x)) x∈X
where FS is the distribution function according to the contract agreed with site S and GS is the actual distribution function of site S. Observe that the quantity that we compute from measurements while performing monitoring according to (4) does converge to δ(GS , FS ) when the sample size ∆ gets large. The one-sided Kolmogorov-Smirnov gap relates to the classical Kolmogorov-Smirnov distance [14] d(GS , FS ) between distributions: d(GS , FS )
=def =
x∈X
holds for 100 − L percent (e.g., 95%) of the ∆ ∈ Ω. In fact, it is a result due to Kolmogorov [14], sect. 14.2, that, for N large enough, the so obtained value for the tolerance zone λ does not depend on the distribution FS . Yet, to avoid dealing with size issues of N , we prefer calibrating tolerance parameters for each site individually. But, clearly, there is room for saving computations at this step. 2) Monitoring Phase: Once the tolerance parameter λ is set, monitoring can be done in the following way: suppose the first N responses of service S have latencies {δ1 , . . . δN }. Taking ∆ = {δ1 . . . δN }, we compute F!S,∆ (x) and then check if condition (4) is violated. When the (N + 1)st delay, δN +1 is recorded, we shift ∆ by one observation, making it {δ2 , . . . δN +1 }. We compute F!S,∆ (x) for this new ∆ and check violation of (4) again. This process is repeated for further observed response times, each time shifting ∆ by one observation.2 So ∆ is a sliding window of fixed size N . The window size N is the same as the size |∆∗ | in the calibration phase. Window length N appears as an additional design parameter for the monitoring procedure. N can be entirely decided by the orchestrator and need not be a part of the contract. The rationale for tuning N is as follows: Observe that N is strongly correlated with the detection delay in case of a contract violation. On the one hand, the proportion of breaching data must be large enough in the window ∆ in order for condition (4) to get violated. Thus, reducing N contributes to the reduction of detection delay. On the other hand, reducing N increases random fluctuations of F!S,∆∗ (x) when ∆∗ ranges ∗
2 Actually, we do not need to shift the window by 1; any fixed amount can be used instead provided that successive windows overlap.
supx∈X |FS (x) − GS (x)|
max(δ(GS , FS ), δ(FS , GS ))
Observe that The Kolmogorov-Smirnov distance ranges over [0, 1] and so does our one-sided gap. This measure is used in assessing the magnitude of changes in the section on experiments. C. Discussion on criticality At a first sight, not all sites in an orchestration have an equal impact on the QoS of the orchestration. Some sites may be critical, in that a slight degradation/improvement in their performance will directly result in a degradation/improvement in the performance of the overall orchestration. Other sites may not be critical, a degradation in their performance would not affect the performance of the orchestration very much. Thus, one can imagine adapting the monitoring process according to a site’s criticality: A site having an adverse impact on the orchestration’s performance will be monitored more strictly, while some slack can be given to a service whose performance does not significantly affect the orchestration’s performance. To address this in the context of classical timing performance studies, e.g., for scheduling purposes, the notion of critical path was proposed. However, this notion must be revisited under our probabilistic approach. For instance, consider the example of Figure 3. The overall execution time of this orchestration is t6 = t1 + max(δS1 , δS2 ) + δjoin . It seems that only the “slowest” among the two sites S1 and S2 matters. This is a wrong intuition, however. Assume that the two sites S1 and S2 behave independently from the probabilistic point of view. Setting δ = max(δS1 , δS2 ), Fi (x) = P(δSi ≤ x), and F (x) = P(δ ≤ x), we have F (x) = F1 (x) × F2 (x). Next, suppose that the two sites S1 and S2 possess unbounded response times. Thus, for any x > 0 we have 0 < Fi (x) < 1 for i = 1, 2. In this case,
Fork
t2 = t1 + δS1
t1 = δf ork
S in its contract FS . The set of postive reals R+ in equation (4) is thus replaced by the set X = {x1 . . . xk } of latency quantiles promised in the contract.
Call S2 t3 = t1 + δS2
Call S1
B. Statistical monitoring of contracts Join
t6 = max(t2 , t3 ) + δjoin
Figure 3. A ’Fork-Join’ partial order having calls to two services, S1 and S2. The time of completion of each of the event is shown next to it. δX is the latency of event X.
since F (x) = F1 (x) × F2 (x), any change in F1 or F2 will result in a change in F . Thus, both sites S1 and S2 are equally critical, even if, say, F1 (x) > F2 (x) for every x, meaning that there are good chances that S1 will respond faster. Of course, if F1 and F2 possess disjoint supports, meaning that there exists some separating value xo such that F2 (xo ) = 0 but F1 (xo ) = 1, then we know that δS1 < δS2 will hold with probability 1, so that S1 is never on the critical path. This discussion justifies that all sub-contractors are individually monitored in isolation for possible contract violation, as they all have impact on the overall orchestration QoS in general. V. E XPERIMENTAL R ESULTS We now describe the implementation of our monitoring technique and the results obtained. We first discuss the kind of soft contracts we use in the simulations. After this, we present results on the statistical monitoring of contracts, as explained in section IV-A. A. Contract of the orchestration Recall that we take the contract of a service S, FS to be a probability distribution of the response time. Expecting a service provider to able to give a precise probability for every possible value of latency is however impractical. So, we take the contract with provider S to be a set of quantiles of latencies {x1 . . . xk } with the corresponding probabilities {FS (x1 ) . . . FS (xk )}. Hard contracts are just a special case of our soft contracts, in which only one such quantile exists. We thus requires the provider to pass from promising a performance probability of one quantile to multiple quantiles. During simulation, two possibilities may be considered when using FS = {FS (x1 ) . . . FS (xk )} for sampling response times: • Use FS as it is, by sampling each time one of the quantiles {x1 . . . xk }, in proportion with FS . This would lead to over-pessimistic distributions, however. • Hypothesize a constant probability density within each quantile, except for the last one where exponential distribution is hypothesized. From our experiments regarding Web services response times, we preferred this second approach. While monitoring, we check for violation of condition (4) only for the set of quantiles that have been promised by the service
We ran CarOnline orchestration and monitored the single service GarageA according to section IV-A. We only show the monitoring of one service, since the process of monitoring is identical for any other service of the orchestration. There was no particular reason for choosing to monitor GarageA, we could have done the same with any other service of CarOnline. The contract of GarageA, the finite set of quantiles and their corresponding probabilities, is given in the first and second column of Table II, respectively. The false alarm rate agreed with the orchestrator is 95%. Contract Delay Quantile (msec) 100 200 300 400 500 700 1000
CDF 0.1 0.2 0.3 0.5 0.7 0.85 0.9
Experimental Delay Quantile (msec) 150 250 350 500 600 800 1100
Table II Contract and experimental distributions of GarageA. The Kolmogorov-Smirnov distance between them is 0.133.
As mentioned in the end of section IV-A, we need to find a good value for the window length N for the calibration and the monitoring phase (it directly affects the detection delay). For this, we ran the calibration and monitoring on GarageA for three different window lengths: 10, 30 and 50. The violations were detected after 10 to 25 calls (with lots of variations) when N = 10, 20 to 30 calls when N = 30 and between 40 to 80 calls when N = 50. N = 30 was preferred to N = 10 because less variations were observed in the detection delay, and is clearly preferred over N = 50 where the detection delay was too large. With N = 30, the calibration phase (IV-A1) on this distribution of GarageA gave the tolerance parameter λ equal to 0.167. After the calibration phase, the CarOnline orchestration was run 1000 times as follows: From run 1 to 700, GarageA’s actual performance was exactly that as the promised distribution. From run 700 to 1000, we slightly deteriorated GarageA’s performance to follow a “slower” distribution. The delay quantiles and their corresponding probabilities of this slower distribution is given in the third and second column of Table II, respectively. The result of the monitoring is shown in Figure 4. The value of supx∈X (FS (x) − F!S,∆∗ (x)) is plotted for each call made to GarageA. The red horizontal line shows the value of λ, 0.167. The detection occurs around the 728th run, i.e. around 28 calls later.
0.4
Accordingly, our method proceeds in two steps. The first step consists in a calibration phase relying on Monte-Carlo simulation using the probabilistic distributions promised by 0.3 the sub-contractors, in combination with measurements (esti0.25 mates) for the other services. Calibration takes into account 0.2 the probabilistic criticality of each service. The second step consists in the run-time monitoring of contracts for possible 0.15 violation. An important feature of this monitoring process 0.1 is that it is not deterministic: sometimes false alarms may 0.05 occur and sometimes violations can go undetected. This is unavoidable because contracts are probabilistic. 0 There are very few papers on probabilistic contracts. This −0.05 paper seems to be the first attempt to design monitors in this −0.1 100 200 300 400 500 600 700 800 900 1000 context. The simulation technique we use is very general and allows the designer to consider complex orchestrations mixing Figure 4. Monitoring GarageA. control and data aspects: the only (realistic) assumption is monotonicity. We implemented these ideas in a software tool and made several simulation experiments on a small example, VI. R ELATED W ORK which proved the feasibility and relevance of the approach. Most of the work in QoS monitoring is dedicated to We plan to extend our work in two directions. The first the design of service monitoring architectures [17]. Service direction is the real deployment of the method on the Web, monitoring needs to be integrated in the infrastructure at large based on the O RC run-time environment. The second direction in order to enable detection and routing of the service oper- is to generalize what we have done on response times to ational events. In contrast, the algorithms needed to compute others QoS parameters. This includes addressing the fact that QoS metrics and to compose them to obtain the QoS of different QoS parameters are often correlated. the orchestration, received less attention. QoS composition is R EFERENCES often viewed as a constraint satisfaction/optimization problem, for which an optimal solution can be found using various [1] S. Rosario, A. Benveniste, S. Haar and C. Jard. Probabilistic QoS and techniques like linear programming [18], [19], constraint satisSoft Contracts for Transaction based Web Service Orchestrations. IEEE Intern. Conf. on Web Services, July 2007, Salt Lake City, Utah, USA, faction programming [20] or genetic algorithms [21]. All these pp. 126-133. above composition techniques consider the QoS parameters [2] A. C. Davison and D. V. Hinkley. Bootstrap Methods and Their Appliof a service to be fixed, hard bound values. A distinguished cation. Cambridge Series in Statistical and Probabilistic Mathematics, No 1. 1997. feature of our proposal is that we believe that in reality, these [3] The SWAN project. http://swan.elibel.tm.fr parameters exhibit significant variations in their values and [4] J. Misra and W. Cook. Computation Orchestration: A Basis for Wideare better modeled by a probability distribution. The notion of Area Computing. Journal of Software and Systems Modeling, May 2006. [5] D. Kitchin, W. Cook and J. Misra. A language for task orchestration probabilistic QoS has been introduced and developed in [22], and its semantics properties. Proc. of the International Conference on [23] with the ambition to compute an exact formula for the Concurrency Theory (CONCUR), Aug. 2006, Bonn. composed QoS, which is only possible for restricted forms [6] S. Rosario, D. Kitchin, A. Benveniste, W. Cook, S. Haar and C. Jard. Event structure semantics of ORC. 4th International Workshop on Web of orchestrations without any data dependency. We decided in Services and Formal Methods (WS-FM 2007), Oct. 2007, Brisbane. [1] to use probabilistic QoS to define “soft” contracts. The [7] A. Bouillard, S. Rosario, A. Benveniste and S. Haar. Monotony in main difference is that we did not hesitate to use MonteService Orchestrations. Irisa internal report, April 2008. Available at http://www.irisa.fr/distribcom/benveniste/pub/monotony-report2008.pdf Carlo simulation to compute the global QoS in order to cover [8] J. Cardoso, A. Sheth, J. Miller, J. Arnold, and K. Kochut. Quality more complex orchestrations. Regarding run-time monitoring, of service for workflows and Web service processes. Journal of Web it leads directly to the use of statistical testing techniques Semantics, Vol. 1 (3), pp. 281-308, 2004. [9] M.-C. Jaeger, G. Rojec-Goldman, G. Muhl. QoS aggregation in Web to detect violation of QoS contracts. Such techniques have service compositions. IEEE Intern. Conf. on e-Technology, e-Commerce already been used in [24] to adapt SLA checkers to the and e-Service, EEE’05, pp. 181-185, 2005. variation of the environment, but in a context of deterministic [10] D. Menasc´e. Automatic QoS control. IEEE Internet Computing, Vol. 7 (1), pp. 92-95, 2003. contracts. 0.35
VII. C ONCLUSION We proposed an approach to design monitors for service components having a QoS contract with a considered orchestration. For so-called monotonic orchestrations, we advocated the use of probabilistic contracts (“soft” contracts). Since our approach is statistical, it involves agreeing on a false alarm rate for monitoring, with the sub-contractor.
[11] V. Grassi and S. Patella. Reliability prediction for service-oriented computing environment. IEEE Internet Computing, pp. 43-49, 2006. [12] C. Patel, K. Superkar and Y. Lee. A QoS oriented framework for adaptive management of Web service based workflows. Intern. Conf. on Database and Expert Systems, DEXA’03, pp. 826-835, 2003. [13] A. Keller and H. Ludwig. The WSLA Framework: Specifying and Monitoring Service Level Agreements for Web Services. Journal of Network and Systems Management, Vol. 11, Nu 1, March 2003, pp. 57-81. Springer. [14] E.L. Lehman and J.P. Romano. Testing Statistical Hypotheses, third edition. Springer texts in statistics, Springer Verlag, 2005.
[15] Coffinan, E.G., editor. Computer and Job-Shop Scheduling Theory. Wiley, New-York, 1976. [16] X-Methods. www.xmethods.net [17] L. Zeng, H. Lei and H. Chang. Monitoring the QoS for Web Services. B. Krmer, K.-J. Lin, and P. Narasimhan (Eds): ICSOC 2007, LNCS 4749, pp. 132-144, 2007. Springer. [18] R. Aggarwal, K. Verma, J. Miller and W. Milnor. Constraint Driven Web Service Composition in METEOR-S, Proc. of IEEE International Conference on Services Computing, SCC 2004. [19] L. Zeng, B. Benatallah, A. Ngu, M. Dumas, J. Kalagnanam, and H. Chang. QoS aware Middleware for Web Service Composition. IEEE Transactions on Software Engineering, Vol. 30, issue 5, 2004. [20] X. Nguyen, R. Kowalczyk, and M. Phan. Modelling and Solving QoS Composition Problem Using Fuzzy DisCS”, Intl Conference on Web Services, ICWS 2006. [21] G. Canfora, M. D. Penta, R. Esposito, and M. L. Villani. An Approach for QoS-aware Service Composition based on Genetic Algorithms. Genetic and Evolutionary Computation Conference, GECCO 2005. [22] S.-Y. Hwang, H. Wang, J. Srivastava and R. A. Paul. A probabilistic QoS Model and Computation Framework for Web Services-Based Workflows. ER 2004, LNCS 3288, pp. 596-609, 2004. P. Atzemi et al. (Eds.), Springer. [23] S.-Y. Hwang, H. Wang, J. Tang and J. Srivastava. A probabilistic approach to modeling and estimating the QoS of Web-services-based workflows. Information Sciences, Vol. 117, pp. 5484-5503, 2007. [24] A. Bertolino, G. De Angelis, A. Sabetta, S. Elbaum. Scaling up SLA Monitoring in Pervasive Environments. ACM ESSPE’07, September 2007, Dubrovnik, Croatia, pp. 65-68.