Noor Elaiza Abdul Khalid et al. / International Journal on Computer Science and Engineering (IJCSE)
MRI Brain Abnormalities Segmentation using K-Nearest Neighbors (k-NN) Noor Elaiza Abdul Khalid Faculty of Computer and Mathematical Sciences University Technology MARA Shah Alam, Selangor, Malaysia
[email protected]
Shafaf Ibrahim Faculty of Computer and Mathematical Sciences Universiti Teknologi MARA, Shah Alam, Selangor, Malaysia.
[email protected]
Puteri Nurain Megat Mohd Haniff Faculty of Computer and Mathematical Sciences University Technology MARA Shah Alam, Selangor, Malaysia
[email protected]
Abstract—Segmentation of medical imagery remains as a challenging task due to complexity of medical images. This study proposes a method of k-Nearest Neighbor (k-NN) in abnormalities segmentation of Magnetic Resonance Imaging (MRI) brain images. A preliminary data analysis is performed to analyze the characteristics for each brain component of “membrane”, “ventricles”, “light abnormality” and “dark abnormality” by extracting the minimum, maximum and mean grey level pixel values. The segmentation is done by executing five steps of k-NN which are determination of k value, calculation of Euclidian distances objective function, sortation of minimum distance, assignment of majority class, and determination of class based on majority ranking. The k-NN segmentation performances is tested to hundred and fifty controlled testing data which designed by cutting various shapes and size of various abnormalities and pasting it onto normal brain tissues. The tissues are divided into three categories of “low”, “medium” and “high” based on the grey level pixel value intensities. The overall experimental result returns good and promising segmentation outcomes for both light and dark abnormalities. Keywords-k-Nearest Neighbor (k-NN); brain abnormalities segmentation, Magnetic Resonance Imaging (MRI)
I.
INTRODUCTION
Human have extraordinarily large and complex brains. The anatomy of the brain is complex due its complicate structure and function [1]. The brain is the part of the central nervous system. It is the centre to control the mental processes and physical action of a human being. Brain abnormality is a symptom where motor impairment and neuropsychological problems affect the central nervous system. It is an abnormal growth of cells within the brain, which can be cancerous or non-cancerous [2]. To date, numerous researches of brain abnormality detection had been conducted due to its important roles in identifying anatomical areas of interest for diagnosis, treatment, or surgery planning paradigms [3]. Magnetic Resonance Imaging (MRI) is a primary medical imaging modality that commonly uses to visualize the structure and the function of human body [4]. It provides rich information for excellent soft tissue contrast which is especially useful in neurological studies [5]. In previous years, MRI is observed to play an important role in brain abnormalities research in determining size and location of affected tissues [6]. Image segmentation refers to a process of assigning labels to set of pixels or multiple regions [7]. It plays a major role in the field of biomedical applications as it is widely used by the radiologists to segment the medical images input into meaningful regions. Thus, various segmentation techniques in medical imaging depending on the region of interest had been proposed [8]. Medical image segmentation problems has been approached with
ISSN : 0975-3397
Vol. 3 No. 2 Feb 2011
980
Noor Elaiza Abdul Khalid et al. / International Journal on Computer Science and Engineering (IJCSE)
several solution methods by different range of applicability such as Particle Swarm Optimization [9], Genetic Algorithm [7], Adaptive Network-based Fuzzy Inference System (ANFIS) [10], Region Growing [11], Self Organizing Map (SOM) [12] and Fuzzy c-Means (FCM) [13]. However, segmentation of medical imagery remains as a challenging problem due to the complexity of the images. Brain tissue is a particularly complex structure and its segmentation is an important step for studies in temporal change detection of morphology [14]. Success of MRI in the detection of brain pathologies is very encouraging. However, diagnosis and locations of abnormality are made manually by radiologists. It consumes valuable human resources, error sensitive [15] and making it prone to error [16]. Tool is needed to save time as manual segmentation is tedious, less accurate and require long time to complete [17]. Therefore, extensive effort is needed in order to find reliable and accurate algorithms to solve this difficult problem. K-Nearest Neighbor (k-NN) classification technique is the simplest technique conceptually and computationally that provides good classification accuracy [18]. The k-NN algorithm is based on a distance function and a voting function in k-Nearest Neighbours, the metric employed is the Euclidean distance [19]. The k-NN has higher accuracy and stability for MRI data than other common statistical classifiers, but has a slow running time [20]. Yet, the issues of poor run time performance is not such a problem these days with the computational power that is available [21]. Therefore, this paper proposes a technique of k-NN in segmenting MRI brain abnormalities as it is found as a relevant method for our problem. A preliminary data analysis is performed to analyze the characteristics for each brain component of “membrane”, “ventricles”, “light abnormality” and “dark abnormality” by extracting the minimum, maximum and mean grey level pixel values. The segmentation is done by executing four steps of k-NN which are determination of k value, calculation of Euclidian distances objective function, sortation of minimum distance, assignment of majority class, and determination of class based on majority ranking. The accuracy of the segmentation performances are then statistically measured using Receiver Operating Characteristic (ROC) analysis. The organization of the rest of this paper is as follows: Section II presents our methods, including the overview of k-NN methods and descriptions of the algorithm structure. Section III discusses our results and discussions. Finally, we present our conclusion in Section IV. II.
METHODS
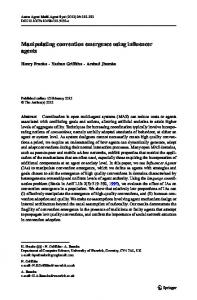
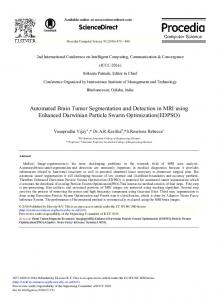
In this study, the proposed segmentation algorithm consists of four main stages which are data acquisition, preliminary data analysis, segmentation of brain abnormalities using k-NN and result analysis as illustrated in Fig. 1. A. Data Acquisition Hundred and fifty secondary data of Fluid Attenuated Inversion Recovery (FLAIR)-MRI brain images are acquired from Hospital Kuala Lumpur (HKL). These images are then pre-processed to strip the brain skull. Skull stripping is an important pre-processing step in neuroimaging analyses because brain images must typically be skull stripped before other processing algorithms [3]. The skull is stripped using a technique of region growing as the region may affect the outcome of segmentation performances. Fig. 2 depicted sample of original FLAIR-MRI before and after skull stripping.
ISSN : 0975-3397
Vol. 3 No. 2 Feb 2011
981
Noor Elaiza Abdul Khalid et al. / International Journal on Computer Science and Engineering (IJCSE)
Figure 1. Proposed segmentation algorithm
(a) Figure 2.
(b) Original FLAIR-MRI brain image (a) and Skull stripped FLAIR-MRI brain image (b)
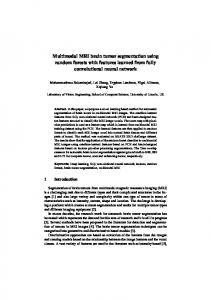
B. Preliminary Data Analysis A preliminary data analysis is performed to analyze the characteristics for each brain component of “membrane”, “ventricles”, “light abnormality” and “dark abnormality” by extracting the minimum, maximum and mean grey level pixel values. Region of interest (ROI) are extracted from 150 FLAIR-MRI brain images for distinguishing the patterns and characteristics of each brain component as shown in Fig. 3.
Figure 3.
ISSN : 0975-3397
Proposed areas of brain ROI
Vol. 3 No. 2 Feb 2011
982
Noor Elaiza Abdul Khalid et al. / International Journal on Computer Science and Engineering (IJCSE)
The data analysis results are then tabulated into a reference table that produced the minimum, maximum and mean range of grey level pixel values for each brain component. Table I tabulates the summary of reference table produced. TABLE I.
SUMMARY OF REFERENCE TABLE
Brain Component
Minimum Range
Maximum Range
Mean Range
Ventricle
1 - 45
15 - 60
10 - 50
Dark Abnormality
5 - 65
15 - 80
10 - 95
Membrane
65 - 120
75 - 130
70 - 120
Light Abnormality
120 - 205
130 - 230
120 - 215
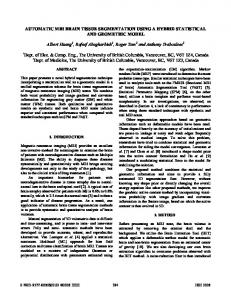
C. Segmentation of Brain Abnormalities using k-NN The proposed brain abnormalities segmentation method is based on k-NN paradigm. The k-NN rule is used to construct a lookup table of class, indexed by pixel value. As illustrated in Fig. 4, the proposed k-NN segmentation is divided into six important steps which are: 1) Determination of k value: an important parameter affecting both the accuracy and execution time of the kNN classification rule is k, the number of nearest neighbouring pixels to consider. The choice of variable k in kNN classification is dependent on the relation between the number of features and the number of cases. A small value of k may influence the result by individual cases, while a large value of k may produce smoother classification outcomes. After a few testing performed, the most suitable value of k for this study is k = 10.
Figure 4. Proposed steps of k-NN segmentation
ISSN : 0975-3397
Vol. 3 No. 2 Feb 2011
983
Noor Elaiza Abdul Khalid et al. / International Journal on Computer Science and Engineering (IJCSE)
2) Distance calculation between the query instance and the training samples: the calculation of distance are executed between the query instance and 150 training samples. The formula of Euclidean distance as in (1) is used as the objective function, which the equation is as follows:
d ij
n
x
ik
k 1
x jk
2
(1)
where xik is refers to the instance pixel points, whereas xjk is concerns with the values of training samples. Table II tabulates a few samples of Euclidean distance calculation which the value of minimum, maximum and mean grey level values of the query instance is 54, 77 and 79. TABLE II.
SAMPLES OF EUCLIDEAN DISTANCE CALCULATIONS
Minimum value
Maximum value
Mean value
Sum of square distance 57
57
36
54 25 79 36 = 3090
77
25
67
78
69
54 67 79 69
77 = 270
78
45
73
54
54 45 79 54
77 = 722
73
14
35
21
54 14 79 21
77 35 = 6728
34
59
44
54 35 79 44
77 59 = 1910
3) Sortation of distance based on the kth minimum distance: after all the Euclidean distances for each query instance are calculated, the distances are then sorted out. As shown in Table III, the square distance are sorted according to the most minimum square distance produced. TABLE III. Minimum value
SORTATION VALUES OF SQUARE DISTANCE
Maximum value
Mean value
Sum of Square Distance
Rank
67
78
69
270
1
45
73
54
722
2
34
59
54
1910
3
25
57
36
3090
4
14
35
44
6728
5
4) Assignment of majority class: the first 10 (value of k) of query instances are then ranked based on the most minimum square distances produced. It will often make sense to assign more weight to the nearest neighbours in deciding the class of the query. Classifying component is based on highest rank [22]. Table IV shows the result of brain component.
ISSN : 0975-3397
Vol. 3 No. 2 Feb 2011
984
Noor Elaiza Abdul Khalid et al. / International Journal on Computer Science and Engineering (IJCSE)
TABLE IV.
ASSIGNMENT OF MAJORITY CLASSES
Brain component
Min value
Max value
Mean value
Sum of Square Distance
Rank
Dark Abnormality
67
78
69
270
1
Dark Abnormality
45
73
54
722
2
Ventricle
34
59
54
1910
3
Membrane
25
57
36
3090
4
Light Abnormality
14
35
44
6728
5
5) Determination of class: each query instance is then classified based on the majority categories of brain component it belongs to. From the sample discussed, it can be determined that the query instance is belongs to “ventricles”. 6) Segmentation of brain abnormalities: after each query instance from the overall part of brain image are classified, the brain abnormalities are then identified and segmented. Fig. 5 shows a sample of k-NN abnormalities segmentation. The red colour of segmentation represents the light abnormality, whereas the blue colour of segmentation depicted the dark abnormality region.
(a)
(b)
Figure 5. Skull stripped FLAIR-MRI brain image (a) and Skull stripped FLAIR-MRI brain image after k-NN segmentation (b)
D. Result Analysis The performances of k-NN abnormalities segmentation is tested to 150 controlled testing data. The data is designed by cutting various shapes and size of various abnormalities and pasting it onto normal brain tissues. The tissues are divided into three categories of “low”, “medium” and “high” based on the grey level pixel value intensities as shown in Table V.
ISSN : 0975-3397
Vol. 3 No. 2 Feb 2011
985
Noor Elaiza Abdul Khalid et al. / International Journal on Computer Science and Engineering (IJCSE)
TABLE V. Background Image
BACKGROUND IMAGES
Intensity
Minimum pixel value
Maximum pixel value
Size in pixels
Low
30
114
12144
Medium
39
145
12144
High
56
202
12144
Fig. 6 shows the process to produce the testing data of abnormality images in different background intensities.
Figure 6.
Testing data creation
A statistical method of Receiver Operating Characteristic (ROC) analysis is employed to quantify the k-NN segmentation accuracy. ROC analysis is a plot of the true positive fraction versus the true negative fraction that produced by classifying each data point as positive and negative according to outcome [23]. In this paper, the numbers of pixels of the raw MRI brain testing images are compared with the segmented abnormality area. ROC is used to measure the value of false positive, false negative, true positive and true negative. The sample of four conditions areas of false positive, false negative, true positive and true negative during the segmentation are illustrates in Fig. 7, while the explanation and of each condition is tabulated in Table VI.
ISSN : 0975-3397
Vol. 3 No. 2 Feb 2011
986
Noor Elaiza Abdul Khalid et al. / International Journal on Computer Science and Engineering (IJCSE)
Figure 7. Primary conditions of ROC analysis TABLE VI.
CONDITIONS OF ACCURACY
Condition
Description
False Positive
the normal areas that are incorrectly detected as abnormality
False Negative
the abnormality areas that are not detected
True Positive
the abnormality areas that are correctly detected
True Negative
the normal areas that are correctly undetected
III.
RESULTS
Hundred and fifty testing images had been tested in measuring the performances of the proposed k-NN segmentation technique. Table VII tabulates a few samples of light and dark abnormalities segmentation of testing data produced. TABLE VII. Abnormality
SAMPLES OF TESTING DATA SEGMENTATION
Background Intensity
Testing Image
k-NN Segmentation
High
Light Medium
Low
Dark High
ISSN : 0975-3397
Vol. 3 No. 2 Feb 2011
987
Noor Elaiza Abdul Khalid et al. / International Journal on Computer Science and Engineering (IJCSE)
Medium
Low
The segmentation accuracy performances are statistically measured using ROC analysis. This statistical result is important to determining the efficiency and effectiveness of the proposed k-NN technique in segmentation for brain abnormalities. The summary of ROC analysis for k-NN segmentation is tabulated in Table VIII. TABLE VIII. Abnormality
Light
Dark
SUMMARY OF ROC ANALYSIS OF K-NN SEGMENTATION Background Gray Level Value
Mean of False Positive
Mean of False Negative
Mean of True Positive
Mean of True Negative
High
0.446
0
1
0.554
Medium
0.001
0.063
0.937
0.999
Low
0
0.107
0.893
1
High
0.004
0.064
0.936
0.996
Medium
0.023
0.005
0.995
0.977
Low
0.073
0
1
0.927
From the Table VIII, the k-NN is observed to produce almost excellent segmentation performances in medium background grey level value for light abnormality. The statistics show that the combination of light abnormality within the medium background grey level value produced the highest mean values for both true positive and true negative, which are the most important conditions in producing good quality of segmentation. These conditions proved that the k-NN segmentation results showed some potential as the mean values of false positive and false negative are kept at a perfect rate as well. The combination of light abnormality within the low background grey level value is also monitored to produce high mean values for true positive and true negative, although they are slightly less performed than the medium background grey level value. The combination of light abnormality within high background grey level value produced poor segmentation performances since it appears as the highest mean value of false positive compared to medium and low background grey level value. This is found to be caused by the similarity of texture for both light abnormality and high background grey level value that leads the neighboring pixels to grow outside the abnormality areas. In contrast, the dark abnormalities segmentation is also successfully performed in medium background grey level value. The combination of dark abnormality within medium background grey level value tend to produce the highest mean values of true positive and true negative as compared to the low and high background grey level values. The combination of dark abnormality within the low background grey level value is also cannot be underestimated as it produced high mean values for both true positive and true negative as well. The result of high background grey level value also produced good segmentation although a small occurrence of false positive mean value is observed. IV.
CONCLUSION
This paper has presented a technique of k-Nearest Neighbours (k-NN) for abnormalities segmentation of FLAIR-MRI brain images. The overall experimental result returns good and promising segmentation outcomes for both light and dark abnormalities, which makes the proposed k-NN technique as a potential technique in solving the segmentation problem in medical imagery. The k-NN segmentation is observed to produce good segmentation outcomes in both medium and low background grey level values for light and dark abnormalities. However, the segmentation performances for light and dark abnormalities within the high background grey level
ISSN : 0975-3397
Vol. 3 No. 2 Feb 2011
988
Noor Elaiza Abdul Khalid et al. / International Journal on Computer Science and Engineering (IJCSE)
value are found to be unsatisfactorily especially for light abnormality. These may results from the confusion of distinguishing the similar texture of high background grey level value with the light abnormality. Therefore, several improvements are needed to enhance the segmentation outcomes in future. ACKNOWLEDGMENT The authors would like to thank the Hospital Kuala Lumpur (HKL) for giving their full cooperation during the collection of MRI brain images. Special thanks to the Board Director of HKL, Dr. Hjh Zaleha bt Abdul Manaf the the Head of Radiology (Diagnostic Imaging) Department, and also to all the Diagnostic Imaging staffs. REFERENCES [1]
L. G. Qurat-Ul-Ain, S. B. Kazmi, M. A. Jaffar, and A. M Mirza, “Classification and Segmentation of Brain Tumor using Texture Analysis”, Recent Advances in Artificial Intelligence, Knowledge Engineering and Data Bases, ISBN: 978-960-474-154-0, pp. 147155, 2010.
[2]
L. M. DeAngelis, “Brain Tumors”, The New England Journal of Medicine, Vol. 344, No. 2, pp 114-123, 2001.
[3]
A. M. Riad, A. Atwan, H. M. El-Bakry, R. R. Mostafa, H. K. Elminir, and N. Mastorakis, “A New Approach for Segmentation of Brain MR Image”, Proceedings of the WSEAS International Conference on Environment, Medicine and Health Sciences, ISSN: 17905125, ISBN: 978-960-474-170-0, pp. 74-83, 2010.
[4]
H. B. Kekre, and S. Gharge, “Direct Variance on MRI Images for Tumor Detection”, Journal of Science, Engineering and Technology Management, Vol. 2, No. 1, January 2010, pp. 3-11.
[5]
P. Vasuda, and S. Satheesh, “ Improved Fuzzy C-Means Algorithm for MR Brain Image Segmentation”, International Journal on Computer Science and Engineering (IJCSE), Vol. 02, No. 05, pp. 1713-1715, 2010.
[6]
P. Anbeek, K. L. Vincken, and M. A.Viergever, “Automated MS-Lesion Segmentation by K-Nearest Neighbor Classification”, 2008.
[7]
R. Ganesan, and S. Radhakrisham, “Segmentation of Computed Tomography International Journal of Soft Computing 4(4): pp. 157-161, 2009.
[8]
J. Roerdink, and A. Meijster, “The Watershed Transform: Definitions, Algorithms and Parallelization Strategies”, Fundamenta Informaticae, pp. 187-228, IOS Press, 2001. S. Ibrahim, N. E. A. Khalid, and Manaf M., “Empirical Study of Brain Segmentation using Particle Swarm Optimization”, International Conference on Information Retrieval and Knowledge Management, CAMP’10, 2010. N. M. Noor, N. E. A. Khalid, R. Hassan, S. Ibrahim, and I. M. Yassin, “Adaptive Neuro-Fuzzy Inference System for Brain Abnormality Segmentation”, 2010 IEEE Control and System Graduate Research Colloquium, ICSGRC 2010. N. E. A. Khalid, S. Ibrahim, M. Manaf, and U. K. Ngah, “Seed-Based Region Growing Study for Brain Abnormalities Segmentation”, International Symposium on Information Technology 2010 (ITSim 2010), 2010. K. M. Iftekharuddin, J. Zheng, M. A. Islam, and F. Lanningham, “Brain Tumor Detection in MRI: Technique and Statistical Validation”, Fortieth Asilomar Conference on Signals, Systems and Computers, Oct. 29 2006-Nov, pp. 1983-1987, 2006. S. Shen, W. Snadham, M. Granat, and A. Sterr, “MRI Fuzzy Segmentation of Brain Tissue using Neighborhood Attraction with Neural Network Optimization”, IEEE Transactions on Information Technology in Biomedicine, Vol. 9, Issue 3, Sept. 2005, pp. 459-467, 2005.
[9] [10] [11] [12] [13]
Brains
Images
Using
Genetic
Algorithm”,
[14] T. Kapur, “Segmentation of Brain Tissue from Magnetic Resonance Images”, Med Image Anal., 1(2): pp. 109-27, June 1996. [15] S. Ibrahim, N. E. A. Khalid, and M. Mazani, “Seed-Based Region Growing (SBRG) vs Adaptive Network-Based Inference System (ANFIS) vs Fuzzy c-Means (FCM): Brain Abnormalities Segmentation”, International Journal of Electrical and Computer Engineering, WASET, pp. 94-104, Vol. 5, No. 2, 2010. [16] N. Pradha, and A.K. Sinha, “Development of a composite feature vector for the detection of pathological and healthy tissues in FLAIR MR images of brain”, ICGST International Journal on Bioinformatics and Medical Engineering, BIME, Vol. 10, Issue I, pp. 1-11, 2010. [17] M. A. Masroor, and M. Dzulkifli, “Segmentation of Brain MR Images for Tumour Extraction by Combining Kmeans Clustering and Perona-Malik Anisotropic Diffusion Model”, International Journal of Image Processing, 2008, Vol. 2, Issue 1. [18] S. Warfield, Duda, “K-Nearest Neighbour Classification”, 2001. [19] A. El-Sayed, El-Dahshan, M. S. Abdel-Badeeh, and H. Y. Tamer, “A Hybrid Technique for Automatic MRI Brain Images Classification”, Digital Signal Processing, Vol. 20, Issue 2, March 2010, pp. 433-441. [20] L. P. Clarke,R. P. Velthuizen, S. Phuphanich, J. D. Schellenberg, J. A. Arrington, and M. Silbiger, “MRI: Stability of Three Supervised Segmentation Techniques”, Magnetic Resonance Imaging, 11: pp. 95-106, 1993. [21] C. P´adraig, and J. D. Sarah, “k-Nearest Neighbour Classifiers”, Technical Report UCD-CSI-2007-4, 2007. [22] T. Kardi, “K-Nearest Neighbours Tutorial”, available: http:\\people.revoledu.com\kardi\tutorial\KNN. [23] M. Gribskov, and N. L. Robinson, “The Use of Receiver Operating Characteristic ROC) Analysis to Evaluate Sequence Matching”, 1996.
ISSN : 0975-3397
Vol. 3 No. 2 Feb 2011
989
Noor Elaiza Abdul Khalid et al. / International Journal on Computer Science and Engineering (IJCSE)
AUTHORS PROFILE Dr Noor Elaiza Abdul Khalid is a lecturer in University Technology MARA, Shah Alam, Malaysia. She holds a PhD in Computer Science (2010) from University Technology MARA, a Master in Computer Science (1992) from University of Wales and a Bachelor’s Degree of Computer Science (1995) from University Science Malaysia. Her research interests are Swarm Intelligence, Evolutionary Computing algorithms, Fuzzy techniques and Medical Imaging.
Shafaf Ibrahim is a forth semester student of PhD in Science in University Technology MARA, Shah Alam, Malaysia. She holds a Master in Computer Science (2009) and a Bachelor’s Degree of Computer Science (2007), all from University Technology MARA. Her research interest covers Image Processing, Medical Imaging, Computer Vision, Artificial Intelligence and Swarm Intelligence.
Puteri Nurain Megat Mohd Haniff is a final year student of Bachelor’s Degree in Computer Science in University Technology MARA, Shah Alam, Malaysia. She holds a Diploma in Computer Science (2008), also from University Technology MARA. Her research interest covers Image Processing, Medical Imaging and Artificial Intelligence.
ISSN : 0975-3397
Vol. 3 No. 2 Feb 2011
990