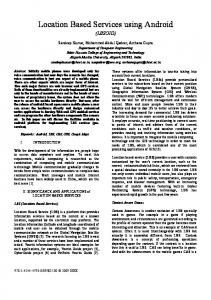
AbstractâThis paper proposes a novel method for location esti- mation of a cell-phone in an indoor environment with experimental validation. The proposed ...
Multi-sensor Location Estimation for Illegal Cell-phone Use in Real-Life Indoor Environment Kentaro Sano, Gia Khanh Tran, Masahiro Watanabe, Kei Sakaguchi, Kiyomichi Araki
Daisuke Hayashi, Toshihiro Yamaguchi, Shintaro Arata
Tokyo Institute of Technology, Tokyo, Japan Email: {sano, khanhtg, watanabe, sakaguchi, araki} @mobile.ee.titech.ac.jp
Koden Electronics Co., Ltd., Tokyo, Japan Email: {d-hay, ymgct-t, arata-s}@koden-electronics.co.jp
Abstract—This paper proposes a novel method for location estimation of a cell-phone in an indoor environment with experimental validation. The proposed method is a location fingerprint scheme which employs the statistical characteristics of the signal crosscorrelation among multiple sensors. As the cross-correlation between a pair of antennas fully stores the information of their complex channel responses, the proposed method can be considered as a generalized scheme of all conventional location fingerprint ones i.e. Received Signal Strength Indicator (RSSI), Time Difference of Arrival (TDOA), and Direction of Arrival (DOA). Besides, different from the conventional methods, in which the locality of spatial correlation is utilized, thus fine grid location measurements is required and environment must be static, the proposed one invokes statistical learning technique and estimates location based on the correlation of received samples with the statistical learning database. Therefore, the proposed method is superior to conventional ones in terms of location estimation accuracy and installation simplicity. An experiment conducted in class room validates the superiority of the proposed method.
I. I NTRODUCTION With the increasing popularity of cell-phone usage, there is a great demand for high accuracy location estimation methods, for example to detect illegal usage, to track the movement of consumers, or provide push services based on user’s location. For these purposes the grid based localization method is introduced in this paper, especially for illegal cell-phone use case such as cheating in the exam. There is a well-known localization method called GPS, however its localization resolution is limited around several meters and the method is only available in outdoor or Line of Sight (LOS) environment from GPS satellites. Due to the demands of high accuracy indoor location estimation, several techniques which are not based on GPS have been investigated in recent years. These methods mainly employ multiple receiver sensors together with a geometric scheme. The well-known metrics of conventional location estimation methods are Received Signal Strength Indicator (RSSI)[1][2][3], Time Different of Arrival (TDOA)[4][5], and Direction of Arrival (DOA)[6][7][8]. These methods often assume ideal scenarios such as LOS; however indoor environment where there are a lot of obstacles is typically a Non-Line of Sight (NLOS) environment with severe multi path fading. Thus conventional methods are
978-1-4673-2054-2/12/$31.00 ©2012 IEEE
80
hard to be applied in realistic indoor environments as they always achieve low accuracy[9]. For this reason, statistical and neat techniques are introduced in combination with Wireless Sensor Network (WSN) using the approach of iterative, distributed and scalable system[10][11]. These methods are mainly aiming to construct a relative location estimation for WSN, which mostly use UWB ranging model and assume cooperative localization to achieve high accuracy. However, these methods are not applicable for the problem of cell-phone localization considered in this paper since cell-phone does not employ UWB and furthermore signals from cell-phone are illegally (unpredictably) transmitted. On the other hand, location fingerprint method has also been investigated to conquer the severe multi path environment[12]. The location fingerprint method is effective in indoor environment because this method utilizes the multi path environment as a characteristic of the location. But conventional location fingerprint method also has some problems. One is that this method assumes the measured environment is static. Another is that the spatial correlation of the location fingerprint is quite local and fine grid measurement is required. Thus it is impractical to employ the conventional location fingerprint method in daily life. In this paper, we introduce a new method which is one of the location fingerprint methods utilizing signal cross-correlation as a location fingerprint and employing statistical technique. We further validate the method by an experiment in a class room at TokyoTech to show the superiority of our idea of utilizing signal cross-correlation. The signal cross-correlation contains whole information of complex channel response which means that we can derive RSSI, TDOA and DOA information from the signal cross-correlation[13]. Different from conventional methods which extract separated information e.g. RSSI, TDOA, DOA from the estimated channel response, all these information are preserved in our proposed method. We also introduce statistical machine learning to create decision regions for channel response patterns and refer the received signal cross-correlation as a pattern for location identification. By introducing statistical machine learning it is possible to avoid the fine grid measurement problem of location fingerprint method. Combining these ideas our proposed system is validated through experiments to show its effectiveness
Proceedings of the 2012 IEEE ICCS
in indoor location estimation. II. C ONVENTIONAL METHODS RSSI is the most feasible technique using a hardware architecture which has already been implemented in WiFi. RSSI requires at least 3 sensors. Each sensor calculates the distance from the target by the received signal strength and a specific path loss model and then the sensors geometrically identify the transmitter’s location from the estimated distances. RSSI has a low accuracy problem due to varying signal strength because of multi path fading and noise, which results in estimation error. The problem is especially severe in indoor multi path environment.
d1
Sensor #1 Target Sensor #2 d2 Sensor #3 d3
Fig. 1.
RSSI.
TDOA also uses at least 3 sensors and the target signal’s time difference of arrival among these sensors are recorded. The target’s location can be estimated as the cross-point of the trajectories defined by the arrived time difference between any couple of sensors. TDOA has a same problem of RSSI i.e. vulnerable to multi path in indoor environment and it further requires highly accurate synchronization among sensors. DOA uses at least 2 sensors. DOA employs array antenna on each sensor and estimates the direction of arrival based on the received signal’s phase difference between the antennas of the array. The target’s location can be estimated as the crosspoint of the two lines denoting the estimated directions of arrival toward the sensors. Direction estimation is performed by the array antenna’s steering vector. DOA can only ensure precise detection in LOS environment and also faces low accuracy in indoor environment. Furthermore, DOA requires very precise antenna layout and a lot of antennas for achieving accuracy in DOA estimation. So the method is not practical in indoor environment. In response to these conventional methods and problems, two different approaches are proposed. One is to introduce neat techniques which employ a statistical model in combination with a distributed, iterative and scalable system of WSN. Another is location fingerprint technique which is able to characterize a multi path environment, that is problematic in conventional methods. Owing to its nature, spatial correlation of multi path fading is very local and fine grid location measurement is required at the expense of increasing installation cost. Our proposed method aims to conquer the downside of location fingerprint method for detecting illegal use of LTE cel-phone in situation e.g. cheating in an exam. III. P ROPOSED METHOD This paper proposes two important concepts, signal cross-correlation between antennas that fully stores the
81
information of their complex channel responses and the utilization of statistical machine learning in location fingerprint. A. Signal cross-correlation between antennas We consider an indoor environment and illustrate the situation in Fig. 2. The receive signal can be modeled as follow, yi,ψ (m, t˜) =
∞ �
hi,ψ (τ, t˜)s(m − τ, t˜) + zi (m, t˜)
(1)
τ =−∞
where yi,ψ (m, t˜) denotes the receive signal at the i-th receive antenna from a transmitter located at location ψ, hi,ψ (m, t˜) and s(m, t˜) respectively denote the channel response and the transmitted signal and zi (m, t˜) is the zero-mean Gaussian noise with variance σ 2 . Furthermore, m denotes a discrete time variable, t˜ is a long-term time variable responsible for channel varying, and τ is a discrete delay time variable characterizing the delay spreading of multi path fading. Defining R[A(m), B(m)](n) as the cross-correlation between A(m) and B(m) by a discrete delay n, the cross-correlation between yk,ψ (m) and yl,ψ (m) becomes ˜ R[yk,ψ (m, t˜), yl,ψ (m, t˜)](n) � Rψ k,l (n, t) ∞ � yk,ψ (m, t˜)yl,ψ (m + n, t˜)∗ = =
m=−∞ ∞ �
∞ �
� hk,ψ (τk , t˜)hl,ψ (τl , t˜)∗
τk =−∞ τl =−∞
�
R[s(m, t˜), s(m, t˜)](τk − τl + n) + Dk,l σ 2 δ(n)
(2)
where Dk,l is 1 when k = l and 0 when k �= l and δ(n) is Dirac’s delta function. Providing the difference between the delay time Δτ = τl −τk , the cross-correlation of the receive signals is further expressed as R[yk,ψ (m, t˜), yl,ψ (m, t˜)](n) � ∞ � R[s(m, t˜), s(m, t˜)](n − Δτ ) = Δτ =−∞
� R[hk,ψ (τk , t˜), hl,ψ (τl , t˜)](Δτ )
+ Dk,l σ 2 δ(n) = R[s(m, t˜), s(m, t˜)](Δτ ) ⊗n R[hk,ψ (τk , t˜), hl,ψ (τl , t˜)](Δτ ) + Dk,l σ 2 δ(n)
(3)
where ⊗n denotes a convolution of variable n. From (3), we understand that the cross-correlation between yk,ψ and yl,ψ is the convolution of the auto-correlation function of the transmit signal and the cross-correlation function of the channel responses thus fully contains information of the channel responses. It suggests that employing cross-correlation can generalize conventional location fingerprint methods using RSSI, TDOA and DOA. Location fingerprint method also has problems of the requirement of the fine grid measurement and the static
Proceedings of the 2012 IEEE ICCS
~
~
~
|R[s(m,t),s(m,t)](Δτ)|
~
|R[hk,ψ(m,t),hl,ψ(m,t)](Δτ)|
#4 Intra-sensor antenna pair ~
#1
~ ~ h1,ψ(m,t) s(m,t)
#5
ψ
#7
#6 #2
T
t
#3 0
0
Δτ
~
Q
~
|R[yk,ψ(m,t),yl,ψ(m,t)](n)|
Fig. 2.
Δτ
Inter-sensor antenna pair ~
~
R[yk,ψ(m,t),yl,ψ(m,t)](0)
The illustration of the class room situation.
environment. So that we introduce statistical scheme into location fingerprint technique to conquer the problems of locality and dynamic environment.
···
˜ Rψ k,l (N, t)
n
0 TDOA
Fig. 3.
�T
(4)
Here we consider the discrete truncation of the cross-correlation ψ ˜ (t) has within 2N + 1 samples i.e. −N ≤ n ≤ N. Therefore, Rk,l 2N + 1 dimensions where N is decided from the maximum delay spread. The concept of the cross-correlation of received signals
82
Product of cross-correlation.
is shown in Fig. 3. The figure shows that the cross-correlation has RSSI, TDOA and DOA information. It can be said that conventional methods evaluate only the peak of the cross-correlation to derive RSSI by the absolute value of the peak, TDOA by the index n of the peak and DOA by the phase of the peak. However, our proposed method does not evaluate a specific index n but the whole delay path. Thus the proposed method preserves whole information of the channel responses. To learn ψ ˜ the cross-correlation vectors Rk,l (t) for extracting information about channel responses means to define the decision region of ψ ˜ category ψ by pattern Rk,l (t) in statistic machine learning. In this paper, we employ Maximum Likelihood Estimation (MLE) with ψ ˜ some probabilistic distribution assumption about Rk,l (t). The concept of this method is illustrated in Fig. 4. Now we consider how to accumulate the data and how to define the evaluation function pk,l (·|ψ) which corresponds to the decision regions. Learning phase ~ ψ1
Rk,l ~ψ
Rk,l2
~ t
E[ ] ・
~ t
cov[ ] E[ ] ・
The target Estimated position ^
pk,l( |ψ2) ・
・
Rk,l
~ ψ0
Rk,l
pk,l( |ψ1) ・
・
cov[ ]
~ ψP
Estimation phase
~ t
・・・
ψ ˜ (t) = Rk,l � ψ ˜ ˜ Rψ k,l (−N, t) Rk,l (−N + 1, t)
I
RSSI
B. Statistical machine learning for location fingerprint Assuming that the purpose of using location estimation system is to detect the cheating with cell-phone in an exam, the estimator is the grid point ψ corresponding to a seat and thereby we can accumulate the cross-correlation by the daily use of cellphone in the class room. For a cell-phone at a specific seat, of course, the training signal is transmitted somewhere around the seat but the actual position of the transmitter is not fixed. So, the cross-correlation is fluctuated and our proposed method’s statistic machine learning becomes effective. At first, we consider the statistical characteristic of the cross-correlation of signals between receive antennas. As explained above the statistical characteristic of the cross-correlation can be described by the statistical characteristics of the auto-correlation function of the transmitted signal and the cross-correlation function of the channel responses. The statistical characteristic of the auto-correlation function of the transmitted signal can be considered constant because it is determined by the modulation and the transmit filter of signal. On the other hand, the cross-correlation function of the channel responses depends on the changing environment as well as the location of the transmitter. So, the fluctuation of the cross-correlation is affected mainly by the cross-correlation of the channel responses. Fluctuation of the channel becomes a problem with conventional location estimation methods but our proposed method is robust against the fluctuation because the statistical machine learning is employed in which the fluctuation is utilized as a statistical characteristic of the channel responses. It means that the first step of the proposed method is to statistically achieve the cross-correlation of the received signals that has whole statistic information about channel responses at each grid point. Now let us describe R[yk,ψ (m, t˜), yl,ψ (m, t˜)](n) in vector form ψ ˜ (t) as Rk,l
DOA
Ψ
~
t
arg max ψ
E[ ] ・
ΣΣlog{p (R |ψ)} k,l
k
~ ψ0
ψ
k,l
l
pk,l( |ψP) ・
cov[ ] ・
Database Fig. 4.
P: the number of the grid points The concept of the machine learning scheme.
Now by the central limit theorem, it is practical to assume ψ ˜ the vector Rk,l (t) follows the multi-dimensional Gaussian distribution characterized by two statistical parameters i.e. the mean value vector and the covariance matrix. Utilizing the multidimensional Gaussian distribution and its covariance matrix, the decision region can be defined by the Mahalanobis distance. The learning phase is equivalent to calculating the mean vector and the covariance matrix of sample data in statistical machine learning process. When the antenna k and l are located at a same sensor,
Proceedings of the 2012 IEEE ICCS
ψ ˜ owing to the steering vector, the mean vector of Rk,l (t) has information of RSSI, DOA but TDOA because the antennas are co-located. We call this antenna pair’s arrangement intrasensor case. If the antenna k and l are not equipped at a same sensor and they are sufficiently apart from each other, the phase of the cross-correlation of the channel responses� is uniformly � ψ ˜ distributed unlike the intra-sensor case. Thus Et˜ Rk,l (t) = 0 where Et˜[·] denotes the expectation operator by variable t˜. We call this antenna pair’s arrangement inter-sensor case. To prevent ψ ˜ information loss, we define the absolute vector of Rk,l (t) as follow, ψ ˜ Rk,l (t) = � � � � � ψ �Rk,l (−N, t˜)�
+
� � � ψ � �Rk,l (−N + 1, t˜)�
···
� � �T � ψ � �Rk,l (N, t˜)� (5)
The absolute vector of the cross-correlation of the received signals contains RSSI and TDOA information but DOA information. The database for cross-correlation learning is redefined as � ψ intra-sensor Rk,l (t˜) ψ ˜ (t˜) � R (6) k,l + ψ ˜ Rk,l (t) inter-sensor ˜ ψ (t˜) follows the multiFor ease of discussion, we assume that R k,l dimentional Gaussian distribution and MLE can be employed by calculating the Mahalanobis distance1 . Then the learning data, i.e. the mean value vector and the covariance matrix, are defined as follows. � � ¯ ψ = E˜ R ˜ ψ (t˜) R (7) t k,l k,l
�
�H ψ ˜ ψ (t˜) − R ˜ ψ (t˜) − R ¯ψ ¯ψ R = Et˜ R Ck,l k,l k,l k,l k,l ¯ ψ is the mean vector where H denotes a Hermitian transpose, R k,l ψ ˜ ψ (t˜) by t˜. Then the by t˜ and Ck,l is the covariance matrix of R k,l probability function forming decision region is defined as 1
�
ψ Ck,l
�−1 1 ψ H ψ ψ ¯ ¯ (x − Rk,l ) exp − (x − Rk,l ) Ck,l 2
pk,l (x|ψ) =
(2π)2N+1 det
(8)
¯ ψ but also the In this method, not only the mean value vector R k,l ψ covariance matrix Ck,l are function of the antenna index k and l and the transmitter’s position ψ. C. Location estimation When the sensors detect suspicious signal sent from an unknown position ψ0 in the exam, the proposed method starts to estimate the location of the cell-phone in illegal use. Through the learning phase, the system employing our proposed method has 1 The absolute vector + Rψ (t˜) will not follow Gaussian distribution due to k,l the operation executed in (5). For exact calculation of the Mahalanobis distance ψ ψ ˜ of + Rk,l (t˜), some other suitable distributions for the absolute vector + Rk,l (t) should be studied and employed. However at the current stage, the assumption of Gaussian distribution for simplicity.
83
attained the learning database. Therefore, the most suspicious location can be estimated as the location with the highest likelihood which is computed by substituting the modified cross-correlation ˜ ψ0 into the evaluation function (8) for of the received signal R k,l all location candidates ψ. Now we assume the prior probability about ψ is uniform and the reliability of each antenna pair is equal. Thus the log-likelihood function can be calculated as in (10). � ψ0 intra-sensor Rk,l ψ 0 ˜ = R (9) k,l + ψ0 Rk,l inter-sensor
�� �� ˜ ψ0 |ψ log pk,l R (10) ψˆ = arg max k,l ψ
k
l
where ψˆ is the estimated location. Perfect estimation is achieved if ψˆ = ψ0 . IV. E XPERIMENT We conducted an experiment to validate our proposed method in a class room at TokyoTech simulating an entrance exam with a cheating scenario using cell-phone shown in Fig. 5. There were 4 sensors each equipped with one antenna and located at every corner of the class room. There was another sensor equipped with a 3 antenna array located at the center of the class room. The transmitter was an LTE cell-phone with the center frequency fc = 1.9575 GHz and a bandwidth B = 3.6 MHz. We used the LTE cell-phone because LTE is recognized as cell-phone system following 3G and it has a sophisticated reference signal called Sounding Reference Signal (SRS)[14]. The transmitter was respectively settled at each grid point corresponding to a seat. The grid spacing is at least 0.78m and this distance is sufficiently larger than the wave-length which means there is no spatial correlation between each grid point. This rough grid setting differs the proposed method from conventional location fingerprint methods. There was no one present in the room except one of the experiment staff, so the multi path environment was nearly constant. At a certain 20cm-width seat, the transmitter was respectively placed every 2cm to the right and measurements were performed twice at each place, which resulted in a totally 20 measurements at each point. These measurements at a seat imitate the dynamic propagation environment and validate the introduction of the statistical method. Seat index was defined as 1 to 144 from the left top to the right bottom seat as shown in Fig. 5. In this experiment we test the accuracy of RSSI, TDOA and proposed method. RSSI and TDOA are tested based on the TABLE I E XPERIMENT SPECIFICATION . Center frequency Bandwidth Sampling rate Transmitter Grid point Grid interval Measurement
1.9575 GHz 3.6 MHz 100 MHz LTE cell-phone (Docomo L-02C) 114 points 1.2 m (row) / 0.78 m (column) 20 times / grid point
Proceedings of the 2012 IEEE ICCS
location fingerprint and rough grid measurement.
20 cm Transmitter
Fig. 5.
Class room settings and antenna.
recorded signals, 20 times per seat. As explained in Sect. III, the proposed method needs a learning phase. Thus among 20 measurement data at a seat, we employ the cross validation. One recorded signal is picked up and used as the signal from the target node, while the rest 19 recorded signals are employed for the learning phase to construct the database. As any single among the 20 recorded ones can be selected as the target signal, the proposed method is also tested 20 times per seat. These three methods are evaluated using the metric of mean distance error E[ψˆ − ψ0 ]. Figure 6 shows the mean distance error which is the average distance errors of 20 tests at each seat. 8
b
(Mean: 3.02m) RSSI TDOA (Mean: 3.94m) Proposed (Mean: 0.40m)
Mean distance error (m)
7 6 5 4 3 2 1 0b 1
10
20
30
40
50
60
70
80
90
100 110
Seat index Fig. 6.
Mean distance error of each point.
In this figure, the proposed method is obviously accurate in spite of a spatially rough measurement and a forced fitting of the ˜ ψ (t˜) into Gaussian distribution. The experiment distribution of R k,l results validate the effectiveness of our proposed method. The mean distance error of RSSI and TDOA is up to 7m and it means that they are almost useless regarding the size of the class room. In contrast, the proposed method achieves high location estimation accuracy at every seats with a mean distance error much smaller than the seat spacing of 0.78m. This result shows the validity of introducing statistical machine learning method for
84
V. C ONCLUSION In this paper, we introduced a new location estimation method which employs location fingerprint technique and statistical machine learning. Location estimation in indoor environment is very needed but difficult to implement because of severe multi path. The experiment results showed the conventional methods i.e. RSSI and TDOA are almost useless in indoor environment without some neat techniques. Although conventional location fingerprint method assumes the propagation environment is static and needs fine grid measurement because of the locality of the spacial correlation, by introducing statistical approach, our proposed method employed a location fingerprint without requiring for the condition of static environment as well as fine grid measurement. Therefore, our proposed method is effective in even in a timevarying environment as proved by the experiment. There are more and more needs for location estimation in indoor environment and our proposed method showed that the idea of employing statistical machine learning is extremely important. Then more research for the distribution model about cross-correlation and more improvement of the decision region or learning method are the future issue. R EFERENCES [1] N. Patwari, A.O. Hero III, M. Perkins, N.S. Correal, and R.J. O ’Dea, ”Relative Location Estimation in Wireless Sensor Networks”, IEEE Trans. Signal Processing, vol. 51, no.8, pp. 2137-2148, Aug. 2003. [2] S Cho, ”Localization of the arbitrary deployed APs for indoor wireless location-based applications”, IEEE Trans. Cons Electron., vol.56, no.2, pp.532-538, May. 2010. [3] Shih-Hau Fang, Tsung-Nan Lin, ”Indoor Location System Based on Discriminant-Adaptive Neural Network in IEEE 802.11 Environments”, IEEE Trams. Neural Networks, vol.19, no.11, pp.1973-1978, Nov. 2008. [4] Z. Merhi, M. Elgamel and M. Bayoumi, ”A Lightweight Collaborative Fault Tolerant Target Localization System for Wireless Sensor Networks”, IEEE Trans. Mobile Computing, vol. 8, no.12, pp.1690.1704, Dec 2009. [5] Li, B., Wang, Y., Lee, H.K., Dempster, A.G., Rizos, C., ”Method for Yielding a Database of Location Fingerprints in WLAN”, IEEE Proc.,Communications, vol.152, no.5, pp. 580-586. Oct. 2005. [6] S. Kikuchi, H. Tsuji, R. Miura, A. Sano, ”Mobile-Terminal Localization Based on Local Scattering Model in Multipath Environments”, IEICE Transactions on Communications, vol.J87-B, no.12, pp.2020.2028, Dec. 2004. [7] C.-C. Lim, Y. Wan, B.-P. Ng, and C.-M. S. See, ”A real-time indoor WiFi localization system using smart antenna”, IEEE Trans. Consum. Electron., vol.53, no.2, pp.618-622, May. 2007. [8] Abdul Hafiizh, Shigeki Obote and Kenichi Kagoshima, ”DOA-RSSI Multiple Subcarrier Indoor Location Estimation in MIMO-OFDM WLAN APs Structure”, World Applied Sciences Journal vol.7, no.24, pp.182-187, 2009 [9] H. Liu, H. Darabi, P. Banerjee, and J. Liu, ”Survey of wireless indoor positioning techniques and systems”, IEEE Trans. Syst., Man, Cybern. C: Applications and Reviews, vol. 37, no. 6, pp. 1067-1080, Nov. 2007. [10] S. Zhu, Z. Ding, ”Distributed Cooperative Localization of Wireless Sensor Networks with Convex Hull Constraint”, IEEE Trans. Wireless Communications, vol.10, no.7, pp.2150-2161, Jul. 2011. [11] H. Wymeersch, J. Lien, Moe Z. Win, ”Cooperative Localization in Wireless Networks”, Proceedings of the IEEE, vol.97, no.2, pp. 427-450, Feb. 2009. [12] S. Ikeda, H. Tsuji, T. Ohtsuki, ”Effects of Spatial Correlation between Signal Subspaces on Indoor Localization Using Subspace Matching”, Technical Report of IEICE, vol. 107, No. 306, RCS2007-99, pp. 13-17, Nov. 2007. [13] M. Watanabe, T. Sekiguchi, Gia Khanh Tran, K. Sakaguchi, K. Araki, D. Hayashi, S. Arata, ”Detection of unidentified radio emitter employing multiple sensors toward the realization of distributed spectrum monitor”, Technical Report of IEICE, vol. 111, no. 261, SR2011-62, pp. 127-134, Oct. 2011. [14] 3GPP, TS 36.211, http://www.3gpp.org/ftp/Specs/2011-09/Rel10/36 series/36211-a30.zip, Sep.2011.