Multiobjective Immune Algorithm with Nondominated Neighbor-based Selection Maoguo Gong
[email protected] Institute of Intelligent Information Processing, Xidian University, Xi’an 710071, China
Licheng Jiao
[email protected] Institute of Intelligent Information Processing, Xidian University, Xi’an 710071, China
Haifeng Du
[email protected] School of Public Policy and Administration, Xi’an Jiaotong University, Xi’an 710049, China
Liefeng Bo
[email protected] Institute of Intelligent Information Processing, Xidian University, Xi’an 710071, China
Abstract Nondominated Neighbor Immune Algorithm (NNIA) is proposed for multiobjective optimization by using a novel nondominated neighbor-based selection technique, an immune inspired operator, two heuristic search operators, and elitism. The unique selection technique of NNIA only selects minority isolated nondominated individuals in the population. The selected individuals are then cloned proportionally to their crowding-distance values before heuristic search. By using the nondominated neighbor-based selection and proportional cloning, NNIA pays more attention to the less-crowded regions of the current trade-off front. We compare NNIA with NSGA-II, SPEA2, PESA-II, and MISA in solving five DTLZ problems, five ZDT problems and three low-dimensional problems. The statistical analysis based on three performance metrics including the Coverage of two sets, the Convergence metric, and the Spacing, show that the unique selection method is effective, and NNIA is an effective algorithm for solving multiobjective optimization problems. The empirical study on NNIA’s scalability with respect to the number of objectives shows that the new algorithm scales well along the number of objectives. Keywords Multiobjective optimization, evolutionary algorithm, artificial immune system, crowding-distance, Pareto-optimal solution.
1 Introduction Many real-word problems have several objectives to be optimized at the same time. The simultaneous optimization of multiple objectives is different from single objective optimization in that there is no unique solution to multiobjective optimization problems (MOPs), but instead, we aim at finding all of the good trade-off solutions which must be considered equivalent in the absence of information concerning the relevance of each objective relative to the others. Evolutionary algorithms (EAs) have been recognized to be well suited to multiobjective optimization since early in their development because they deal simultaneously with a set of possible solutions. The ability to handle complex problems, involving features such as discontinuities, multimodality, disjoint c °200X by the Massachusetts Institute of Technology
Evolutionary Computation x(x): xxx-xxx
M. Gong, L. Jiao, H. Du and L. Bo
feasible spaces and noisy function evaluations, reinforces the potential effectiveness of EAs in multiobjective optimization (Fonseca and Fleming, 1995). The vector evaluated genetic algorithm (Schaffer, 1984) was probably the first multiobjective optimization EA (MOEA) to search for multiple Pareto-optimal solutions concurrently in a single run. Since the middle 1990s, the number of literatures about MOEAs increased greatly and many MOEAs were proposed one after another. The Niched Pareto Genetic Algorithm (Horn and Nafpliotis, 1993) and the Non-dominated Sorting Genetic Algorithm (Srinivas and Deb, 1993) were representative of them. These MOEAs were characterized by the use of selection mechanisms based on Pareto ranking and fitness sharing to maintain diversity (Coello Coello, 2003). In the past few years, some MOEAs using elitism strategy were presented such as the Strength Pareto Evolutionary Algorithm (SPEA) (Zitzler and Thiele, 1999), the Pareto Archived Evolution Strategy (PAES) (Knowles and Corne, 2000), the Pareto Envelope based Selection Algorithm (PESA) (Corne et al., 2000), the Multi-Objetive Messy Genetic algorithm (MOMGA) (Van Veldhuizen and Lamont, 2000), the revised version of PESA with region-based selection (PESA-II) (Corne et al., 2001), the Micro Genetic Algorithm (microGA) (Coello Coello and Pulido, 2001), the improved version of NSGA (NSGA-II) with a more efficient nondominated sorting method, elitism and a crowded comparison operator without specifying any additional parameters for diversity maintaining (Deb et al., 2002a), and the improved version of SPEA (SPEA2) with a revised fitness assignment strategy, a nearest neighbor density estimation technique and an enhanced archive truncation method (Zitzler et al., 2002). These MOEAs can be considered to be different MOEAs in the sense that their different ways to do selection (or fitness assignment) and population maintenance in multiobjective spaces. Coello Coello maintains an evolutionary multiobjective optimization repository at (www.lania.mx/˜ccoello/EMOO) in which almost all of these algorithms can be found. The human immune system (HIS) is a highly evolved, parallel and distributed adaptive system. The information processing abilities of HIS provide important aspects in the field of computation. This emerging field is referring to as the Artificial Immune Systems (AIS) (Tarakanov and Dasgupta, 2000). In recent years, AIS have received significant amount of interest from researchers and industrial sponsors. Applications of AIS include such areas as machine learning, fault diagnosis, computer security, and optimization (Nicosia et al., 2004; Jacob et al., 2005). Recently, Coello Coello proposed an artificial immune system algorithm MISA (Coello Coello and Cortes, 2002, 2005) based on the clonal selection principle (Burnet, 1959) to solve multiobjective optimization problems. We also proposed an immune algorithm IDCMA (Jiao et al., 2005) which is the groundwork of this paper. Both the two algorithms adopted binary representation. Freschi and Repetto (2005) proposed a vector Artificial Immune System (VAIS) based on the multimodal optimization algorithm opt-aiNet (de Castro and Timmis, 2002). In this paper, we propose a novel multiobjective algorithm, called Nondominated Neighbor Immune Algorithm (NNIA). In NNIA, the fitness value of each nondominated individual is assigned as the average distance of two nondominated individuals on either side of this individual along each of the objectives, namely, the crowdingdistance defined by (Deb et al., 2002a). According to the fitness values, only partial nondominated individuals with greater crowding-distance values are selected to do proportional cloning, recombination, and hypermutation. So in a single generation, NNIA pays more attention to the less-crowded regions (referred to Section 2.3) in the current trade-off front. 2
Evolutionary Computation
Volume x, Number x
Multiobjective Immune Algorithm with Nondominated Neighbor-based Selection
The remainder of this paper is organized as follows: Section 2 describes related background including multiobjective optimization, immune system inspired optimization algorithms, and three terms used in this paper. Section 3 describes the main loop of NNIA. The fitness assignment, population evolution, and computational complexity of NNIA are also analyzed in Section 3. In Section 4, five DTLZ problems (Deb et al., 2002b), five ZDT problems (Zitzler et al., 2000) and three low-dimensional problems are used to evaluate NNIA’s effectiveness by comparing with NSGA-II, SPEA2, PESA-II and MISA, based on three performance metrics, the Coverage of two sets (Zitzler and Thiele, 1998), the Convergence metric (Deb and Jain, 2002), and the Spacing (Schott, 1995). The comparison of NNIA with and without recombination, and NNIA’s scalability along the number of objectives will also be investigated. In Section 5, concluding remarks are presented.
2 Related Background 2.1
Multiobjective Optimization
Multiobjective Optimization (Deb, 2001; Coello Coello et al., 2002) seeks to optimize a vector of functions, ¡ ¢T F(x) = f1 (x), f2 (x), · · · , fk (x) (1) subject to x = (x1 , x2 , · · · , xm ) ∈ Ω. Where x is called the decision vector, and Ω is the feasible region in decision space. Considering a maximization problem for each objective, it is said that a decision vector xA ∈ Ω dominates another vector xB ∈ Ω (written as xA Â xB ) if and only if ∀i = 1, 2, · · · , k
fi (xA ) ≥ fi (xB ) ∧ ∃j = 1, 2, · · · , k
fi (xA ) > fi (xB )
(2)
We say that a vector of decision variables x∗ ∈ Ω is a Pareto-optimal solution or nondominated solution if there does not exist another x ∈ Ω such that x  x∗ . Then the Pareto-optimal set is defined as 4
P∗ = {x∗ ∈ Ω|¬∃x ∈ Ω, x  x∗ }
(3)
So the Pareto-optimal set is the set of all Pareto-optimal solutions. The corresponding image of the Pareto-optimal set under the objective function space ¡ ¢T ª 4 © PF∗ = F(x∗ ) = f1 (x∗ ), f2 (x∗ ), · · · , fk (x∗ ) |x∗ ∈ P∗
(4)
is called the Pareto-optimal front. The aim of an MOEA is to find a set of Pareto-optimal solutions approximating the true Pareto-optimal front. 2.2
Immune System Inspired Optimization Algorithms
The immune system’s ability to adapt its B-cells to new types of antigens is powered by processes known as clonal selection and affinity maturation by hypermutation (Garrett, 2005). The majority immune system inspired optimization algorithms are based on the applications of the clonal selection and hypermutation (Hart and Timmis, 2005). The first immune optimization algorithm may be (Fukuda et al., 1993) that included an abstraction of clonal selection to solve computational problems. But the clonal selection algorithm for optimization has been popularized mainly by de Castro and Von Zuben’s CLONALG (de Castro and Von Zuben, 2002). CLONALG selects part fittest antibodies to clone proportionally to their antigenic affinities. The hypermutation operator Evolutionary Computation
Volume x, Number x
3
M. Gong, L. Jiao, H. Du and L. Bo
performs an affinity maturation process inversely proportional to the fitness values generating the matured clone population. After computing the antigenic affinity of the matured clone population, CLONALG creates randomly part new antibodies to replace the lowest fitness antibodies in current population and retain best antibodies to recycle. de Castro and Timmis (2002) proposed an artificial immune network called opt-aiNet for multimodal optimization. In opt-aiNet, antibodies are part of an immune network and the decision about the individual which will be cloned, suppressed or maintained depends on the interaction established by the immune network. Garrett (2004) has presented an attempt to remove all the parameters from the clonal selection algorithm. This method, which is called ACS for short, attempts to self-evolve various parameters during a single run. Cutello and Nicosia proposed an immune algorithm for optimization called opt-IA (Cutello et al., 2004, 2005b). Opt-IA uses three immune operators, cloning, hypermutation and aging. In hypermutation operator, the number of mutations is determined by mutation potential. The aging operator eliminates old individuals to avoid premature convergence. Opt-IA also uses a standard evolutionary operator, (µ + λ)-selection operator. As far as multiobjective optimization is concerned, MISA (Coello Coello and Cortes, 2002, 2005) may be the first attempt to solve general multiobjective optimization problems using artificial immune systems. MISA encodes the decision variables of the problem to be solved by binary strings, clones the Paretooptimal and feasible solutions, and applies two types of mutation to the clones and other individuals, respectively. More recently, Freschi and Repetto (2005) proposed a vector Artificial Immune System (VAIS) for solving multiobjective optimization problems based on the opt-aiNet. VAIS adopted the flowchart of opt-aiNet and the fitness assignment method in SPEA2 with some simplification that for nondominated individuals the fitness is the strength defined in SPEA2 and for dominated individuals the fitness is the number of individuals which dominate them. Cutello et al. (2005a) modified the (1+1)-PAES using two immune inspired operators cloning and hypermutation and applied the improved PAES to solving the protein structure prediction problem. In order to compare these algorithms clearly, we summarize their key techniques in Table 1. In (Jiao et al., 2005), we have proposed an immune algorithm for multiobjective optimization named Immune Dominance Clonal Multiobjective Algorithm (IDCMA). IDCMA assigned the fitness values of current dominated individuals as the values of a custom distance measure, termed as Ab-Ab affinity, between the dominated individuals and one of the nondominated individuals found so far. According to the values of Ab-Ab affinity, all dominated individuals (antibodies) are divided into two kinds, subdominant antibodies and cryptic antibodies. And heuristic search only applies to the subdominant antibodies while the cryptic antibodies are redundant and have no function during search, but they can become subdominant (active) antibodies in the subsequent evolution. But recently, we found that the IDCMA which adopts binary string representation and the Ab-Ab affinity based selection on dominated individuals had difficulties in converging to the true Pareto-optimal front and obtaining the well-distributed solutions for some complicate problems, e.g. the DTLZ problems (Deb et al., 2002b). So we modified the IDCMA by using real-coded representation and a new selection technique and population maintenance strategy, the NNIA was proposed accordingly.
4
Evolutionary Computation
Volume x, Number x
Multiobjective Immune Algorithm with Nondominated Neighbor-based Selection
Table 1: Main optimization algorithms inspired by immune system Algorithm CLONALG
Fitness Assignment The objective function to be optimized
Key Components Elitist selection,Cloning, mutation, death
Opt-aiNet
The objective function to be optimized and the Euclidean distance between two individuals The objective function to be optimized The objective function to be optimized
Elitist selection, Cloning, mutation, network suppression, death Elitist selection, Cloning, mutation, death (µ + λ)-selection, Cloning, Hypermutation, Hypermacromutation, Aging Elitist selection according to fitness and diversity, Cloning, uniform mutation and non-uniform mutation, archive update Cloning,mutation, clonal selection, suppression, death, archive update
ACS opt-IA
MISA
The objective functions and the Pareto dominance relationships, the Euclidean distance between two individuals
VAIS
For Pareto-optimal individuals the fitness is the strength defined in SPEA2 and for dominated individuals the fitness is the number of individuals which dominate them The Pareto dominance relationships
I-PAES
2.3
Cloning,mutation, clonal selection, (1+1)-selection, archive update
Applications Single objective optimization problems (SOPs) SOPs
SOPs SOPs
MOPs
MOPs
MOPs
Summary of Related Terms
In this paper, we follow the nomenclature of immunology and define the terms as follows. 2.3.1 Antibody and Antibody Population For the MOP ½ ¡ ¢T max F(x) = f1 (x), f2 (x), · · · , fk (x) subject to x ∈ Ω
(5)
where x = (x1 , x2 , · · · , xm ), Ω is the feasible region, and k ≥ 2, an antibody b = (b1 , b2 , · · · , bl ) is the coding of variable x, denoted by b = e(x), and x is called the decoding of antibody b, expressed as x = e−1 (b). In this study, we adopt real-valued presentation, i.e. b = e(x) = x, so l = m, and b ∈ Ω. An antibody population B = {b1 , b2 , · · · , bn }, bi ∈ Ω, 1 ≤ i ≤ n
(6)
is an n-dimensional group of antibody b, where the positive integer n is the size of antibody population B. 2.3.2 Dominant Antibody For the MOP in equation (5), the antibody bi is a dominant antibody in the antibody population B = {b1 , b2 , · · · , bn } , if and only if there is no antibody bj ∈ B that satisfies the equation (7) ¡ ¢ ¡ ¢ ∀p = 1, 2, · · · , k fp e−1 (bj ) ≥ fp e−1 (bi ) ∧ Evolutionary Computation
Volume x, Number x
5
M. Gong, L. Jiao, H. Du and L. Bo
∃q = 1, 2, · · · , k
¡ ¢ ¡ ¢ fq e−1 (bj ) > fq e−1 (bi )
(7)
So the dominant antibodies are the nondominated individuals in population B. In this paper, we denote the set of dominant antibodies as D, and denote dominant antibodies as d with different suffixes. In order to explain the concepts of antibody, antibody population and dominant antibody, we give a simple example as follows. For the MOP in equation (5), if a vector x1 = (0.5, 0.2, 4, 5) belongs to the feasible region Ω, then x1 is a candidate solution of the MOP, the corresponding antibody is denoted by b1 = (0.5, 0.2, 4, 5). If b1 = (0.5, 0.2, 4, 5), b2 = (0.7, 0.6, 4, 7), and b3 = (0.2, 0.6, 6, 1) are three antibodies, then the set B = {b1 , b2 , b3 } is an antibody population with size 3. In the antibody population B = {b1 , b2 , b3 }, if both b2 and b3 do not dominate b1 , then b1 is a dominant antibody in the antibody population B. 2.3.3 Crowding-distance In our multiobjective algorithm, the dominant antibodies in D are ranked according to how much they contribute to the diversity of objective function values. This can be measured by the crowding-distance (Deb et al., 2002a). For the MOP in equation (5), the crowding-distance of a dominant antibody d ∈ D is given by 4
ζ(d, D) =
k X
ζi (d, D) max f − fimin i=1 i
(8)
where fimax and fimin are the maximum and minimum value of the i-th objective and ( © ª © ª 0 0 0 0 ∞, if fi (d) = min fi (d )|d ∈ D or fi (d) = max fi (d )|d ∈ D © ζi (d, D) = (9) 0 00 0 00 00 0 ª min fi (d ) − fi (d )|d , d ∈ D : fi (d ) < fi (d) < fi (d ) , otherwise Based on the crowding-distance ζ(d, D), we can estimate the density of dominant 0 0 antibodies surrounding d in the population D. If ζ(d, D) > ζ(d , D), d, d ∈ D, then d is a less-crowded individual, and d lies in a less-crowded region of the trade-off front, 0 in contrast to d .
3
Description of the Algorithm
In this section, we describe a novel multiobjective optimization algorithm, termed as Nondominated Neighbor Immune Algorithm (NNIA). NNIA stores nondominated individuals found so far in an external population, called Dominant Population. Only partial less-crowded nondominated individuals, called active antibodies are selected to do proportional cloning, recombination, and static hypermutation (Cutello et al., 2004). Furthermore, the population storing clones is called Clone Population. Dominant Population, Active Population, and Clone Population at time t are represented by time-dependent variable matrices Dt , At and Ct , respectively. The main loop of NNIA is as follows.
Algorithm1: Nondominated Neighbor Immune Algorithm Input: Gmax nD nA 6
(maximum number of generations) (maximum size of Dominant Population) (maximum size of Active Population) Evolutionary Computation
Volume x, Number x
Multiobjective Immune Algorithm with Nondominated Neighbor-based Selection
nC (size of Clone Population) Output: DGmax+1 (final approximate Pareto-optimal set)
Step1: Initialization: Generate an initial antibody population B0 with the size nD . Create the initial D0 = φ, A0 = φ, and C0 = φ. Set t = 0. Step2: Update Dominant Population: Identify dominant antibodies in Bt ; Copy all the dominant antibodies to form the temporary dominant population (denoted by DTt+1 ); If the size of DTt+1 is not greater than nD , let Dt+1 = DTt+1 . Otherwise, calculate the crowding-distance values of all individuals in DTt+1 , sort them in descending order of crowding-distance, choose the first nD individuals to form Dt+1 . Step3: Termination: If t ≥ Gmax is satisfied, export Dt+1 as the output of the algorithm, Stop; Otherwise, t = t + 1. Step4: Nondominated Neighbor − based Selection: If the size of Dt is not greater than nA , let At = Dt . Otherwise, calculate the crowding-distance values of all individuals in Dt , sort them in descending order of crowding-distance, choose the first nA individuals to form At . Step5: Proportional Cloning: Get the clone population Ct by applying the proportional cloning to At . Step6: Recombination and Hypermutation: Perform recombination and hypermutation on Ct and set C0t to the resulting population. Step7: Get the antibody population Bt by combining the C0t and Dt ; go to Step2. When the number of dominant antibodies is greater than the maximum limitation and the size of dominant population is greater than the maximum size of active population, both the reduction of dominant population and the selection of active antibodies use the crowding-distance based truncation selection. The proportional cloning, recombination and hypermutation operators are described as follows. 3.1 Proportional Cloning In immunology, Cloning means asexual propagation so that a group of identical cells can be descended from a single common ancestor, such as a bacterial colony whose members arise from a single original cell as the result of mitosis. Following the works summarized in Section 2.2, in this study, the proportional cloning TC on the active population A = {a1 , a2 , · · · , a|A| } is defined as TC (a1 + a2 + · · · + a|A| ) = TC (a1 ) + TC (a2 ) + · · · + TC (a|A| ) = {a11 + a21 + · · · + aq11 } + {a12 + a22 + · · · + aq22 } + q|A| · · · + {a1|A| + a2|A| + · · · + a|A| }
(10)
where TC (ai ) = {a1i + a2i + · · · + aqi i }, aji = ai , i = 1, 2, · · · , |A|, j = 1, 2, · · · , qi . qi is a self-adaptive parameter. The representation + is not the arithmetical operator, but only separates the antibodies here. qi = 1 denotes that there is no cloning on antibody ai . Evolutionary Computation
Volume x, Number x
7
M. Gong, L. Jiao, H. Du and L. Bo
a1 a1
...
a1
...
...
ai
...
aA
a i ...
ai
...
q1
qi
a A ...
aA
qA
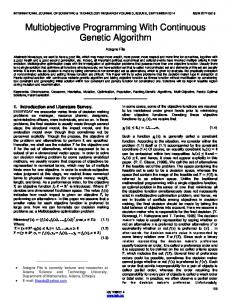
Figure 1: Illustration of the proportional cloning. In this study, the individual with greater crowding-distance value is reproduced more times, viz. the individual with greater crowding-distance value has a larger qi . Because the crowding-distance values of boundary solutions are positive infinity, before computing the value of qi for each active antibody, we set the crowding-distance values of the boundary individuals (in objective space) be equal to the double values of the maximum value of active antibodies except the boundary individuals. Then the values of qi are calculated as ' & ζ(ai , A) , (11) qi = nC × P|A| j=1 ζ(aj , A) where ζ(aj , A) denotes the crowding-distance value of the active antibodies aj , nC is an expectant value of the size of the clone population. For example, suppose that there are five antibodies in an active population for solving a bi-objective optimization problem and the corresponding values of objective functions are (1.0, 0), (0.9, 0.2), (0.6, 0.4), (0.2, 0.7), and (0, 1.0). Therefore, the crowding-distance values of the five individuals are 2.4, 2.4 0.8, 1.2, 1.2, and 2.4, respectively. If nC = 40, then q1 = d40 × 2.4+0.8+1.2+2.4 e = 12 and q2 = 4, q3 = 6, q4 = 6, q5 = 12. Note that, we use the ceil function here, therefore the P|A| clone population size j=1 qi is sometimes greater than the expectant value nC . However, the subsequent update of Dominant Population and nondominated neighborbased selection make sure the size of Dominant Population and Active Population not greater than nD and nA , respectively. Figure 1 illustrates the procedure of the proportional cloning. All the antibodies in sub-population {a1i , a2i , · · · , aqi i } are the result of the cloning on antibody ai , and have the same property as ai . In fact, cloning on antibody ai is to make multiple identical copies of ai . The aim is that the greater the crowding-distance value of an individual, the more times the individual will be reproduced. So there exist more chances to do search in less-crowded regions of the trade-off front. 3.2
Recombination and Hypermutation
If C = (c1 , c2 , c3 , · · · , c|C| ) is the resulting population from applying the proportional cloning to A = (a1 , a2 , a3 , · · · , a|A| ) , then the recombination TR on the clone population C is defined as TR (c1 + c2 + · · · + c|C| ) = TR (c1 ) + TR (c2 ) + · · · + TR (c|C| ) = crossover(c1 , A) + crossover(c2 , A) + · · · + crossover(c|C| , A) 8
Evolutionary Computation
(12)
Volume x, Number x
Multiobjective Immune Algorithm with Nondominated Neighbor-based Selection
where crossover(ci , A), i = 1, 2, · · · , |C|, denotes selecting equiprobably one individual from the two offspring generated by a general crossover operator on clone ci and an active antibody selected randomly from A. In this study, we use static hypermutation operator (Cutello et al., 2004) on the clone population after recombination. Cutello et al. (2004) designed three hypermutation methods, namely, static hypermutation (the number of mutations is independent from the fitness values), proportional hypermutation (the number of mutations is proportional to the fitness value), and inversely proportional hypermutation (the number of mutations is inversely proportional to the fitness value). We chose the static hypermutation in our algorithm due to the following reasons: (1) The hypermutation operator is implemented on the clone population after recombination. If we chose the proportional hypermutation or the inversely proportional hypermutation, we have to calculate the fitness values for all the individuals of the clone population. However, in other phases of NNIA, the dominated individuals are not assigned fitness. Therefore we have to define a fitness assignment strategy to dominated individuals only for the hypermuation operator unless we use a mutation operator independent from the fitness values. (2) In order to reduce complexity, the number of fitness evaluations is as low as possible. Suppose we define a fitness assignment strategy suitable for the proportional hypermutation or the inversely proportional hypermutation, we have to calculate the fitness values of all recombined clones before mutation. (3) The experimental study in (Cutello et al., 2004) showed that the inversely proportional hypermutation did only slightly better than static and proportional hypermutation in solving the Trap function problems. But if the combination of multiple operators was not considered, the static hypermutation achieved the best results among the three hypermutation operators in solving the protein structure prediction problems. Depending on the above reasons, we adopt the static hypermutation operator. If R = (r1 , r2 , r3 , · · · , r|R| ) is the clone population after recombination, then the static hypermutation operator TH on the population R is defined as TH (r1 + r2 + · · · + r|R| ) = TH (r1 ) + TH (r2 ) + · · · + TH (r|R| ) = mutate(r1 ) + mutate(r2 ) + · · · + mutate(r|R| )
(13)
where mutate(ri ), i = 1, 2, · · · , |R|, denotes changing each element of the variable vector ri by a general mutation operator with probability pm , so each individual in the clone population R at each time step will undergo about m × pm mutations, where m is the dimension of variable vector. 3.3
Fitness Assignment and Population Evolution
It can be seen that NNIA uses some well-known techniques such as storing the nondominated individuals previously found externally and reducing the number of nondominated individuals stored without destroying the characteristics of the trade-off front. Furthermore, NNIA adopts a novel selection technique. In NNIA, the dominant population is set as an external population for elitism. The fitness values of the individuals in the dominant population are assigned as the values of the crowding-distance, which serves as an estimate of the perimeter of the cuboid formed by the nearest neighbors as the vertices in objective space. The selection is therefore biased towards individuals with a high isolation value. Only partial nondominated individuals (much less than nondominated individuals found so far) with high crowding-distance values are Evolutionary Computation
Volume x, Number x
9
M. Gong, L. Jiao, H. Du and L. Bo
t = t +1 At
Cloning
,
Ct
Searching
Ct
Selection
Dt+1
Dt
Identifying dominant antibodies and Update dominant population
Figure 2: Population Evolution of NNIA.
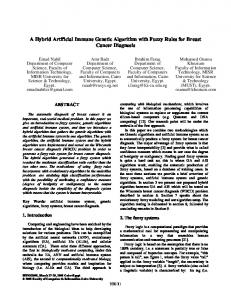
selected. And Cloning, recombination, and mutation only apply to the selected individuals (active antibodies). So in a single generation, only less-crowded individuals perform heuristic search in order to obtain more solutions in the less-crowded regions of the trade-off fronts. In contrast to NSGA-II, the nondominated neighbor-based selection and the proportional cloning makes the less-crowded individuals have more chances to do recombination and mutation. The population evolution in a single generation at time t is shown in Figure 2. 3.4
Computational Complexity
Analyzing NNIA’s computational complexity is revealing. In this section, we only consider population size in computational complexity. Assuming that the maximum size of dominant population is nD , the maximum size of active population is nA , the clone population size is nC , then the time complexity of one generation for the algorithm can be calculated as follows: for identifying nondominated individuals in the population ¡The time complexity ¢ is ¡O (nD + nC )2 ; the worst ¢ time complexity for updating the dominant population is O (nD + nC ) log(nD ¡+ nC ) ; the ¢ worst time complexity for nondominated neighborbased selection is O nD log(nD ) ; the time complexity for cloning is O(nC ) ; and the time complexity for recombination and mutation is O(nC ) . So the worst total time complexity is ¢ ¡ ¡ ¢ ¡ ¢ O (nD + nC )2 + O (nD + nC ) log(nD + nC ) + O nD log(nD ) + 2O(nC ).
(14)
According to the operational rules of the symbol O , the worst time complexity of one generation for NNIA can be simplified as ¢ ¡ O (nD + nC )2 .
(15)
So the cost of identifying the nondominated individuals in the population dominates the computational complexity of NNIA. We will do some empirical study on NNIA’s run-time complexity in Section 4.4. 10
Evolutionary Computation
Volume x, Number x
Multiobjective Immune Algorithm with Nondominated Neighbor-based Selection
4 Evaluation of NNIA’S Effectiveness In this section, we compare PESA-II (Corne et al., 2001), NSGA-II (Deb et al., 2002a), SPEA2 (Zitzler et al., 2002), and MISA (Coello Coello and Cortes, 2005) with NNIA in solving thirteen well-known multiobjective function optimization problems including three low-dimensional bi-objective problems, five ZDT problems (Zitzler et al., 2000) and five DTLZ problems (Deb et al., 2002b). The NNIA toolbox for Matlab 7.0 designed by the authors for solving the thirteen problems and twenty other problems is available at the first author’s homepage (http://see.xidian.edu.cn/iiip/mggong/Projects/NNIA.htm). All the simulations run at a personal computer with P-IV 3.2G CPU and 2G RAM. 4.1
Experimental Setup
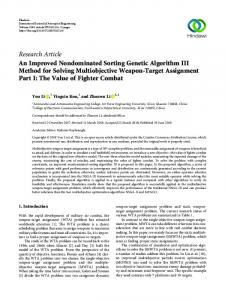
First, we describe the thirteen test problems used in this study. The first three low-dimensional bi-objective problems, named SCH, DEB and KUR, were defined by Schaffer (1984), Deb (1999) and Kursawe (1991), respectively. The next five ZDT problems were developed by Zitzler et al. (2000). The last five DTLZ problems were developed by Deb et al. (2002b). These MOPs have been cited in a number of significant past studies in this area. The first three MOPs are either simple or not scalable, where the number of decision variables is no more than 3. The five ZDT problems have 30 or 10 decision variables. All the above eight problems have two objectives. The five DTLZ problems can be scaled to any number of decision variables and objectives. Their Pareto-optimal fronts illustrated by a set of 200 uniform points on them are shown in Figure 3. Hereinto, the Pareto-optimal fronts of the five ZDT problems and the five DTLZ problems have been mathematically defined in (Zitzler et al., 2000; Deb et al., 2002b). The three low-dimensional problems, SCH, DEB and KUR do not have mathematical defined Pareto-optimal fronts. However, their approximate Pareto-optimal fronts have been illustrated in some literature (Deb, 1999; Van Veldhuizen, 1999; Deb, 2001). Here we derive their approximate Pareto-optimal fronts deterministically as follows,
Algorithm2: fronts
The deterministic algorithm of approximating Pareto-optimal
Step1: Generating finite discrete points uniformly distributed in the decision space. Step2: Calculate the objective function values of all the points. Step3: Select all the nondominated individuls from these points as the approximate Pareto-optimal set, and the corresponding image under the objective space constitute the approximate Paretooptimal front; Stop. In order to approximate the Pareto-optimal fronts with sufficient resolution, here we set the number of discrete points at 106 . The running time for getting the approximate Pareto-optimal fronts of SCH, DEB and KUR is about 18 hours by using a personal computer with P-IV 3.2G CPU and 2G RAM. More details of the test problems can be found in (Deb, 2001; Zitzler et al., 2000; Deb et al., 2002b). It is necessary to note that the performance of an MOEA in tackling multiobjective constrained optimization problems may be largely dependent on Evolutionary Computation
Volume x, Number x
11
M. Gong, L. Jiao, H. Du and L. Bo
20
2
1
0 15
-2 0.5
f2
f2
f2
-4 10
-6 0
-8
5
-10 0 -1
-0.5
0
0.5
1
-12 -20
-0.5
f1
1.5
f1
-17 f1
SCH
DEB
KUR
0
1
0.2
0.4
0.6
0.8
1
1
0.6
0.4
0.4
0.2
0.2
-16
-15
-14
0.5
0
f2
0.6
-18
1
f2
0.8
f2
0.8
-19
-0.5
0
0 0
0.2
0.4
0.6
0.8
1
-1 0
0.2
0.4
f1
0.6
0.8
1
0
0.2
0.4
f1
ZDT1 and ZDT4
0.6
0.8
1
f1
ZDT3
ZDT2 and ZDT6 6 1
0.5 f3
4 f3
0.5 0.4 0.3
2
f3
0 0
0
0.2 0
0.1 0 0
0.5
0.5 1
0.1
0.2
0.3
0.4
0.5
0.5
f1
f1
1
0.5 0
f2
f1
1
0
f2
DTLZ1
DTLZ2, DTLZ3 and DTLZ4
0.4
0.2
0.6
0.8
1
f2
DTLZ6
Figure 3: The Pareto-optimal fronts of the thirteen test problems illustrated by a set of 200 uniform points on them.
the constraint-handling technique used (Van Veldhuizen, 1999), so, we did not include side-constrained problems in this study. For the DTLZ problems, in Section 4.2, we set the values of k and |xk | be the values suggested by Deb et al. (2001, 2002b), i.e., k = 3 and |xk | = 5 for DTLZ1, k = 3 and |xk | = 10 for DTLZ2, DTLZ3 and DTLZ4, k = 3 and |xk | = 20 for DTLZ6. In Section 4.4, we will study the scalability of NNIA along the number of objectives based on two of the five DTLZ problems with k increasing from 2 to 9. Zitzler et al. (2003) suggested that for a k-objective optimization problem, at least k performances are needed to compare two or more solutions and an infinite number of metrics to compare two or more sets of solutions. Deb and Jain (2002) suggested a running performance metric for measuring the convergence to the reference set at each generation of an MOEA run. As the reference (Khare et al., 2003), in Section 4.2, we apply this metric only to the final Pareto-optimal set obtained by an MOEA to evaluate its performance. Zitzler et al. (2003) and Knowles et al. (2006) have suggested that the power of unary quality indicators was restricted. So we choose a binary quality metric, the Coverage of two sets (Zitzler and Thiele, 1998). We also adopt the Spacing 12
Evolutionary Computation
Volume x, Number x
Multiobjective Immune Algorithm with Nondominated Neighbor-based Selection
metric (Schott, 1995) to measure the diversity in the population. The three metrics are summarized as follows. Coverage of Two Sets: Let A, B be two approximate Pareto-optimal sets. The function IC maps the ordered pair (A, B) to the interval [0, 1]: 4
IC (A, B) =
|{b ∈ B; ∃a ∈ A : a º b}| |B|
(16)
where º means dominate or equal (also called weakly dominate). The value IC (A, B) = 1 means that all decision vectors in B are weakly dominated by A. IC (A, B) = 0 implies no decision vector in B is weakly dominated by A. Note that always both directions have to be considered because IC (A, B) is not necessarily equal to 1 − IC (B, A) . Convergence Metric: Let P∗ = (p1 , p2 , p3 , · · · , p|P∗ | ) be the reference or target set of points on the true Pareto-optimal front and A = (a1 , a2 , a3 , · · · , a|A| ) be the final approximate Pareto-optimal set obtained by an MOEA. Then for each point ai in A, the smallest normalized Euclidean distance to P∗ will be: v !2 u k à |P∗ | u X fm (ai ) − fm (pj ) t di = min . (17) max − f min j=1 fm m m=1 min max are the maximum and minimum values of the m-th objective funcand fm Here, fm ∗ tion in P . The convergence metric is the average value of the normalized distance for all points in A.
4
C(A) =
P|A| i=1
di
|A|
(18)
The convergence metric represents the distance between the set of approximate Pareto-optimal solutions and the true Pareto-optimal fronts. Hence lower values of the convergence metric represent good convergence ability. Similar metrics were proposed by Schott (1995), Rudolph (1998), Zitzler et al. (2000) and Van Veldhuizen and Lamont (2000) et al. Spacing: Let A be the final approximate Pareto-optimal set obtained by an MOEA. The function S v u |A| u 1 X 4 t S= (d¯ − di )2 (19) |A| − 1 i=1 where di = min j
k nX
o |fm (ai ) − fm (aj )|
ai , aj ∈ A i, j = 1, 2, · · · , |A|,
(20)
m=1
d¯ is the average value of all di , and k is the number of objective functions. A value of zero for this metric indicates all the nondominated solutions found are equidistantly spaced in objective space. Evolutionary Computation
Volume x, Number x
13
M. Gong, L. Jiao, H. Du and L. Bo
4.2
Comparison of NNIA with PESA-II, SPEA2, NSGA-II and MISA
In order to solve MOPs, many MOEAs have been proposed as mentioned in Section 1. Following Coello Coello’s recent review of evolutionary multiobjective optimization field (Coello Coello, 2005, 2006), NSGA-II, SPEA2, PESA-II, and some others can be considered as representative of the state-of-the-art in multiobjective optimization. In this section, NNIA was compared with PESA-II, NSGA-II, SPEA2 and MISA. NSGAII was proposed by Deb et al. (2002a) as an improvement of NSGA by using a more efficient nondominated sorting method, elitism and a crowded comparison operator without specifying any additional parameters for diversity maintaining. SPEA2 was proposed by Zitzler et al. (2002) as a revised version of SPEA by incorporating a revised fitness assignment strategy, a nearest neighbor density estimation technique and an enhanced archive truncation method. The revised fitness assignment strategy takes for each individual into account the number of individuals it dominates and it is dominated by. PESA-II was proposed by Corne et al. (2001) as a revised version of PESA by introducing a new selection technique, region-based selection. In region-based selection technique, selective fitness is assigned to the hyperboxes (Corne et al., 2001) in objective space instead of the Pareto-optimal individuals. Its update of auxiliary population (external population) also used the hyperboxes division. MISA (Coello Coello and Cortes, 2002, 2005) may be the first attempt to solve general multiobjective optimization problems using artificial immune systems. MISA encodes the decision variables of the problem to be solved by binary strings, clones the nondominated and feasible solutions, and applies two types of mutation to the clones and other individuals, respectively. MISA updates its external population by using the grid based techniques used in PAES (Knowles and Corne, 2000). Table 2: Tuned parameter values Parameter Crossover probability pc Distribution index for SBX Mutation probability pm Distribution index for polynomial mutation
PESA-II 0.8 15 1/n 20
SPEA2 0.8 15 1/n 20
NSGA-II 0.8 15 1/n 20
NNIA 1 15 1/n 20
We use the simulated binary crossover (SBX) operator and polynomial mutation (Deb and Beyer, 2001) for NNIA, PESA-II, NSGA-II and SPEA2. The SBX and polynomial mutation has been adopted in many MOEA papers (Zitzler et al., 2002; Deb et al., 2002a; Deb and Jain, 2002; Khare et al., 2003; Igel et al., 2007). Before the actual experimentation, some tuning of the parameters involved was required. Finding the values of parameters for which an MOEA works best is a difficult MOP in itself. We tuned the parameter values on DTLZ2 and DTLZ3 as (Khare et al., 2003) when obtained the best value of the Convergence metric described in Section 4.1. The tuned parameter values are listed in Table 2 where n is the number of variables. Because MISA is a binary-coded algorithm, the mutation is bit-flip with the probability described in (Coello Coello and Cortes, 2005). For SPEA2, we use a population of size 100 and an external population of size 100. For NSGA-II, the population size is 100. For PESA-II, the internal population size is 100, the archive size is 100, and the number of hyper-grid cells per dimension is 10. For NNIA, the maximum size of dominant population nD = 100 , the maximum size of active population nA = 20 , and the size of clone population nC = 100. For MISA, the population size is 100, the size of the external population is 100, the total 14
Evolutionary Computation
Volume x, Number x
Multiobjective Immune Algorithm with Nondominated Neighbor-based Selection
0.03
0.04
1
0.04
0.06
0.18 0.035
0.025
0.035 0.16
0.03 0.14
0.02
0.04
0.025
0.025
0.6
0.12 0.015
0.02
0.03
0.02
Sa ttsitciVau l esofCoverage
0.1 0.015
0.01
0.015
0.02
0.01
0.2
0.06
0.005
0.04 2 SCH
1 2 DEB 0.2
0.8 0.7
0.15
0.6 0.5
0.1
0.4 0.3
0.05
0.2 0.1
1
1
1 0.98
0.96
0.96
0.94
0.94
0.92
0.92
0.9
0.9
0.88
0.88
0.86
0.86
1
0.8
1
1
0.8
0.8
0.6
0.6
0.4
0.4
0.2
0.2
0.4
0.2
0.84
0 1 2 ZDT6
1 2 DTLZ1
1 2 ZDT3
0.6
0 2 ZDT4
0 1 2 ZDT2
1 2 ZDT1
2 KUR
0.98
0.84 0
0
0
0 1
0.01
0.005
0.005
0
Sa ttsitciVau l esofCoverage
0.4
0.08 0.01
1
0.05
0.8
0.03
1 2 DTLZ2
1 2 DTLZ3
0 1 2 DTLZ4
1 2 DTLZ6
Figure 4: Statistical Values of the Coverage of the two sets obtained by NNIA and PESA-II in solving the thirteen problems. Here, box plots are used to illustrate the distribution of these samples. In a notched box plot the notches represent a robust estimate of the uncertainty about the medians for box-to-box comparison. Symbol ’+’ denote for outliers. The thirteen plots denote the results of the thirteen problems respectively. In each plot, the left box represents the distribution of IC (I, P) and the right box represents the distribution of IC (P, I).
number of clones is 600, the number of grid subdivisions is 25, these four values are suggested by Coello Coello and Cortes (2005), and the coding length for each decision variable is 30. It is difficult to formulate the optimal and evidential stop criterion for an MOEA (Coello Coello, 2005). Researchers usually stop the algorithm when it reaches a given number of iterations or function evaluations. In this section the number of function evaluations is kept at 50 000 (not including the function evaluations during initialization) for all the five algorithms. In the following experiments, we performed 30 independent runs on each test problem. Figures 4 to 7 show the box plots (McGill et al., 1978) of NNIA against PESAII, NSGA-II, SPEA2 and MISA based on the Coverage of two sets. In the following, I denotes the solution set obtained by NNIA, P denotes the solution set obtained by PESA-II, S denotes the solution set obtained by SPEA2, N denotes the solution set obtained by NSGA-II, and M denotes the solution set obtained by MISA. The comparison between NNIA and PESA-II in the Coverage of two sets shows Evolutionary Computation
Volume x, Number x
15
M. Gong, L. Jiao, H. Du and L. Bo
x 10 0.04
0.02
-3
x 10
-3
10
10
8
8
6
6
0.025
4
4
0.015
2
2
0.04
0.2 0.035
0.035 0.18
0.03
0.015
0.025
Sa tsitcitVau l esofCoverage
0.14
0.02
0.01
0.005
0.015
0.12
0.01
0.1
0.005
0.08
0
0.06
0 1 2 SCH
0.03
0.16
1
0.01 0.005
0 1 2 KUR
1 2 DEB 0.14
0.02
1
0
0
1 2 ZDT1
1
1
1
2 ZDT2
1 2 ZDT3 1
0.3 0.12
0.98
0.25
Sa tsitcitVau l esofCoverage
0.2
0.8
0.96 0.94
0.9
0.06
0.4 0.5
0.02
0.9
0.4
0
0.88
0.04
0.05 0
0.85
1 2 ZDT4
0.6
0.6
0.92
0.1
0.7
0.6
0.7
0.08
0.15
0.8
0.8
0.95
0.1
0.9
0.9
1 2 DTLZ1
0.4
0.2
0.3 0.3
1 2 ZDT6
0.5
1 2 DTLZ2
0 1 2 DTLZ3
0.2 1 2 DTLZ4
1 2 DTLZ6
Figure 5: Box plots of the Coverage of the two sets obtained by NNIA and NSGA-II in solving the thirteen problems. The thirteen plots denote the results of the thirteen problems respectively. In each plot, the left box represents the distribution of IC (I, N) and the right box represents the distribution of IC (N, I).
that most of the values of IC (I, P) and IC (P, I) for the five DTLZ problems are greater than 0.5, therefore, the majority of the solutions obtained by PESA-II are weakly dominated by the solutions obtained by NNIA (Especially for DTLZ2, all the PESA-II’s solutions are weakly dominated by NNIA’s ones over 30 independent runs), while the majority of the solutions obtained by NNIA are also weakly dominated by the solutions obtained by PESA-II. The box plots of the other eight problems show that only minority solutions are weakly dominated by each other. As the analysis in (Zitzler et al., 2003), 0 < IC (A, B) < 1 and 0 < IC (B, A) < 1 shows neither A weakly dominates B nor B weakly dominates A, i.e. A and B are incomparable. But if only the values of Coverage be considered, the box plots of IC (I, P) are higher than the corresponding box plots of IC (P, I) in SCH, DEB, the five ZDT problems and the five DTLZ problems, while the box plot of IC (P, I) is higher than the corresponding box plot of IC (I, P)only in KUR. IC (I, P) denotes the ratio of the number of solutions obtained by PESA-II which are weakly dominated by the solutions obtained by NNIA to the total number of the solutions obtained by PESA-II in a single run. So in a sense (but neither ¤−compatible nor ¤−complete), NNIA did better than PESA-II in SCH, DEB, the five ZDT problems 16
Evolutionary Computation
Volume x, Number x
Multiobjective Immune Algorithm with Nondominated Neighbor-based Selection
0.04
x 10
0.5
0.04
-3
10
0.03
0.2 0.035
0.035
0.03
0.03
0.025
0.025
0.025
StatsitciValuesofCoverage
8
0.02
0.02
0.015
0.015
0.01
0.01
0.005
0.005
0
0
6 0.015
0 4
0.01
0.1
1 2 SCH
2
1 2 DEB
-0.5 1 2 KUR
1
1
0.08
1 2 ZDT1
0 1 2 ZDT2
1 2 ZDT3
1
1
1
0.8
0.8
0.9
0.6
0.6
0.98
0.8
0.8
0.96
0.06 0.6
0.94
0.6
0.8
0.92
0.04
0.4
0.005
0
0.05
1
Sa tsitcitVau l esofCoverage
0.02
0.15
0.4
0.9
0.4
0.4
0.2
0.2
0
0
0.7 0.2
0.02
0.2
0
0
0
0.88 0.86
1 2 ZDT4
1 2 ZDT6
0.6
0.84 1 2 DTLZ1
1 2 DTLZ2
1 2 DTLZ3
1 2 DTLZ4
1 2 DTLZ6
Figure 6: Box plots of the Coverage of the two sets obtained by NNIA and SPEA2 in solving the thirteen problems. The thirteen plots denote the results of the thirteen problems respectively. In each plot, the left box represents the distribution of IC (I, S) and the right box represents the distribution of IC (S, I).
and the five DTLZ problems while PESA-II did better than NNIA in KUR as far as the Coverage is concerned. The comparison between NNIA and NSGA-II and the comparison between NNIA and SPEA2 in terms of the Coverage are similar to the comparison between NNIA and PESA-II. But NNIA did better than NSGA-II in SCH, DEB, KUR, ZDT1, ZDT3, ZDT6 and the five DTLZ problems while NSGA-II did better than NNIA in ZDT2, ZDT4. Meanwhile, NNIA did better than SPEA2 in SCH, DEB, ZDT4, ZDT6 and the five DTLZ problems while SPEA2 did better than NNIA in KUR, ZDT2, and ZDT3 as far as the Coverage is concerned. The comparison between NNIA and MISA shows that for the five ZDT problems and the five DTLZ problems, the majority of the solutions obtained by MISA are weakly dominated by the solutions obtained by NNIA. But the majority of the solutions obtained by NNIA are weakly dominated by the solutions obtained by MISA only in DTLZ1, DTLZ2, and DTLZ3. We estimate that NNIA did better than MISA in all the problems as far as the Coverage is concerned because the box plots of IC (I, M) are higher than the corresponding box plots of IC (M, I) for all the test problems. The main Evolutionary Computation
Volume x, Number x
17
M. Gong, L. Jiao, H. Du and L. Bo
0.07
0.8
0.1
1
1
1
0.8
0.8
0.8
0.6
0.6
0.6
0.4
0.4
0.4
0.2
0.2
0.2
0.7
0.06
0.08
0.6
0.05
0.5
0.06
0.04
0.4 StastictiVau l esofCoverage
0.03
0.04
0.2
0.02
0.01
0.1
0
0 1 2 SCH
StastictiVau l esofCoverage
0.3
0.02
0
0 1 2 DEB
1
0
0
1 2 ZDT1
2 KUR
1 2 ZDT2
1 2 ZDT3
1
1
1
1
1
1
1
0.8
0.8
0.8
0.95
0.8
0.8
0.8
0.6
0.6
0.6
0.6
0.6
0.6
0.4
0.4
0.4
0.4
0.4
0.4
0.2
0.2
0.2
0.9 0.85 0.8
0.2
0.2
0.2
0.75 0 1 2 ZDT4
0
0
0 1 2 ZDT6
1 2 DTLZ1
1 2 DTLZ2
0 1 2 DTLZ3
0 1 2 DTLZ4
1 2 DTLZ6
Figure 7: Box plots of the Coverage of the two sets obtained by NNIA and MISA in solving the thirteen problems. The thirteen plots denote the results of the thirteen problems respectively. In each plot, the left box represents the distribution of IC (I, M) and the right box represents the distribution of IC (M, I).
limitation of MISA may be its binary representation. Since the test problems that we are dealing with have continuous spaces, real encoding should be preferred to avoid problems related to Hamming cliffs and to achieve arbitrary precision in the optimal solution (Khare et al., 2003). We think it is not appropriate to compare the performance of a binary-coded algorithm with respect to a real-coded algorithm, but MISA’s special operators (two types of mutation in Step 8 and Step 9 of MISA) were designed for antibodies represented by binary strings. However, in a sense, MISA has the ability to approximate these real-coded algorithms by using the binary representation with enough coding length. Figure 8 and Figure 9 illustrate the box plots based on the Convergence metric over 30 independent runs for the thirteen problems. In this section, for calculating the values of the Convergence metric, we use the set of 200 uniform points on the Pareto-optimal front as shown in Figure 3. Figure 8 and Figure 9 show that, for the three low-dimensional problems, all the five algorithm can obtain the values less than 10−2 in almost all the 30 independent runs. For the five ZDT problems, DTLZ2, DTLZ4 and DTLZ6, the differences between the corresponding values obtained by NNIA, PESA-II, NSGA-II and SPEA2 are small. 18
Evolutionary Computation
Volume x, Number x
Multiobjective Immune Algorithm with Nondominated Neighbor-based Selection
x 10 -3
x 10 -3 10
5 4.5
8
Convergence
4 3.5
6
3 4
2.5 2
2
1.5 NNIA
PESAII
NSGAII SCH
SPEA2
MISA
NNIA
PESAII
NSGAII DEB
SPEA2
MISA
NNIA
PESAII
NSGAII ZDT1
SPEA2
MISA
NNIA
PESAII
NSGAII ZDT3
SPEA2
MISA
0.025
Convergence
0.02
0.15
0.015 0.1 0.01 0.05 0.005 0
Convergence
NNIA
PESAII
NSGAII KUR
SPEA2
MISA
0.25
0.1
0.2
0.08
0.15
0.06
0.1
0.04
0.05
0.02
0
0 NNIA
PESAII
NSGAII ZDT2
SPEA2
MISA
Figure 8: Box plots of the Convergence metric obtained by NNIA, PESA-II, NSGA-II, SPEA2, and MISA in solving the SCH, DEB, KUR, ZDT1, ZDT2, and ZDT3.
Hereinto, NNIA did a little better than others in ZDT1, ZDT4, ZDT6, and DTLZ2. PESA-II did a little better than others in ZDT3 and DTLZ6. NNIA and PESA-II obtained similar values in ZDT2. NNIA, NSGA-II and SPEA2 obtained similar values in DTLZ4. For DTLZ1 and DTLZ3, NNIA did much better than the other four algorithms even though DTLZ1 and DTLZ3 have (11|xk |−1 ) and (3|xk |−1 ) local Pareto-optimal fronts, respectively. Deb et al. (2001) and Khare et al. (2003) claimed that for DTLZ3, both NSGA-II and SPEA2 could not quite converge on to the true Pareto-optimal fronts in 500 generations (50 000 function evaluations). We have found that PESA-II also did badly in solving DTLZ3, but NNIA did very well. Overall, as far as the Convergence metric is concerned, NNIA did best in DEB, ZDT1, ZDT4, ZDT6, DTLZ1, DTLZ2 and DTLZ3 (seven out of the thirteen problems). Figure 10 and Figure 11 illustrate the box plots based on the Spacing metric over 30 independent runs for the thirteen problems. Figure 10 and Figure 11 show that SPEA2 did best in nine problems in terms of the diversity metric Spacing. SPEA2 used an expensive archive truncation procedure whose worst run-time complexity is O(N 3 ) , where N is the number of nondominated individuals. PESA-II and MISA reduced their nondominated individuals using a hyper-grid based scheme, whose grid size was a crucial factor (Khare et al., 2003). NNIA reduced nondominated solutions using the crowded comparison proceEvolutionary Computation
Volume x, Number x
19
M. Gong, L. Jiao, H. Du and L. Bo
5 1 4
0.8
Convergence
3
0.6
2
0.4
1
0.2
0
0 NNIA
PESAII
NSGAII ZDT4
SPEA2
MISA
NNIA
PESAII
NSGAII ZDT6
SPEA2
MISA
NNIA
PESAII
NSGAII DTLZ2
SPEA2
MISA
140 0.11
120
0.1
80
0.09
60
0.08
Convergence
100
0.07
40
0.06
20
0.05
0 NNIA
PESAII
NSGAII DTLZ1
SPEA2
MISA
0.16 0.8
200 0.14
Convergence
150
0.6
0.12 0.1
100
0.4
0.08 50
0.2
0.06 0
0.04 NNIA
PESAII
NSGAII
DTLZ3
SPEA2
MISA
0 NNIA
PESAII
NSGAII
SPEA2
MISA
NNIA
PESAII
DTLZ4
NSGAII
SPEA2
MISA
DTLZ6
Figure 9: Box plots of the Convergence metric obtained by NNIA, PESA-II, NSGA-II, SPEA2, and MISA in solving the ZDT4, ZDT6, and DTLZ problems.
dure (Deb et al., 2002a), whose worst run-time complexity is only O(N log(N )) . Except SPEA2, the box plots of Spacing obtained by NNIA are lower than those obtained by NSGA-II, PESA-II and MISA in DEB, ZDT1, ZDT3, ZDT4, ZDT6, DTLZ1, DTLZ3 and DTLZ4 (eight out of the thirteen problems), while PESA-II did best (except SPEA2) in ZDT2, DTLZ2 and DTLZ6, NSGA-II did best (except SPEA2) in KUR, and MISA did best (except SPEA2) in SCH. For DTLZ1 and DTLZ3, NNIA did best in all the five algorithms because the other four algorithms could not quite converge on to the true Paretooptimal fronts. Overall, SPEA2 is the best algorithm in diversity maintenance, but the differences between the values of Spacing obtained by NNIA, PESA-II and NSGA-II are unconspicuous. Overall considering the experimental results, we can conclude that (1) For the three low-dimensional problems, all the five algorithms were capable to approximate the true Pareto-optimal fronts. (2) For DTLZ2, DTLZ4, DTLZ6 and the five ZDT problems, NNIA did best in four out of the eight problems in terms of the Convergence metric. SPEA2 did best in seven out of the eight problems in terms of diversity maintenance. Except SPEA2, NNIA did best in six out of the eight problems in terms of diversity maintenance. (3) For DTLZ1 and DTLZ3 problems, NSGA-II, SPEA2, PESA-II and MISA could not quite converge on to the true Pareto-optimal fronts in 50 000 function evaluations, 20
Evolutionary Computation
Volume x, Number x
Spacing
Multiobjective Immune Algorithm with Nondominated Neighbor-based Selection
x 10 -3
0.055 0.05 0.045 0.04 0.035 0.03 0.025 0.02 0.015
8 6 4 2 0 NNIA
PESAII
NSGAII SPEA2 SCH
MISA
Spacing
0.06
12 10 8 6
0.05
4
0.08 0.07
0.04
PESAII
NSGAII DEB
SPEA2
MISA
PESAII
NSGAII ZDT1
SPEA2
MISA
PESAII
NSGAII ZDT3
SPEA2
MISA
16 14
0.1 0.09
NNIA
PESAII
NSGAII KUR
SPEA2
MISA
x 10 -3
Spacing
NNIA x 10 -3
18 16 14 12 10 8 6 4 2
16 14 12 10 8 6 4 2 0 NNIA
2
PESAII
NSGAII ZDT2
SPEA2
MISA
NNIA x 10
-3
NNIA
Figure 10: Box plots of the Spacing metric obtained by NNIA, PESA-II, NSGA-II, SPEA2, and MISA in solving the SCH, DEB, KUR, ZDT1, ZDT2, and ZDT3.
but NNIA were capable to approximate the true Pareto-optimal fronts. In the experiments, NNIA and NSGA-II adopt the same heuristic search operators (simulated binary crossover and polynomial mutation) and archive maintenance method. NNIA is different from NSGA-II only in its individual selection and cloning before heuristic search. Therefore, the better performance of NNIA in contrast to NSGA-II is resulted from the unique nondominated neighbor-based selection method cooperating with the proportional cloning, which makes the less-crowded individuals have more chances to do heuristic search. NNIA is different from PESA-II, SPEA2 and MISA both in its way to do selection and archive maintenance. NNIA also outperformed PESA-II, SPEA2 and MISA in convergence for the majority of the test problems. Depending on these empirical comparisons, we conclude that the nondominated neighbor-based selection technique is effective, and NNIA is an effective algorithm for solving MOPs. 4.3
Comparison of NNIA with and without Recombination
Most of the existing immune inspired optimization algorithms, especially some pure clonal selection algorithms, did not use recombination. However, we think that recombination should not be forbidden in AIS community. Some immunologists have claimed that recombination is a mode of receptor editing used by the B cell antibodies Evolutionary Computation
Volume x, Number x
21
M. Gong, L. Jiao, H. Du and L. Bo
0.14 0.12
0.04
Spacing
0.1 0.08
0.03
0.06
0.02
0.04 0.01
0.02 0 NNIA
PESAII
NSGAII ZDT4
SPEA2
MISA
0
NNIA
PESAII
NSGAII ZDT6
SPEA2
MISA
NSGAII SPEA2 DTLZ2
MISA
15 0.1 10
Spacing
0.08 0.06
5 0.04 0.02
0 NNIA
PESAII
NSGAII DTLZ1
SPEA2
MISA
NNIA
PESAII 0.3
Spacing
70
0.07 0.25
60
0.06
50
0.05
0.2
40
0.04
0.15
30
0.03
20
0.02
10
0.01
0.1
0
0.05
0 NNIA
PESAII
NSGAII
SPEA2
DTLZ3
MISA
0 NNIA
PESAII
NSGAII
SPEA2
MISA
NNIA
PESAII
DTLZ4
NSGAII
SPEA2
MISA
DTLZ6
Figure 11: Box plots of the Spacing metric obtained by NNIA, PESA-II, NSGA-II, SPEA2, and MISA in solving the ZDT4, ZDT6, and DTLZ problems. to improve their affinity (George and Gray, 1999). de Castro and Von Zuben (2002) also claimed that genetic recombination and mutation are the two central processes involved in the production of antibodies, even though they did not use recombination in their pure clonal selection algorithm CLONALG according to the clonal selection theory (Burnet, 1959). In Section 4.2, the simulated binary crossover (SBX) was introduced as the recombination operator. SBX has been adopted in many MOEA papers (Zitzler et al., 2002; Deb et al., 2002a; Deb and Jain, 2002; Khare et al., 2003; Igel et al., 2007). In order to identify the improvement produced by SBX, we performed the proposed algorithm with SBX (denoted by NNIA) and without SBX (denoted by NNIA-X) 30 independent runs on each test problem, respectively. The parameter settings are the same as Section 4.2. Figure 12 illustrates the box plots based on the Coverage of the two sets obtained by NNIA and NNIA-X. Here, I denotes the solution set obtained by NNIA, and I−X denotes the solution set obtained by NNIA-X. The comparison between NNIA and NNIA-X in Coverage shows that For ZDT1, ZDT2, ZDT3, ZDT4, DTLZ1, DTLZ2, DTLZ3 and DTLZ4, the box plots of IC (I, I−X ) are obviously higher than the corresponding box plots of IC (I−X , I). Therefore, NNIA did much better than NNIA-X in solving these eight problems as far as the Coverage is concerned. 22
Evolutionary Computation
Volume x, Number x
Multiobjective Immune Algorithm with Nondominated Neighbor-based Selection
0.04
0.08
0.2
0.06
0.18
0.035 0.03
0.04
0.025
0.2
0.08
0.15
0.06
0.1
0.04
0.05
0.02
0.12 0.1
0.06
0.02 0.12
0.015 0 -0.02
0.005
0.08 0.06
-0.04 1
1 2 SCH
2
1
1
0.8
0.08
0.98 0.97
0.6
0.06 0.04
0.95
0.4
0.02 0 1 2 ZDT4
1
ZDT2
2
ZDT3
1
1
0.8
0.8
0.6
0.6
0.9
0.4
0.4
0.85
0.2
0.2
0.8
0
0
0.75
1
0.92 1 2 ZDT6
0.95
0.93
0.2 0
2
0.96
0.94
0.2
0 1
0.99
0.8
0.4
2
ZDT1
1
0.1
0.02
0
0 1 2 KUR
DEB
1
0.6
0.04
0.1
0.01
0
StasitcitVau l esofCoverage
0.1
0.08
0.14
0.02 Sa ttsitciVau l esofCoverage
0.16
0.25
1 2 DTLZ1
1 2 DTLZ2
1 2 DTLZ3
1 2 DTLZ4
1 2 DTLZ6
Figure 12: Box plots of the Coverage of the two sets obtained by NNIA with and without SBX, in solving the thirteen problems. The thirteen plots denote the results of the thirteen problems respectively. In each plot, the left box represents the distribution of IC (I, I−X ) and the right box represents the distribution of IC (I−X , I).
For SCH, ZDT6 and DTLZ6, the box plots of IC (I, I−X ) are slightly higher than the corresponding box plots of IC (I−X , I) . Therefore, NNIA did a little better than NNIA-X in solving these three problems. For DEB and KUR, the box plots of IC (I−X , I) are slightly higher than the corresponding box plots of IC (I, I−X ) . Therefore, NNIA-X did a little better than NNIA in solving these two problems. Overall, NNIA did better than NNIA-X in solving eleven out of the thirteen problems. NNIA-X only did a little better than NNIA in solving the two low-dimensional problems DEB and KUR. Based on the above empirical results, we did not abandon the recombination in our algorithm because our aim was to construct a useful algorithm for multiobjective optimization rather than a pure clonal selection algorithm. Furthermore, the recombination of genes involved in the production of antibodies differs somewhat from the recombination of parental genes in sexual reproduction used in genetic algorithms. In the former, the recombination on a clone is performed as a crossover between the clone and a randomly selected active antibody. It realized replacing at random some gene segments of the clone by the corresponding ones of the selected active antibody. The Evolutionary Computation
Volume x, Number x
23
M. Gong, L. Jiao, H. Du and L. Bo
ConvergenceMetricforDTLZ1
10
0
k=2
10
-2
10
-4
10
-6
10
0
100
200
300
2
k=2 10
SpacingforDTLZ1
10
k=5
400 500 600 Number of Generations k=3
k=7
700
k=5
800
k=9
900
k=7
1000
k=9
1
0
10
-1
10
-2
10
k=3
-3
0
100
200
300
400 500 600 Number of Generations
700
800
900
1000
Figure 13: Mean values of the normalized Convergence metric (the upper plot) and the Spacing (the nether plot) versus number of generations over 30 independent runs when NNIA solves DTLZ1 with various numbers of objectives. A logarithmic (base 10) scale is used for the Y-axis. latter involves the crossover of two parents to generate offspring. However, the similarity between them is also obviously, because the similarity between biological evolution and the production of antibodies is even more striking as claimed in (de Castro and Von Zuben, 2002). 4.4
Scalability of NNIA along the Number of Objectives
In this section, we will study the NNIA’s scalability in the Convergence metric, the Spacing, and running time with respect to the number of objectives. Among the thirteen test problems, only the five DTLZ problems are scalable to have any number of objectives. As suggested by Deb et al. (2002b), DTLZ1 can be used to investigate an MOEA’s ability to scale up its performance in a large number of objectives, and DTLZ3 can be used to investigate an MOEA’s ability to converge to the true Pareto-optimal front. Here, DTLZ1 and DTLZ3 with 2 to 9 objectives are used for the empirical study. In order to investigate the change of these metrics along the number of generations, we set the number of generations as a considerable large value 1000. Some references have implied that MOEAs with small population size have difficulties in converging to the Pareto-optimal front with well-distributed solutions for complicated problems, especially for the MOPs with more than 3 objectives (Khare et al., 2003; Tan et al., 2001; 24
Evolutionary Computation
Volume x, Number x
Multiobjective Immune Algorithm with Nondominated Neighbor-based Selection
10
ConvergenceMetricforDTLZ3
10
10
10
0
k=2
k=5
k=7
k=9
-2
-4
-6
0
100
200
300 k=2
10
SpacingforDTLZ3
k=3
10
10
400 500 600 Number of Generations k=3
700
k=5
800
900
k=7
1000 k=9
2
0
-2
0
100
200
300
400 500 600 Number of Generations
700
800
900
1000
Figure 14: Mean values of the normalized Convergence metric (the upper plot) and the Spacing (the nether plot) versus number of generations over 30 independent runs when NNIA solves DTLZ3 with various numbers of objectives. A logarithmic (base 10) scale is used for the Y-axis.
Deb, 2001). In order to bate the influence of population size, here we double the values of population size, namely, the maximum size of dominant population nD = 200, the maximum size of active population nA = 50, and the size of clone population nC = 200. Other parameters are the same as Section 4.2. The number of points on true Paretooptimal front for calculating the values of the convergence metric is 200 when k=2 and 3, 500 when k=5, and 1000 when k=7 and 9. Figure 13 and Figure 14 show the mean values of the normalized Convergence metric (Deb and Jain, 2002) and Spacing over 30 independent runs in 1 to 1000 generations when NNIA solves DTLZ1 and DTLZ3 with 2, 3, 5, 7 and 9 objectives, respectively. For DTLZ1, when k=2, 3, 5, NNIA obtains the approximate minimum values of the Convergence metric and Spacing in no more than 150 generations. When k=7 and 9, NNIA needs to iterate about 350 generations to obtain the approximate minimum values of the Convergence metric and the Spacing. For DTLZ3, when k=2, 3, 5 and 7, NNIA obtains the approximate minimum values of convergence metric and Spacing in no more than 300 generations. When k=9, NNIA does not get acceptable values of convergence metric and Spacing with the population size used here because DTLZ3 introduce more difficulties to an MOEA in converging to Pareto-optimal front and in finding a diverse set of solutions (Khare et al., 2003). Evolutionary Computation
Volume x, Number x
25
M. Gong, L. Jiao, H. Du and L. Bo
70
70 total NNS search IDA UDP
60 50
50 40 RunningTime(sec)forDTLZ3
RunningTime(sec)forDTLZ1
40 30 20 10 0 2
4 6 Number of Objectives
total NNS search IDA UDP
60
8
10
30 20 10 0 2
4 6 Number of Objectives
8
10
Figure 15: Mean values of each operator’s running time and the total running time versus number of objectives when NNIA solves DTLZ1 and DTLZ3 with various numbers of objectives. Figure 15 shows the running time of NNIA in solving DTLZ1 and DTLZ3 using the parameters mentioned above. All the values of time are recorded using Matlab 7.0 program running at a personal computer with P-IV 3.2G CPU and 2G RAM. The running time of the operators including nondominated neighbor-based selection (NNS), cloning, recombination and mutation (search), update dominant population (UDP) and identifying dominant antibodies (IDA), are given too. It can be seen that, the cost of identifying the nondominated individuals in the population dominates the run-time complexity of NNIA. It is obvious that the complexity of NNIA along the number of objectives is approximately linear when the number of generations is the same.
5 Concluding Remarks We have proposed a novel multiobjective algorithm based on a nondominated neighbor-based selection technique, an immune inspired operator, two heuristic search operators, and elitism. In NNIA, the fitness value of nondominated individuals is assigned as the crowding-distance. The selection technique only performs on nondominated individuals and selects minority isolated individuals to clone proportionally to crowding-distance values, recombine and mutate. Some immunologists claimed that repertoire diversity of antibody underlies the immune response however the majority of antibodies do not play any active role during the immune response (Pannetier et al., 1995; Cziko, 1995; Baranzini et al., 1999; Parkin and Cohen, 2001). NNIA simulated this mechanism by selecting only the minority of nondominated individuals with greater crowding-distance values as active antibodies, and performing the proportional cloning, recombination, and hypermutation only on these active antibodies. It realized the enhanced local search around the active antibodies which are the less-crowded individuals in objective space. NSGA-II, SPEA2, PESA-II and some other MOEAs can be considered as different MOEAs because they adopt different ways to do selection and population maintenance. In contrast to NSGA-II, the nondominated neighbor-based selection and proportional cloning make the less-crowded individuals have more chances to do recombination and mutation. So in a single generation, NNIA pays more attention to the less-crowded regions of the current trade-off front. The essential difference between NNIA and MISA 26
Evolutionary Computation
Volume x, Number x
Multiobjective Immune Algorithm with Nondominated Neighbor-based Selection
is in their different selection methods and population maintenance strategies as well as individual representation methods. MISA adopts binary representation, clones all the nondominated individuals (and feasible individuals for constraint problems), and applies two types of mutation to the clones and other ’not so good’ individuals, respectively. MISA updates its external population by using the grid based techniques used in PAES which need a crucial parameter, the number of grid cells. The difference between NNIA and VAIS also lies in their selection and population maintenance strategies. VAIS adopts the flowchart of opt-aiNet and the fitness assignment method in SPEA2 with some simplification. VAIS maintains its external population (memory population) using the suppression mechanism like opt-aiNet based on the Euclidean distance in objective space and a threshold for suppression. We can also find some similar points between NNIA and PESA-II, PAES, SPEA2, e.g. storing the nondominated individuals previously found externally and reducing the number of nondominated individuals stored without destroying the characteristics of the trade-off front, because our algorithm is constructed inspired from them. Most of the immune system inspired optimization algorithms essentially evolve solutions to problems via repeated application of a cloning, mutation and selection cycle to a population of candidate solutions and remaining good solutions in the population. Just as Hart and Timmis (2005) said, anyone familiar with the EA literature will recognize all of these features as equally applicable to an EA. It may be due to the striking similarity between the functioning of immune system and the adaptive biological evolution. In particular, the central processes involved in the production of antibodies, genetic recombination and mutation, are the same ones responsible for the biological evolution of species (de Castro and Von Zuben, 2002). The main contribution of this study to MO field may be its unique selection technique. The selection technique only selects minority isolated nondominated individuals based on their crowding-distance values. The selected individuals are then cloned proportionally to their crowding-distance values before heuristic search. By using the nondominated neighbor-based selection and proportional cloning, the new algorithm realizes the enhanced local search in the less-crowded regions of the current trade-off front. Depending on the enhanced local search, NNIA can solve MOPs with a simple procedure. The experimental study on NNIA, SPEA2, NSGA-II, PESA-II and MSIA in solving three low-dimensional problems, five ZDT problems and five DTLZ problems has shown that NNIA was able to quite converge to the true Pareto-optimal fronts in solving most of the test problems. More important, for the complicated problems DTLZ1 and DTLZ3, NNIA did much better than the other four algorithms. Depending on these empirical comparisons, we concluded that the nondominated neighbor-based selection method is effective, and NNIA is an effective algorithm for solving multiobjective optimization problems. An issue should be addressed in the future research is the population size selfadaptive dynamic strategy. Some references have implied that MOEAs with small population size have difficulties in converging to the true Pareto-optimal front and obtaining the well-distributed solutions for some complicated problems (Deb, 2001; Tan et al., 2001; Khare et al., 2003). The dependence between the problem complexity and the population size of NNIA should be solved correctly. However, to estimate the correct population size for a given problem can not be done a priori as the complexity of the problem generally can not be inferred ahead of time. The population size selfadaptive dynamic strategy using the rate of nondominated individuals or the relation between dominated and nondominated individuals may be an interesting direction of Evolutionary Computation
Volume x, Number x
27
M. Gong, L. Jiao, H. Du and L. Bo
the future research. The formulation of an efficient stopping criterion for MOEAs has been claimed as one of the fundamental topics that must be properly addressed in MOEA area (Rudenko and Schoenauer, 2004; Coello Coello, 2005). However, it is difficult to formulate the optimal and evidential stop criterion as judging the advance of the optimization can become as complex as the MOP itself. Furthermore, single-objective EAs can stop when the fitness does not improve during a given number of generations, but such stopping criterion does not easily extend to the multiobjective framework. Therefore, researchers usually stop the algorithm when the algorithm reaches a given number of iterations or function evaluations as used in this study. A more appropriate stopping criterion should be addressed in the future research. Applying an effective constraint-handling technique to the proposed algorithm for solving constrained MOPs is also our future work. Most of the existing artificial immune system algorithms for multiobjective optimization are inspired from the clonal selction principle. Some immunological theories are not well explored in the field of multiobjective optimization, such as Negative Selection (Zhou and Dasgupta, 2007) and Danger Theory (Aickelin and Cayzer, 2002). An investigation of their potential for multiobjective optimization may be another direction of the future research.
Acknowledgments This work was supported by the National Natural Science Foundation of China (Grant No. 60703107), the National High Technology Research and Development Program (863 Program) of China (Grant No. 2006AA01Z107), the National Basic Research Program (973 Program) of China (Grant No. 2006CB705700) and the Graduate Innovation Fund of Xidian University (Grant No. 05004). The authors wish to thank the anonymous reviewers for their valuable comments and helpful suggestions which greatly improved the paper’s quality. The authors also wish to thank Prof. Coello Coello for his maintenance of the EMO repository.
References Aickelin, U. and Cayzer, S. (2002). The danger theory and its application to artificial immune systems. In proceeding of the first International Conference on Artificial Immune Systems, pages 141–148, University of Kent at Canterbury, England. Baranzini, S. E., Jeong, M. C., Butunoi, C., Murray, R. S., Bernard, C. C. A., and Oksenberg, J. R. (1999). B cell repertoire diversity and clonal expansion in multiple sclerosis brain lesions. The Journal of Immunology, 163:5133–5144. Burnet, F. M. (1959). The Clonal Selection Theory of Acquired Immunity. Cambridge University Press. Coello Coello, C. A. (2003). Evolutionary multiobjective optimization: Current and future challenges. In Advances in Soft Computing-Engineering, Design and Manufacturing, pages 243–256. Springer-Verlag. Coello Coello, C. A. (2005). Recent trends in evolutionary multiobjective optimization. In Abraham, A., Jain, L., and Goldberg, R., editors, Evolutionary Multiobjective Optimization: Theoretical Advances and Applications, pages 7–32. Springer-Verlag. Coello Coello, C. A. (2006). Evolutionary multiobjective optimization: A historical view of the field. IEEE Computational Intelligence Magazine, 1(1):28–36.
28
Evolutionary Computation
Volume x, Number x
Multiobjective Immune Algorithm with Nondominated Neighbor-based Selection
Coello Coello, C. A. and Cortes, N. C. (2002). An approach to solve multiobjective optimization problems based on an artificial immune system. In Proceedings of the First International Conference on Artificial Immune Systems, pages 212–221, University of Kent at Canterbury, UK. Coello Coello, C. A. and Cortes, N. C. (2005). Solving multiobjective optimization problems using an artificial immune system. Genetic Programming and Evolvable Machines, 6:163–190. Coello Coello, C. A. and Pulido, G. T. (2001). Multiobjective optimization using a micro-genetic algorithm. In Proceedings of the Genetic and Evolutionary Computation Conference (GECCO-2001), pages 274–282, San Francisco, California. Morgan Kaufmann Publishers. Coello Coello, C. A., Van Veldhuizen, D., and Lamont, G. B. (2002). Evolutionary algorithms for solving Multi-objective Problems. Kluwer Academic Publishers, New York, USA. Corne, D. W., Jerram, N. R., Knowles, J. D., and Oates, M. J. (2001). PESA-II: Region-based selection in evolutionary multiobjective optimization. In Proceedings of the Genetic and Evolutionary Computation Conference (GECCO-2001), pages 283–290, San Francisco, California. Morgan Kaufmann Publishers. Corne, D. W., Knowles, J. D., and Oates, M. J. (2000). The pareto-envelope based selection algorithm for multiobjective optimization. In Parallel Problem Solving from Nature-PPSN VI, volume 1917 of Lecture Notes in Computer Science, pages 839–848. Cutello, V., Narzisi, G., and Nicosia, G. (2005a). A class of pareto archived evolution strategy algorithms using immune inspired operators for ab-initio protein structure prediction. In Third European Workshop on Evolutionary Computation and Bioinformatics, EvoWorkshops 2005-EvoBio 2005, volume 3449 of Lecture Notes in Computer Science, pages 54–63, Lausanne, Switzerland. Cutello, V., Narzisi, G., Nicosia, G., and Pavone, M. (2005b). Clonal selection algorithms: A comparative case study using effective mutation potentials. In Proceedings of 4th International Conference on Artificial Immune Systems, ICARIS 2005, volume 3627 of Lecture Notes in Computer Science, pages 13–28, Banff, Canada. Cutello, V., Nicosia, G., and Pavone, M. (2004). Exploring the capability of immune algorithms: A characterization of hypemutation operators. In Proceedings of Third International Conference on Artificial Immune Systems, ICARIS 2004, volume 3239 of Lecture Notes in Computer Science, pages 263–276, Catania, Italy. Cziko, G. (1995). Cambridge, chapter The immune system: Selection by the enemy, pages 39–48. MIT Press. de Castro, L. N. and Timmis, J. (2002). An artificial immune network for multimodal function optimization. In Proceedings of the 2002 Congress on Evolutionary Computation, CEC2002, pages 699–704. IEEE Service Center. de Castro, L. N. and Von Zuben, F. J. (2002). Learning and optimization using the clonal selection principle. IEEE Transactions on Evolutionary Computation, 6(3):239–251. Deb, K. (1999). Multi-objective genetic algorithms: Problem difficulties and construction of test problems. Evolutionary Computation, 7(3):205–230. Deb, K. (2001). Multi-objective optimization using Evolutionary algorithms. John Wiley & Sons, Chichester, UK. Deb, K. and Beyer, H. G. (2001). Self-adaptive genetic algorithms with simulated binary crossover. Evolutionary Computation, 9(2):197–221. Deb, K. and Jain, S. (2002). Running performance metrics for evolutinary multiobjective optimization. Technical Report 2002004, KanGAL, Indian Institute of Technology, Kanpur 208016, India. Deb, K., Pratap, A., Agarwal, S., and Meyarivan, T. (2002a). A fast and elitist multiobjective genetic algorithm: NSGA-II. IEEE Transactions on Evolutionary Computation, 6(2):182–197. Evolutionary Computation
Volume x, Number x
29
M. Gong, L. Jiao, H. Du and L. Bo
Deb, K., Thiele, L., Laumanns, M., and Zitzler, E. (2001). Scalable multi-objective optimization test problems. Technical Report 112, Computer Engineering and Networks Laboratory (TIK), Swiss Federal Institute of Technology (ETH), Zurich, Switzerland. Deb, K., Thiele, L., Laumanns, M., and Zitzler, E. (2002b). Scalable multi-objective optimization test problems. In Proceedings of Congress on Evolutionary Computation, CEC2002, pages 825–830. IEEE Service Center. Fonseca, C. M. and Fleming, P. J. (1995). An overview of evolutionary algorithms in multiobjective optimization. Evolutionary Computation, 1(1):1–16. Freschi, F. and Repetto, M. (2005). Multiobjective optimization by a modified artificial immune system algorithm. In Proceedings of the 4th International Conference on artificial immune systems, ICARIS 2005, volume 3627 of Lecture Notes in Computer Science, pages 248–261. Fukuda, T., Mori, K., and Tsukiyama, M. (1993). Immune networks using genetic algorithm for adaptive production scheduling. In 15th IFAC World Congress, volume 3, pages 57–60. Garrett, S. M. (2004). Parameter-free, adaptive clonal selection. In Proceedings of IEEE Congress on Evolutionary Computing, CEC 2004, pages 1052–1058, Portland, Oregon. Garrett, S. M. (2005). How do we evaluate artificial immune systems. Evolutionary Computation, 13(2):145–178. George, A. J. T. and Gray, D. (1999). Receptor editing during affinity maturation. Immunology Today, 20(4):196. Hart, E. and Timmis, J. (2005). Application areas of ais: The past, the present and the future. In Proceedings of the 4th International Conference on artificial immune systems, ICARIS 2005, volume 3627 of Lecture Notes in Computer Science, pages 483–497. Horn, J. and Nafpliotis, N. (1993). Multiobjective optimization using the niched pareto genetic algorithm. IlliGAL Report 93005, Illinois Genetic Algorithms Laboratory, University of Illinois, Urbana, Champaign. Igel, C., Hansen, N., and Roth, S. (2007). Covariance matrix adaptation for multi-objective optimization. Evolutionary Computation, 15(1):1–28. Jacob, C., Pilat, M. L., Bentley, P. J., and Timmis, J., editors (2005). Artificial Immune Systems: Proceedings of The Fourth International Conference on Artificial Immune Systems, ICARIS 2005, volume 3627 of Lecture Notes in Computer Science. Springer-Verlag. Jiao, L. C., Gong, M. G., Shang, R. H., Du, H. F., and Lu, B. (2005). Clonal selection with immune dominance and anergy based multiobjective optimization. In Proceedings of the Third International Conference on Evolutionary Multi-Criterion Optimization, EMO 2005, volume 3410 of Lecture Notes in Computer Science, pages 474–489, Guanajuato, Mexico. Khare, V., Yao, X., and Deb, K. (2003). Performance scaling of multi-objective evolutionary algorithms. In Proceedings of the Second International Conference on Evolutionary Multi-Criterion Optimization, EMO 2003, volume 2632 of Lecture Notes in Computer Science, pages 376–390. Knowles, J., Thiele, L., and Zitzler, E. (2006). A tutorial on the performance assessment of stochastic multiobjective optimizers. Technical Report 214, Computer Engineering and Networks Laboratory (TIK), Swiss Federal Institute of Technology (ETH), Zurich, Switzerland. Knowles, J. D. and Corne, D. W. (2000). Approximating the nondominated front using the pareto archived evolution strategy. Evolutionary Computation, 8(2):149–172. Kursawe, F. (1991). A variant of evolution strategies for vector optimization. In Parallel Problem Solving from Nature-PPSN I, volume 496 of Lecture Notes in Computer Science, pages 193–197. McGill, R., Tukey, J., and Larsen, W. (1978). Variations of boxplots. The American Statistician, 32:12–16.
30
Evolutionary Computation
Volume x, Number x
Multiobjective Immune Algorithm with Nondominated Neighbor-based Selection
Nicosia, G., Cutello, V., Bentley, P. J., and Timmis, J., editors (2004). Artificial Immune Systems, Proceedings of The Third International Conference on Artificial Immune Systems, ICARIS 2004, volume 3239 of Lecture Notes in Computer Science. Springer-Verlag. Pannetier, C., Even, J., and Kourilsky, P. (1995). T-cell repertoire diversity and clonal expansions in normal and clinical samples. Immunology Today, 16(4):176–81. Parkin, J. and Cohen, B. (2001). An overview of the immune system. The Lancet, 357(9270):1777– 1789. Rudenko, O. and Schoenauer, M. (2004). A steady performance stopping criterion for paretobased evolutionary algorithms. In Proceedings of the 6th International Multi-Objective Programming and Goal Programming Conference, Hammamet, Tunisia. Rudolph, G. (1998). On a multi-objective evolutionary algorithm and its convergence to the pareto set. In Proceedings of the 5th IEEE Congress on Evolutionary Computation, CEC 1998, pages 511–516. IEEE Service Center. Schaffer, J. D. (1984). Multiple objective optimization with vector evaluated genetic algorithms. PhD thesis, Vanderbilt University. Schott, J. R. (1995). Fault tolerant design using single and multictiteria gentetic algorithm optimization. Master thesis, Massachusetts Institute of Technology. Srinivas, N. and Deb, K. (1993). Multiobjective optimization using nondominated sorting in genetic algorithms. Evolutionary Computation, 2(3):221–248. Tan, K. C., Lee, T. H., and Khor, E. F. (2001). Evolutionary algorithms with dynamic population size and local exploration for multiobjective optimization. IEEE Transactions on Evolutionary Computation, 5(6):565–588. Tarakanov, A. and Dasgupta, D. (2000). A formal model of an artificial immune system. BioSystems, 55(1/3):151–158. Van Veldhuizen, D. A. (1999). Multiobjective Evolutionary Algorithms: Classification, Analyses, and New Innovations. PhD thesis, Air Force Institute of Technology, Air University. Van Veldhuizen, D. A. and Lamont, G. B. (2000). On measuring multiobjective evolutionary algorithm performance. In Proceedings of the 2000 IEEE Congress on Evolutionary Computation, CEC 2000, pages 204–211. IEEE Service Center. Zhou, J. and Dasgupta, D. (2007). Revisiting negative selection algorithms. Evolutionary Computation, 15(2):223–251. Zitzler, E., Deb, K., and Thiele, L. (2000). Comparison of multiobjective evolutionary algorithms: Empirical results. Evolutionary Computation, 8(2):173–195. Zitzler, E., Laumanns, M., and Thiele, L. (2002). SPEA2: Improving the strength pareto evolutionary algorithm. In Evolutionary Methods for Design, Optimization and Control with Applications to Industrial Problems, pages 95–100, Athens, Greece. Zitzler, E. and Thiele, L. (1998). Multiobjective optimization using evolutionary algorithms - A comparative case study. In Parallel Problem Solving from Nature-PPSN V, volume 1498 of Lecture Notes in Computer Science, pages 292–301. Zitzler, E. and Thiele, L. (1999). Multiobjective evolutionary algorithms: A comparative case study and the strength pareto approach. IEEE Transactions on Evolutionary Computation, 3(4):257–271. Zitzler, E., Thiele, L., Laumanns, M., Fonseca, C. M., and da Fonseca, V. G. (2003). Performance assessment of multiobjective optimizersan analysis and review. IEEE Transactions on Evolutionary Computation, 7(2):117–132. Evolutionary Computation Volume x, Number x
31