IEEE TRANSACTIONS ON GEOSCIENCE AND REMOTE SENSING, VOL. 53, NO. 3, MARCH .... a detailed overview of machine learning in remote sensing ...... Geoscience and Remote Sensing Society (GRSS) as the Best Reviewer of IEEE.
1592
IEEE TRANSACTIONS ON GEOSCIENCE AND REMOTE SENSING, VOL. 53, NO. 3, MARCH 2015
Multiple Feature Learning for Hyperspectral Image Classification Jun Li, Xin Huang, Senior Member, IEEE, Paolo Gamba, Fellow, IEEE, José M. Bioucas-Dias, Member, IEEE, Liangpei Zhang, Senior Member, IEEE, Jón Atli Benediktsson, Fellow, IEEE, and Antonio Plaza, Senior Member, IEEE
Abstract—Hyperspectral image classification has been an active topic of research in recent years. In the past, many different types of features have been extracted (using both linear and nonlinear strategies) for classification problems. On the one hand, some approaches have exploited the original spectral information or other features linearly derived from such information in order to have classes which are linearly separable. On the other hand, other techniques have exploited features obtained through nonlinear transformations intended to reduce data dimensionality, to better model the inherent nonlinearity of the original data (e.g., kernels) or to adequately exploit the spatial information contained in the scene (e.g., using morphological analysis). Special attention has been given to techniques able to exploit a single kind of features, such as composite kernel learning or multiple kernel learning, developed in order to deal with multiple kernels. However, few approaches have been designed to integrate multiple types of features extracted from both linear and nonlinear transformations. In this paper, we develop a new framework for the classification of hyperspectral scenes that pursues the combination of multiple features. The ultimate goal of the proposed framework is to be able to cope with linear and nonlinear class boundaries present in the data, thus following the two main mixing models considered for hyperspectral data interpretation. An important characteristic of the presented approach is that it does not require any regularization parameters to control the weights of considered features so that different types of features can be efficiently exploited and integrated in a collaborative and flexible way. Our experimental results, conducted using a variety of input features and hyperspectral scenes, indicate that the proposed framework for multiple feature learning provides state-of-the-art classification results without significantly increasing computational complexity. Index Terms—Hyperspectral imaging, linear and nonlinear features, multiple feature learning.
Manuscript received March 19, 2014; revised July 18, 2014; accepted July 22, 2014. J. Li is with the School of Geography and Planning and Guangdong Key Laboratory for Urbanization and Geo-Simulation, Sun Yat-sen University, Guangzhou 510275, China. X. Huang and L. Zhang are with the State Key Laboratory of Information Engineering in Surveying, Mapping, and Remote Sensing, Wuhan University, Wuhan 430072, China. P. Gamba is with the Telecommunications and Remote Sensing Laboratory, University of Pavia, 27100 Pavia, Italy. J. M. Bioucas-Dias is with the Instituto de Telecomunicações, Instituto Superior Técnico, Universidade de Lisboa, 1049-001 Lisboa, Portugal. J. A. Benediktsson is with the Faculty of Electrical and Computer Engineering, University of Iceland, 101 Reykjavik, Iceland. A. Plaza is with the Hyperspectral Computing Laboratory, Department of Technology of Computers and Communications, Escuela Politécnica, University of Extremadura, 10003 Cáceres, Spain. Color versions of one or more of the figures in this paper are available online at http://ieeexplore.ieee.org. Digital Object Identifier 10.1109/TGRS.2014.2345739
I. I NTRODUCTION
T
HE recent availability of remotely sensed hyperspectral images has fostered the development of techniques able to interpret such high-dimensional data in many different application contexts [1]. It is now commonly accepted that using the spatial and the spectral information simultaneously provides significant advantages in terms of improving the performance of classification techniques. A detailed overview of recent advances in the spatial–spectral classification of hyperspectral data is available in [2]. Resulting from the need to model both the spectral and the spatial information contained in the original data, different types of features have been exploited for spectral–spatial classification. These features can be mainly classified into two categories. 1) On the one hand, several methods exploit the original spectral information or other features linearly derived from such information. These kind of features have been widely used to exploit the linear separability of certain classes [3]. Techniques commonly used for this purpose include the maximum noise fraction [4], independent component analysis [5], linear spectral unmixing [6], or projection pursuit [7], among many others [8]. 2) On the other hand, in real analysis scenarios, it is likely to find cases in which nonlinear features are more effective for class discrimination due to the existence of nonlinear class boundaries. As a result, several techniques have focused on exploiting features obtained through nonlinear transformations to better model the inherent nonlinearity of the original data. Examples include kernel methods [9], [10] and manifold regularization [11], [12]. Other nonlinear approaches are focused on adequately exploiting the spatial information contained in the scene, e.g., using morphological analysis [13], [14]. Once relevant features have been extracted from the original data, the classification process itself can also be either linear or nonlinear. For instance, in linear discriminant analysis [15], a linear function is used in order to maximize the discriminatory power and separate the available classes effectively. However, such a linear function may not be the best choice, and nonlinear strategies such as quadratic discriminant analysis or logarithmic discriminant analysis have also been used. The main problem of these supervised classifiers, however, is their sensitivity to the Hughes effect [16]. In turn, kernel methods [9] have been widely used in order to deal effectively with the Hughes phenomenon [10], [17].
0196-2892 © 2014 IEEE. Personal use is permitted, but republication/redistribution requires IEEE permission. See http://www.ieee.org/publications_standards/publications/rights/index.html for more information.
LI et al.: MULTIPLE FEATURE LEARNING FOR HYPERSPECTRAL IMAGE CLASSIFICATION
The idea is to use a kernel trick that allows the separation of the classes in a higher dimensional space by means of a nonlinear transformation, particularly in those cases in which the problem is not linearly separable in the original feature space. The combination of kernel methods and nonlinearly derived features (such as morphological features) has also been widely explored in the context of hyperspectral image classification [18]. Recently, a new trend has been oriented towards the composition of different kernels for improved learning, inspired by multiple kernel learning (MKL) approaches [19]–[22]. Some of these aspects were particularly discussed in [23], in which a detailed overview of machine learning in remote sensing data processing is given. For instance, a simple strategy to incorporate the spatial context into kernel-based classifiers is to define a pixel entity both in the spectral domain (using its spectral content) and in the spatial domain, e.g., by applying some feature extraction to its surrounding area which yields spatial (contextual) features, such as those derived using morphological analysis. These separated entities lead to two different kernel matrices, which can be easily computed. At this point, one can sum spectral and textural dedicated kernel matrices and introduce the cross-information between textural and spectral features in the formulation. This methodology yields a full family of composite kernel (CK)-based methods for hyperspectral data classification [24]. More recently, CKs have been generalized in [25] using the multinomial logistic regression (MLR) classifier [26] and extended multiattribute profiles (EMAPs) [27]. The MLR has been recently explored in hyperspectral imaging as a technique able to model the posterior class distributions in a Bayesian framework, thus supplying (in addition to the boundaries between the classes) a degree of plausibility for such classes [28]. The resulting generalized CK (GCK)-based MLR can combine multiple kernels without any restriction of convexity. This introduces a different approach with regards to traditional CK and MKL methods, in which CKs need to be convex combinations of kernels. At this point, it is important to emphasize that both CK learning and MKL focus on kernels, which are obtained either from the original (linear) spectral features or from (nonlinear) features such as morphological profiles. These approaches exploit the information contained in the kernels using linear combinations, due to the fact that the optimization problem is much easier to solve under a linear framework. With these assumptions in mind, very good performance has been reported for MKL or other CK learning approaches in different remote sensing problems [20], [21], [25]. However, these approaches focus on kernels, while kernel transformations of nonlinear features might bring redundancy or lose the physical meaning of the features themselves. Instead, in certain situations, it may be desirable to exploit the information carried out by each feature under its specifical physical or acquisition conditions. Inspired by these ideas and based on the fact that it is common to have both linear and nonlinear class boundaries in the same scene, this paper develops a new framework for classification of hyperspectral images which integrates multiple features extracted from linear and nonlinear transformations.
1593
A main characteristic of the presented approach is that it can adaptively exploit information from both linear and nonlinearly derived features, thus being able to address practical scenarios in which different classes may need different (linear or nonlinear) strategies. It should be noted that, as it is the case of MKL, the proposed approach also follows a linear optimization framework due to model complexity. However, the proposed approach has been designed in a way that it exhibits great flexibility to combine different types of features without any regularization parameters to control the weight of each feature, thus taking advantage of the complementarity that the features can provide without any a priori restrictions. In turn, MKL (which can be seen as a special instance of our proposed framework) generally needs to learn the weight parameters which is difficult from the viewpoint of both optimization and computational cost. Our presented approach is thus aimed at exploiting the different properties that both linear and nonlinear features can provide, with the ultimate goal of being able to characterize both linear and nonlinear boundaries independent of which type of features dominate the scene. In order to achieve the desired spectral–spatial integration that is normally expected in advanced classification problems, we consider morphological features as an important part of our framework, which also exploits kernel-based features and the original spectral information contained in the hyperspectral scene. The remainder of this paper is organized as follows. Section II presents the proposed classification framework, which uses the sparse MLR (SMLR) [29] as the baseline classifier. It will be shown that this classifier provides a natural framework to achieve the desired integration of multiple features. Section III reports the classification results obtained by the proposed multiple feature learning approach using different real hyperspectral data sets, which comprise a scene collected by the Airborne Visible/Infrared Imaging Spectrometer (AVIRIS) over the Indian Pines region in Indiana, two scenes collected by the Reflective Optics Spectrographic Imaging System (ROSIS) over the city of Pavia, Italy, and a scene collected by the Hyperspectral Digital Imagery Collection Experiment (HYDICE) over the city of Washington DC. These data sets have been widely used for evaluating the performance of hyperspectral image classification algorithms, and the results reported in this work rank among the most accurate ones ever reported for these scenes. Section IV concludes this paper with some remarks and hints at plausible future research lines. II. P ROPOSED F RAMEWORK FOR M ULTIPLE F EATURE L EARNING First of all, we define the notations that will be adopted throughout this paper. Let K ≡ {1, . . . , K} denote a set of K class labels, S ≡ {1, . . . , n} denote a set of integers indexing the n pixels of a hyperspectral image, x ≡ (x1 , . . . , xn ) ∈ Rd denote such hyperspectral image, which is made up of d-dimensional feature vectors, y ≡ (y1 , . . . , yn ) denote an image of labels, and DL ≡ {(x1 , y1 ), . . . , (xL , yL )} be the labeled training set with L being the number of samples in DL .
1594
IEEE TRANSACTIONS ON GEOSCIENCE AND REMOTE SENSING, VOL. 53, NO. 3, MARCH 2015
In this work, we model the posterior class probabilities using the MLR [26] as follows: � � T exp ω (k) h(xi ) p(yi = k|xi , ω) ≡ �K (1) � � (k)T h(x ) i k=1 exp ω where h(xi ) is the input feature, ω denotes the regressors, T
T
T
and ω ≡ [ω (1) , . . . , ω (K−1) ] . Since the density (1) does not depend on translations on the regressors ω (k) , in this work, we take ω (K) = 0. It should be noted that the input feature h can be linear or nonlinear. In the former case, we have h(xi ) = [1, xi,1 , . . . , xi,d ]T
(2)
where xi,j denotes the jth component of xi . On the other hand, the input feature h can also be nonlinear, in which case we have h(xi ) = [1, ψ1 (xi ), . . . , ψl1 (xi )]T
(3)
which is a feature vector with l1 elements and which is built based on part of or the complete observation x, with ψ(·) being a nonlinear function. Depending on the nonlinear function used, there are many possible ways to build nonlinear features. For instance, a kernel is some symmetric function with the form h(xi ) = [1, K(xi , x1 ), . . . , K(xi , xl )]T
(4)
where
and loss of physical meaning for the features. It is therefore important for a methodology to be able to cope with such linear and nonlinear boundaries simultaneously and adaptively. In this regard, the proposed framework provides the possibility to interpret multiple boundaries together. Again, different features have different characteristics, and the joint exploitation of different kinds of features could lead to improved data separability. Inspired by this idea, we develop a framework for the integration of multiple features, with the ultimate goal of exploiting the characteristics of each type of feature in the classification process. For this purpose, we first define �T � (6) h(xi ) = 1, h1 (xi )T , h2 (xi )T , . . . , hl (xi )T a vector of l fixed functions of the input data xi , where hj (xi ) ≡ [hj,1 (xi ), . . . , hj,lj (xi )] ∈ Rlj (for j = 1, . . . , l) is a feature obtained by a linear/nonlinear transformation and lj is the number of elements in hj (xi ). Notice that, if hj (xi ) is a kernel function, then (6) is a combination of multiple kernels (this is the particular case addressed by MKL). Instead, our proposed framework opens the structure to the exploitation of multiple features, not necessarily kernels. In this scenario, learning the class densities amounts to estimating the logistic regressors ω given by the input features h(x). Following previous work [26], [28]–[30], we compute ω by calculating the maximum a posteriori estimate = arg max ω
K(xi , xj ) = �φ(xi )φ(xj )�
ω
and φ(·) is a nonlinear mapping function. Kernels have been largely used in this context since they tend to improve data separability in the transformed space. However, other types of nonlinear functions for feature extraction may also be considered h(xi ) = [1, f1 (xi ), . . . , fl2 (xi )]T
(5)
where f (·) is a nonlinear feature extraction transformation on the original data (for instance, the EMAP in [27]) and l2 is the number of elements in h(xi ). It should be noted that both the linear function h(xi ) = xi and the kernel function h(xi ) = K(xi , x) can be simply regarded as two instances of the nonlinear case. As mentioned before, there have been some efforts in the literature to combine different types of features, such as MKL. Linear features have been generally less effective for hyperspectral image classification than nonlinear features. In turn, kernel-based features (obtained from linear or nonlinear transformations) have been more widely used. This trend has been exploited by MKL by focusing on kernel features, which are extracted from the original spectral data or the nonlinear transformed data. However, few efforts have attempted to exploit both linear and nonlinear features in simultaneous fashion, despite the fact that they can exhibit some complementary properties (e.g., some classes may be properly separated using linear boundaries, while other classes may require nonlinear boundaries for separability). In real analysis scenarios, it is likely to have both linear and nonlinear class boundaries in the same hyperspectral image. At the same time, kernel transformations of nonlinear features may lead to data redundancy
�(ω) + log p(ω)
(7)
where �(ω) is the log-likelihood function given by �(ω) ≡ log ≡
L �
L
p(yi |xi , ω)
i=1 T
h (xi )ω
(yi )
−log
i=1
K �
� � T (k) exp h (xi )ω
(8)
k=1
and log p(ω) is a prior over ω which is independent from the observation x. In order to control the machine complexity and, thus, its generalization capacity, we model ω as a random vector with Laplacian density p(ω) ∝ exp(−λ�ω�1 ), where λ is the regularization parameter controlling the degree of sparsity [29], [30]. Let ν j = [ωj,1 , . . . , ωj,lj ]T denote the regressors associated with feature hj (·). By introducing the input features in (6), problem (7) can be solved as follows:
K L � � � � T (yi ) T (k) = arg max h (xi )ω −log exp h (xi )ω ω ω
i=1
k=1
+ log p(ω) L � (y ) = arg max ω1 i + log p(ω) ω
+
(9) (10)
i=1 lj
L � l � � i=1 j=1 t=1
(y )
hj,p (xi )ωj,pi
K � � � (k) (k) − log exp ω1 +hj,p (xi )ωj,p k=1
(11)
LI et al.: MULTIPLE FEATURE LEARNING FOR HYPERSPECTRAL IMAGE CLASSIFICATION
where the term in (10) is independent from the observation data. It is also independent from the nonlinear functions used. At this point, several important observations can be made. 1) First and foremost, if h(xi ) is a combination of multiple kernels, then (9) stands for a typical MKL problem. However, as compared with the simple MKL [19] implemented on the support vector machine model, problem (9) require no convexity constraint for the combination of multiple kernels. From this observation, we can also see MKL as a specific instance of the proposed multiple learning framework. 2) As shown in (11) we have a linear combination of multiple nonlinear features which is not restricted to kernels, and the logistic weights ν j are specific for each associated nonlinear feature hj (·) and independent from any other ν p , for p = 1, . . . , l and p �= j. This is quite important as, on the one hand, the linear combination provides great flexibility for the classifier to search for the most representative features, which could be linear or nonlinear, thus balancing the information provided by different features while reducing the computational complexity due to the possibility to use a conventional optimization approach. 3) Furthermore, the linear combination in (11) provides sufficient flexibility to find the most representative feature hj and also provides the potential to find the most representative elements in each feature. As a result, the final logistic weights could be derived from a combination of different features, which is a collaborative solution involving multiple (linear or nonlinear) features. 4) It is finally important to point out that, by introducing the Laplacian prior p(ω) which can lead to sparse solutions, the proposed approach can deal with high-dimensional input features using limited training samples, thus addressing ill-posed problems. To conclude this section, we emphasize that the optimization problem (9) can be solved by the SMLR in [29] and by the fast SMLR in [31]. However, most hyperspectral data sets are beyond the reach of these algorithms, as their processing becomes unbearable when the dimensionality of the input features increases. This is even more critical in our framework, in which we use multiple features. In order to address this issue, we take advantage of the logistic regression via variable splitting and augmented Lagrangian (LORSAL) algorithm in [30] and [32], with overall complexity O(L × (l1 + · · · + ll ) × K). At this point, we recall that L is the number of training samples, K is the number of classes, and lj is the number of elements in the jth linear/nonlinear feature. LORSAL is able to deal with high-dimensional features and plays a central role in this work, as in previous contributions [28], [30]. A full demo with our algorithm implementation is given. III. E XPERIMENTAL R ESULTS In this section, we provide an experimental evaluation for the presented framework using four real hyperspectral data sets. In our experiments, we consider four different linear/nonlinear features as reported in Table I. Specifically, we use a linear
1595
TABLE I T YPES OF F EATURES C ONSIDERED IN T HIS W ORK
feature hlinear (the original spectral information), a nonlinear feature hEMAP (which uses the concept of EMAP in [27] and [33]), and two kernel features constructed over the two previously mentioned sources of information (spectral and spatial, respectively) using the Gaussian radial-basis-function kernel: K(xi , xj ) = exp(−�xi − xj �2 /2σ 2 ) which is widely used in hyperspectral image classification [10]. In this work, the spectral kernel Klinear is built by using the original spectral data, and the spatial kernel KEMAP is built by using the EMAP. At this point, we emphasize that the linear and nonlinear features that have been selected for experiments in this work can be considered highly representative of the spectral and spatial information contained in the scene. While hlinear is a linear feature related to the original spectral information, hEMAP exploits the interpretation of the data in spatial terms, and Klinear and KEMAP are nonlinear representations of the original data and EMAPs, respectively. For the considered problems, we only use four different features as these features are able to provide very good performance. However, we would like to emphasize again that any other kind of features can be included in our framework, according to the considered application. At this point, we reiterate that the proposed framework has been designed to cope with both linear and nonlinear boundaries in a general way so that other additional features (linear and nonlinear) could be included in accordance with the specific application domain. We believe, however, that the selected features are sufficiently representative in order to demonstrate the advantages of our proposed framework. We emphasize that, in all our experiments, the parameter values involved have been carefully optimized so that the best performance is reported for each considered method. For the EMAP-based feature extraction, we have used a grid search approach to optimize parameter values, and for the LORSAL classification, we have also carefully optimized the parameter λ. Nevertheless, as shown in [30], we may have a large amount of suboptimal options, and the solution is insensitive to different suboptimal values. The reported figures of overall accuracy (OA) [%], average accuracy (AA) [%], κ statistic [%], and individual classification accuracies [%] are obtained by averaging the results obtained after conducting ten independent Monte Carlo runs with respect to the training set DL . At the same time, we include the standard deviation in order to assess the statistical significance of the results. Finally, in order to show the efficiency of the proposed framework, the computational time in seconds for learning the features is also reported in all cases (the time for deriving the features is not included for simplicity).
1596
IEEE TRANSACTIONS ON GEOSCIENCE AND REMOTE SENSING, VOL. 53, NO. 3, MARCH 2015
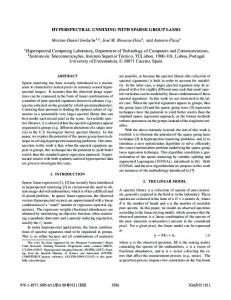
Fig. 1. (a) False color composition of the AVIRIS Indian Pines scene. (b) Reference map containing 16 mutually exclusive land-cover classes (right).
Fig. 2. (a) False color composition of the ROSIS University of Pavia scene. (b) Reference map containing nine mutually exclusive land-cover classes. (c) Training set used in experiments.
The remainder of the section is organized as follows. In Section III-A, we introduce the data sets used for evaluation. Section III-B describes the experiments with the AVIRIS Indian Pines data set. Section III-C conducts experiments using the ROSIS Pavia University data set. Finally, Section III-D presents the results obtained for the two remaining hyperspectral data sets. A. Hyperspectral Data Sets Four hyperspectral data sets collected by two different instruments are used in our experiments. 1) The first hyperspectral image used in experiments was collected by the AVIRIS sensor over the Indian Pines region in Northwestern Indiana in 1992. This scene, with a size of 145 lines by 145 samples, was acquired over a mixed agricultural/forest area, early in the growing season. The scene comprises 202 spectral channels in the wavelength range from 0.4 to 2.5 μm, nominal spectral resolution of 10 nm, moderate spatial resolution of 20 m by pixel, and 16-b radiometric resolution. After an initial screening, several spectral bands were removed from the data set due to noise and water absorption phenomena, leaving a total of 164 radiance channels to be used in the experiments. For illustrative purposes, Fig. 1(a) shows a false color composition of the AVIRIS Indian Pines scene, while Fig. 1(b) shows the reference map available
for the scene, displayed in the form of a class assignment for each labeled pixel, with 16 mutually exclusive reference classes, for a total of 10 366 samples. These data, including reference information, are available online at ftp://ftp.ecn.purdue.edu/biehl/MultiSpec/92AV3C. tif.zip, a fact which has made this scene a widely used benchmark for testing the accuracy of hyperspectral data classification algorithms. This scene constitutes a challenging classification problem due to the presence of mixed pixels in all available classes and because of the unbalanced number of available labeled pixels per class. 2) The second hyperspectral data set was collected by the ROSIS optical sensor over the urban area of the University of Pavia, Italy. The flight was operated by the Deutschen Zentrum for Luftund Raumfahrt (DLR, the German Aerospace Agency) in the framework of the HySens project, managed and sponsored by the European Union. The image size in pixels is 610 × 340, with very high spatial resolution of 1.3 me per pixel. The number of data channels in the acquired image is 103 (with spectral range from 0.43 to 0.86 μm). Fig. 2(a) shows a false color composite of the image, while Fig. 2(b) shows nine reference classes of interest, which comprise urban features, as well as soil and vegetation features. Out of the available reference pixels, 3921 were used for training [see Fig. 2(c)], and 42 776 samples were used for testing.
LI et al.: MULTIPLE FEATURE LEARNING FOR HYPERSPECTRAL IMAGE CLASSIFICATION
1597
TABLE II OVERALL , AVERAGE , AND I NDIVIDUAL C LASSIFICATION ACCURACIES [%] O BTAINED BY THE P ROPOSED F RAMEWORK (W ITH D IFFERENT T YPES OF F EATURES ) W HEN A PPLIED TO THE AVIRIS I NDIAN P INES H YPERSPECTRAL DATA S ET W ITH A BALANCED T RAINING S ET IN W HICH 5% OF THE L ABELED S AMPLES P ER C LASS A RE U SED FOR T RAINING ( A T OTAL OF 515 S AMPLES ) AND THE R EMAINING L ABELED S AMPLES A RE U SED FOR T ESTING
3) The third data set was also collected by the ROSIS optical sensor over a different location in the city center of Pavia, Italy. The flight was also operated by DLR in the HySens framework. The number of data channels in the acquired image is 102 (with spectral range from 0.43 to 0.86 μm), and the spatial resolution is again 1.3 m per pixel. These data were used in the 2008 IEEE Geoscience and Remote Sensing Data Fusion Technical Committee contest. Additional details about the data and the training/test samples are available in [35]. 4) The fourth data set was collected by HYDICE over the Mall area in Washington DC. The data set comprises 210 spectral bands from 0.4 to 2.4 μm. Bands in the 0.9- and 1.4-μm region where the atmosphere is opaque have been omitted from the data set, leaving 191 bands. The data set contains 1208 × 307 pixels, with a spatial resolution of about 2.8 m. Seven thematic land-cover classes are present in the scene: roofs, street, path (graveled paths down the mall center), grass, trees, water, and shadow, with 19 629 labeled samples in the ground-truth image. The scene is available online at http://cobweb.ecn.purdue. edu/~biehl/Hyperspectral_Project.zip.
B. Experiments With the AVIRIS Indian Pines Data Set For this data set, the EMAPs were built using threshold values in the range from 2.5% to 10% with respect to the mean of the individual features, with a step of 2.5% for the standard deviation attribute and thresholds of 200, 500, and 1000 for the area attribute. 1) Experiment 1: In our first set of experiments, we evaluated the classification accuracy of the proposed approach using a balanced training set per class in which around 5% of the labeled samples per class were used for training (a total of 515 samples), and the remaining labeled samples were used for testing. For very small classes, we took a minimum of three training samples per class. Table II shows the overall, average, and individual classification accuracies (in percentage) and the κ statistic, along with the standard deviations, obtained after using the proposed framework with different types of features when applied to the AVIRIS Indian Pines scene. From Table II, we can conclude that the proposed framework achieved the best results in terms of classification accuracies when all the considered features were used. This is expected since, in this case, the proposed scheme seeks for the best solution among all the available (linear and nonlinear) features.
1598
IEEE TRANSACTIONS ON GEOSCIENCE AND REMOTE SENSING, VOL. 53, NO. 3, MARCH 2015
TABLE III C OMPARISON B ETWEEN THE P ROPOSED F RAMEWORK AND CK [24] AND GCK [25] U SING THE AVIRIS I NDIAN P INES S CENE . T HE P ROCESSING T IME ( IN S ECONDS ) I S A LSO R EPORTED IN E ACH C ASE
TABLE IV N UMBER OF P IXELS D OMINATED BY E ACH C ONSIDERED T YPE OF F EATURE AND C LASSIFICATION ACCURACIES O BTAINED W HEN A PPLYING THE P ROPOSED F RAMEWORK TO THE AVIRIS I NDIAN P INES DATA S ET. I N T HIS E XPERIMENT, W E U SED A PPROXIMATELY 30 T RAINING S AMPLES P ER C LASS
On the other hand, the results obtained using the nonlinear feature hEMAP are better than those obtained using the original spectral information. This is consistent with previous studies, indicating that the EMAP provides a powerful tool for feature extraction, where the features extracted in the spatial domain can improve class separability [27], [34]. Another interesting observation is that the results obtained using only the nonlinear feature hEMAP are better than those obtained from its kernel transformation KEMAP . This suggests that the kernel transformation of this particular nonlinear feature may not be able to improve the class separability. 2) Experiment 2: In our second experiment, we compare the proposed framework with CK learning [24] and GCK learning [25]. Notice that all the experiments share exactly the same training and test sets. Table III shows that the proposed framework with hall (i.e., using all the considered features) leads to the best classification results. However, the proposed framework exhibits the highest computational cost. Another
important observation is that the results obtained by the EMAPs hEMAP were better than those obtained by the kernel transformation KEMAP . As discussed, this is an indication that a kernel transformation of high-dimensional nonlinear features may not be able to improve the class separability. 3) Experiment 3: In our third experiment, we analyze the relevance of linear and nonlinear features in the final classification results, with the ultimate goal of analyzing their capacity to characterize different complex classes in the scene. That is, in the set of all nonlinear features hall , we would like to analyze which feature has the most significant contribution. Here, we will use approximately 30 training samples per class, which is an unbalanced scenario in comparison with the one considered in the former experiment. Let (ν j )T hj be the numerator of the MLR in (1). For p = 1, . . . , K and p �= j, if (ν j )T hj ≥ (ν p )T hp , then we conclude that the classification is dominated by hj . Table IV reports the total number of pixels in the scene which are dominated by each kind of feature.
LI et al.: MULTIPLE FEATURE LEARNING FOR HYPERSPECTRAL IMAGE CLASSIFICATION
1599
Fig. 3. Logistic regressors of the MLR classifier obtained from the AVIRIS Indian Pines data set corresponding to the experiment reported in Table IV. (a) Class Corn-no till is dominated by the spectral kernel Klinear . (b) Class Soybeans-min till is dominated by the original spectral information hlinear . (c) Class Woods is dominated by the EMAP features hEMAP . (d) Class Soybean-clean till has contributions from all the considered features.
Several conclusions can be observed from Table IV. First and foremost, it is remarkable that, for most classes, the dominating feature according to Table IV is hEMAP . This is consistent with previous works, revealing the power of EMAP for separating most classes which are nonlinearly separable in the spatial domain [27], [34]. Furthermore, it is remarkable that the original spectral information is highly relevant. This is due to the fact that some of the classes, e.g., Soybeans-min till, are likely to be linearly separable. It is also observable that the kernel version of the spectral information provides important contributions, particularly for the Corn-no till. This is because no-till is an agricultural technique which increases the amount of water that infiltrates into the soil and increases organic matter retention and cycling of nutrients in the soil. Along with the complexity of corn itself, this may lead to nonlinearities that appear to be better explained by kernel-based features, as indicated in Table IV. However, the kernel version of EMAP rarely dominates the classification. This confirms our introspection that a kernel transformation of the nonlinear EMAP feature may not significantly improve the class separability, which is already fully exploited by the original EMAP itself. In order to further illustrate the relative weights of the logistic regressors in the MLR classification, Fig. 3 shows the specific regressors calculated for classes Corn-no till, Soybeans-min till, and Woods, which are respectively dominated by Klinear , hlinear , and hEMAP . Fig. 3(d) shows the regressors calculated for class Soybeans-clean till, which has combined contributions
from all features. From Fig. 3, it is clear that the original spectral information and the EMAP features are more relevant than the other tested features. A final observation resulting from this experiment is that, given the high computational complexity associated to using all the features hall , we can obtain a suitable subset of features, including using only hlinear and hEMAP , i.e., hsubset = [hlinear , hEMAP ], which leads to a comparable solution with very competitive computational cost. In this case, the kernel transformations are not relevant for improving classification accuracies, and the combination of the original (spectral and EMAP-based) features can lead to very similar performance. For illustrative purposes, Fig. 4 shows some of the obtained classification maps after applying the proposed framework to the AVIRIS Indian Pines scene using approximately 30 training samples per class. These maps correspond to one of the ten Monte Carlo runs conducted for each considered type of feature. As we can observe in Fig. 4, the best classification accuracies are obtained using hall , but the accuracies obtained using hEMAP and KEMAP are also significant. Finally, the accuracies obtained using the original spectral information only (hlinear ) are low in comparison with that of the other approaches, while the introduction of the kernel version Klinear improves the obtained results but not to the levels achieved when EMAP features are also used for the proposed framework. In turn, EMAP-based features alone can lead to significant accuracies without the need for a kernel-based transformation.
1600
IEEE TRANSACTIONS ON GEOSCIENCE AND REMOTE SENSING, VOL. 53, NO. 3, MARCH 2015
Fig. 4. Classification maps (along with the overall accuracies) obtained by the proposed framework for the AVIRIS Indian Pines data set, using approximately 30 training samples per class. TABLE V OVERALL , AVERAGE , AND I NDIVIDUAL C LASS ACCURACIES [%] O BTAINED BY THE P ROPOSED F RAMEWORK (W ITH D IFFERENT T YPES OF F EATURES ) W HEN A PPLIED TO THE ROSIS PAVIA U NIVERSITY H YPERSPECTRAL DATA S ET U SING THE F IXED T RAINING S ET IN F IG . 2(c). T HE P ROCESSING T IME ( IN S ECONDS ) I S A LSO R EPORTED IN E ACH C ASE
C. Experiments With ROSIS University of Pavia Data Set 1) Experiment 1: In our first experiment with the ROSIS Pavia University scene, we evaluate the classification accuracies achieved by the proposed framework. In this experiment, we consider, in addition to the features used in the previous
experiment, a subset given by hsubset = [hlinear , hEMAP ] for comparison. Table V shows the overall, average, and individual classification accuracies (in percentage) and the κ statistic obtained by the proposed framework using different types of input features. In all cases, we used the fixed training set in
LI et al.: MULTIPLE FEATURE LEARNING FOR HYPERSPECTRAL IMAGE CLASSIFICATION
1601
TABLE VI C OMPARISON B ETWEEN THE P ROPOSED F RAMEWORK AND CK [24] AND GCK [25] U SING THE ROSIS PAVIA U NIVERSITY S CENE . T HE P ROCESSING T IME ( IN S ECONDS ) I S A LSO R EPORTED IN E ACH C ASE
TABLE VII S TATISTICAL S IGNIFICANCE OF THE D IFFERENCES IN C LASSIFICATION ACCURACIES (M EASURED U SING M C N EMAR ’ S T EST IN [36]) FOR THE P ROPOSED F RAMEWORK , U SING D IFFERENT T YPES OF F EATURES E XTRACTED F ROM THE ROSIS PAVIA U NIVERSITY S CENE
Fig. 2(c) to train the classifier. The EMAPs in this particular experiment were built using threshold values in the range from 2.5% to 10% with respect to the mean of the individual features and with a step of 2.5% for the definition of the criteria based on the standard deviation attribute. Values of 100, 200, 500, and 1000 were selected as references for the area attribute. The threshold values considered for the area attribute were chosen according to the resolution of the data and, thus, the size of the objects present in the scene. As shown by Table V, the classification accuracies obtained by the proposed framework are very high. Furthermore, as it was already the case in the previous experiment, the results using hsubset are comparable to those obtained using the full set of features, hall . However, in the case of hsubset , the results can be obtained with much less computational complexity when compared to hall . This confirms our introspection that, even though our multiple learning framework can adequately exploit all available features, a selection of the most relevant features for classification (in this case, the original spectral information and the spatial characterization provided by EMAPs) can lead to similar results but with less computational complexity. In this experiment, as it was already the case in our experiment with the AVIRIS Indian Pines scene, kernel transformations cannot bring relevant additional information for classification. 2) Experiment 2: In our second experiment, we provide a comparison between the proposed framework with CK [24] and GCK [25]. Table VI shows the obtained results, in which all the experiments share exactly the same training and test sets. Similar observations can be reported for the ROSIS Pavia University
scene as the case already shown in the previous section with the AVIRIS Indian Pines data, i.e., the proposed framework with hall (which learns all the available linear and nonlinear features) obtained very competitive results with minimum computational cost. 3) Experiment 3: Since the accuracy values obtained by hEMAP , KEMAP , hall , and hsubset are apparently similar, in our third experiment with the ROSIS Pavia University scene, we analyze the statistical differences among all the considered features using McNemar’s test [36]. In this test, a value of |Z| > 1.96 indicates that there is a significant difference in accuracy between two classification methods. The sign of Z is also a criterion to indicate whether a first classifier is more accurate than a second one (Z > 0) or vice versa (Z < 0). Table VII provides the results obtained for all the considered types of features with the ROSIS Pavia University data set. As it can be seen from Table VII, the performances of EMAP features (hEMAP ) and their kernel transformation (KEMAP ) are very similar in the statistical sense. Therefore, instead of using KEMAP , we can simply resort to hEMAP , which provides similar accuracies with lower computational cost. Furthermore, it is noticeable that the performance of the original spectral information (hlinear ) is significantly different from that achieved by the nonlinear transformations. As a result, this experiment reveals that it is very important to combine both linear and nonlinear features for classification. This is successfully achieved by the presented method using all the features (hall ) and a carefully selected subset (hsubset ), providing very competitive results in the considered analysis scenario.
1602
IEEE TRANSACTIONS ON GEOSCIENCE AND REMOTE SENSING, VOL. 53, NO. 3, MARCH 2015
Fig. 5. Classification maps (along with the overall accuracies) obtained by the proposed framework for the ROSIS Pavia University data set, using the fixed training set in Fig. 2(c).
For illustrative purposes, Fig. 5 shows some of the classification maps obtained after applying the proposed framework to the ROSIS Pavia University scene using the fixed training set depicted in Fig. 2(c). As we can observe in Fig. 5, a very good delineation of complex urban structures can be observed in the results obtained using any of the features including EMAPs, such as hEMAP . Quite opposite, the accuracies obtained using the original spectral information only (hlinear ) are low in comparison with that of the other approaches. In this particular case, as it was already observed in the experiments with the AVIRIS Indian Pines scene, the introduction of the kernel version Klinear improves the obtained results, but not to the levels observed when EMAP features are used in the proposed framework.
D. Other Experiments In this section, we conduct an evaluation of the proposed approach using the ROSIS Pavia Centre and HYDICE Washington DC data sets. In the previously conducted experiments, we observed that the proposed framework with hsubset (which integrates both linear and nonlinear features) could obtain very good performance with minimum computational cost. Therefore, in this section, we only evaluate the proposed framework by using hsubset . Table VIII shows the obtained classification accuracies (as a function of the number of training samples) for these two data sets in this particular case. From Table VIII, it can be concluded that the proposed approach achieved very good performance, even with very limited training sets. Also, since the proposed approach does not require kernel
LI et al.: MULTIPLE FEATURE LEARNING FOR HYPERSPECTRAL IMAGE CLASSIFICATION
1603
TABLE VIII OA, AA, AND κ S TATISTICS —P LUS /M INUS THE S TANDARD D EVIATION —A S A F UNCTION OF THE N UMBER OF L ABELED S AMPLES P ER C LASS (W ITH THE T OTAL N UMBER OF L ABELED S AMPLES IN PARENTHESES ) O BTAINED BY THE P ROPOSED M ETHOD FOR THE ROSIS PAVIA C ENTRE AND HYDICE WASHINGTON DC DATA S ETS
transformations, it exhibits low computational cost. The low standard deviation values reported in Table VIII also indicate that the proposed framework is quite robust. IV. C ONCLUSION AND F UTURE R ESEARCH L INES In this paper, we have developed a new framework for multiple feature learning which is based on the integration of different types of (linear and nonlinear) features. A main contribution of the presented approach is the joint consideration of both linear and nonlinear features without any regularization parameters to control the weight of each feature so that different types of available features can be jointly exploited (in a collaborative and flexible way) for hyperspectral image classification. Our main goal is to address a common situation in practice, in which some classes may be separated using linearly derived features while others may require nonlinearly derived features. Until now, a main trend when using multiple feature learning relies on the use of kernels, i.e., MKL. However, very few techniques have been explored in order to adaptively select the most useful type of feature for different classes in the scene. In this work, we give a first step in this direction and contribute a framework which is flexible and able to deal with both linear and nonlinear class boundaries. A main innovation of our proposed approach is that it is more flexible than MKL, in the sense that it can consider linear and nonlinear features and not only kernel features. As a result, MKL can be considered as a special case of the proposed framework. Although the presented framework is general and suitable to incorporate any kind of input features, in this work, we have considered
a set of highly representative features such as the original (spectral) information contained in the scene, a set of (spatial) morphological features extracted using different attributes, as well as kernel-based transformations of the aforementioned features. The framework therefore permits great flexibility in the exploitation of the advantages of each type of feature, as well as the incorporation of additional features in future developments. Our experimental results, conducted with four widely used hyperspectral scenes, indicate that spatial-based features are very important for classification, while there is no significant difference between the original (spectral- and spatial-based) features and their kernel-based transformations. However, the joint consideration of a pool of linear and nonlinear features allowed us to approach the classification problem in a way that is more general and flexible. In addition, our proposed strategy allowed us to reduce the computational complexity of the framework by selecting the most relevant features a priori, although the proposed framework can naturally select the most useful out of a large pool of input features for classification, without any requirement in terms of setting of the regularization parameters or a priori information to control the weight of each feature. It should also be noted that the classification accuracies reported for the four considered hyperspectral scenes rank among the most accurate ones ever reported for these scenes. An important observation from our experiments is that, under the proposed multiple feature learning framework, kernel transformations may not be able to improve class separability (in particular, for nonlinear features). Since, in this context, kernel transformations increase computational complexity, our
1604
IEEE TRANSACTIONS ON GEOSCIENCE AND REMOTE SENSING, VOL. 53, NO. 3, MARCH 2015
proposed framework allows excluding such kernel features and using the original features instead for specific applications. As future work, we will conduct a more detailed investigation of other possible (linear and nonlinear) features that can be integrated in the proposed framework. Based on the observation that kernel-based features may not be as important as other features in our presented framework, the computational complexity can be further reduced by adaptively selecting the most relevant features for classification. We are also developing parallel versions of the proposed framework in a variety of architectures, such as commodity graphics processing units (GPUs) or multi-GPU platforms. ACKNOWLEDGMENT The authors would like to thank Prof. D. Landgrebe for providing the Indian Pines and Washington DC Mall hyperspectral data sets used in the experiments. Last but not least, the authors would also like to thank the Associate Editor who handled the manuscript and the anonymous reviewers for their outstanding comments and suggestions, which greatly helped to improve the technical quality and presentation of the manuscript. R EFERENCES [1] A. Plaza et al., “Recent advances in techniques for hyperspectral image processing,” Remote Sens. Environ., vol. 113, no. 1, pp. S110–S122, Sep. 2009. [2] M. Fauvel, Y. Tarabalka, J. A. Benediktsson, J. Chanussot, and J. C. Tilton, “Advances in spectral-spatial classification of hyperspectral images,” Proc. IEEE, vol. 101, no. 3, pp. 652–675, Mar. 2013. [3] D. Landgrebe, “Hyperspectral image data analysis,” IEEE Signal Process. Mag., vol. 19, no. 1, pp. 17–28, Jan. 2002. [4] A. Green, M. Berman, P. Switzer, and M. Craig, “A transformation for ordering multispectral data in terms of image quality with implications for noise removal,” IEEE Trans. Geosci. Remote Sens., vol. 26, no. 1, pp. 65–74, Jan. 1988. [5] J. Bayliss, J. A. Gualtieri, and R. Cromp, “Analysing hyperspectral data with independent component analysis,” in Proc. SPIE, 1997, vol. 3240, pp. 133–143. [6] I. Dopido, M. Zortea, A. Villa, A. Plaza, and P. Gamba, “Unmixing prior to supervised classification of remotely sensed hyperspectral images,” IEEE Geosci. Remote Sens. Lett., vol. 8, no. 4, pp. 760–764, Jul. 2011. [7] L. O. Jimenez-Rodriguez, E. Arzuaga-Cruz, and M. Velez-Reyes, “Unsupervised linear feature-extraction methods and their effects in the classification of high-dimensional data,” IEEE Trans. Geosci. Remote Sens., vol. 45, no. 2, pp. 469–483, Feb. 2007. [8] J. A. Richards and X. Jia, Remote Sensing Digital Image Analysis: An Introduction. New York, NY, USA: Springer-Verlag, 2006. [9] B. Scholkopf and A. Smola, Learning With Kernels? Support Vector Machines, Regularization, Optimization and Beyond. Cambridge, MA, USA: MIT Press, 2002. [10] G. Camps-Valls and L. Bruzzone, “Kernel-based methods for hyperspectral image classification,” IEEE Trans. Geosci. Remote Sens., vol. 43, no. 6, pp. 1351–1362, Jun. 2005. [11] B. Du, L. Zhang, L. Zhang, T. Chen, and K. Wu, “A discriminative manifold learning based dimension reduction method,” Int. J. Fuzzy Syst., vol. 14, no. 2, pp. 272–277, Jun. 2012. [12] W. Kim and M. Crawford, “Adaptive classification for hyperspectral image data using manifold regularization kernel machines,” IEEE Trans. Geosci. Remote Sens., vol. 48, no. 11, pp. 4110–4121, Nov. 2010. [13] M. Pesaresi and J. A. Benediktsson, “A new approach for the morphological segmentation of high-resolution satellite imagery,” IEEE Trans. Geosci. Remote Sens., vol. 39, no. 2, pp. 309–320, Feb. 2001. [14] J. A. Benediktsson, J. A. Palmason, and J. R. Sveinsson, “Classification of hyperspectral data from urban areas based on extended morphological profiles,” IEEE Trans. Geosci. Remote Sens., vol. 43, no. 3, pp. 480–491, Mar. 2005.
[15] T. V. Bandos, L. Bruzzone, and G. Camps-Valls, “Classification of hyperspectral images with regularized linear discriminant analysis,” IEEE Trans. Geosci. Remote Sens., vol. 47, no. 3, pp. 862–873, Mar. 2009. [16] J. M. Bioucas-Dias et al., “Hyperspectral remote sensing data analysis and future challenges,” IEEE Geosci. Remote Sens. Mag., vol. 1, no. 2, pp. 6–36, Jun. 2013. [17] F. Melgani and L. Bruzzone, “Classification of hyperspectral remotesensing images with support vector machines,” IEEE Trans. Geosci. Remote Sens., vol. 42, no. 8, pp. 1778–1790, Aug. 2004. [18] M. Fauvel, J. Benediktsson, J. Chanussot, and J. Sveinsson, “Spectral and spatial classification of hyperspectral data using SVMs and morphological profiles,” IEEE Trans. Geosci. Remote Sens., vol. 46, no. 11, pp. 3804– 3814, 2008. [19] A. Rakotomamonjy, F. Bach, S. Canu, and Y. Grandvalet, “SimpleMKL,” J. Mach. Learn. Res., vol. 9, no. 11, pp. 2491–2521, Nov. 2008. [20] D. Tuia, G. Matasci, G. Camps-Valls, and M. Kanevski, “Learning relevant image features with multiple kernel classification,” IEEE Trans. Geosci. Remote Sens., vol. 48, no. 10, pp. 3780–3791, Oct. 2010. [21] Y. Gu et al., “Representative multiple kernel learning for classification in hyperspectral imagery,” IEEE Trans. Geosci. Remote Sens., vol. 50, no. 7, pp. 2852–2865, Jul. 2012. [22] K. Bakos and P. Gamba, “Hierarchical hybrid decision tree fusion of multiple hyperspectral data processing chains,” IEEE Trans. Geosci. Remote Sens., vol. 49, no. 1, pp. 388–394, Jan. 2011. [23] D. Tuia, E. Merenyi, X. Jia, and M. Grana-Romay, “Foreword to the special issue on machine learning for remote sensing data processing,” IEEE J. Sel. Topics Appl. Earth Observ. Remote Sens., vol. 7, no. 4, pp. 1007–1011, Apr. 2014. [24] G. Camps-Valls, L. Gomez-Chova, J. Muéz-Mari, J. Vila-Frances, and J. Calpe-Maravilla, “Composite kernels for hyperspectral image classification,” IEEE Geosci. Remote Sens. Lett. , vol. 3, no. 1, pp. 93–97, Jan. 2006. [25] J. Li, P. Marpu, A. Plaza, J. Bioucas-Dias, and J. A. Benediktsson, “Generalized composite kernel framework for hyperspectral image classification,” IEEE Trans. Geosci. Remote Sens., vol. 51, no. 9, pp. 4816–4829, Sep. 2013. [26] D. Böhning, “Multinomial logistic regression algorithm,” Ann. Inst. Statist. Math., vol. 44, no. 1, pp. 197–200, 1992. [27] M. Dalla Mura, J. A. Benediktsson, B. Waske, and L. Bruzzone, “Morphological attribute profiles for the analysis of very high resolution images,” IEEE Trans. Geosci. Remote Sens., vol. 48, no. 10, pp. 3747–3762, Oct. 2010. [28] J. Li, J. Bioucas-Dias, and A. Plaza, “Semi-supervised hyperspectral image segmentation using multinomial logistic regression with active learning,” IEEE Trans. Geosci. Remote Sens., vol. 48, no. 11, pp. 4085–4098, Nov. 2010. [29] B. Krishnapuram, L. Carin, M. Figueiredo, and A. Hartemink, “Sparse multinomial logistic regression: Fast algorithms and generalization bounds,” IEEE Trans. Pattern Anal. Mach. Intell., vol. 27, no. 6, pp. 957– 968, Jun. 2005. [30] J. Li, J. Bioucas-Dias, and A. Plaza, “Hyperspectral image segmentation using a new Bayesian approach with active learning,” IEEE Trans. Geosci. Remote Sens., vol. 49, no. 19, pp. 3947–3960, Oct. 2011. [31] J. S. Borges, J. M. Bioucas-Dias, and A. R. S. Marcal, “Bayesian hyperspectral image segmentation with discriminative class learning,” IEEE Trans. Geosci. Remote Sens., vol. 49, no. 6, pp. 2151–2164, Jun. 2011. [32] J. Bioucas-Dias and M. Figueiredo, “Logistic Regression Via Variable Splitting and Augmented Lagrangian Tools,” Instituto Superior Técnico, TULisbon, Lisbon, Portugal, 2009, Tech. Rep.. [33] P. Marpu, M. Pedergnana, M. Dalla Mura, J. Benediktsson, and L. Bruzzone, “Automatic generation of standard deviation attribute profiles for spectral spatial classification of remote sensing data,” IEEE Geosci. Remote Sens. Lett., vol. 10, no. 2, pp. 293–297, Mar. 2013. [34] M. Dalla Mura, J. A. Benediktsson, B. Waske, and L. Bruzzone, “Extended profiles with morphological attribute filters for the analysis of hyperspectral data,” Int. J. Remote Sens., vol. 31, no. 22, pp. 5975–5991, Jul. 2010. [35] G. Licciardi et al., “Decision fusion for the classification of hyperspectral data: Outcome of the 2008 GRS-S data fusion contest,” IEEE Trans. Geosci. Remote Sens., vol. 47, no. 11, pp. 3857–3865, Nov. 2009. [36] G. M. Foody, “Thematic map comparison: Evaluating the statistical significance of differences in classification accuracy,” Photogramm. Remote Sens., vol. 70, no. 5, pp. 627–633, May 2004.
LI et al.: MULTIPLE FEATURE LEARNING FOR HYPERSPECTRAL IMAGE CLASSIFICATION
Jun Li received the B.S. degree in geographic information systems from Hunan Normal University, Changsha, China, in 2004, the M.E. degree in remote sensing from Peking University, Beijing, China, in 2007, and the Ph.D. degree in electrical engineering from the Instituto de Telecomunicações, Instituto Superior Técnico (IST), Universidade Tica de Lisboa, Lisbon, Portugal, in 2011. From 2007 to 2011, she was a Marie Curie Research Fellow with the Departamento de Engenharia Electrotécnica e de Computadores and the Instituto de Telecomunicações, IST, Universidade Técnica de Lisboa, in the framework of the European Doctorate for Signal Processing (SIGNAL). She has also been actively involved in the Hyperspectral Imaging Network, a Marie Curie Research Training Network involving 15 partners in 12 countries and intended to foster research, training, and cooperation on hyperspectral imaging at the European level. Since 2011, she has been a Postdoctoral Researcher with the Hyperspectral Computing Laboratory, Department of Technology of Computers and Communications, Escuela Politica, University of Extremadura, Cres, Spain. Her research interests include hyperspectral image classification and segmentation, spectral unmixing, signal processing, and remote sensing. Dr. Li has been a Reviewer of several journals, including the IEEE T RANS ACTIONS ON G EOSCIENCE AND R EMOTE S ENSING , the IEEE G EOSCIENCE AND R EMOTE S ENSING L ETTERS , Pattern Recognition, Optical Engineering, Journal of Applied Remote Sensing, and Inverse Problems and Imaging. She was a recipient of the 2012 Best Reviewer Award of the IEEE J OURNAL OF S ELECTED T OPICS IN A PPLIED E ARTH O BSERVATIONS AND R EMOTE S ENSING.
Xin Huang (M’13–SM’14) received the Ph.D. degree in photogrammetry and remote sensing in 2009 from Wuhan University, Wuhan, China, working with the State Key Laboratory of Information Engineering in Surveying, Mapping and Remote Sensing (LIESMARS). He is currently a Full Professor with LIESMARS, Wuhan University. He has published more than 45 peer-reviewed articles in the international journals. His research interests include hyperspectral data analysis, high-resolution image processing, pattern recognition, and remote sensing applications. Dr. Huang was the recipient of the Top-Ten Academic Star of Wuhan University in 2009; the Boeing Award for the Best Paper in Image Analysis and Interpretation from the American Society for Photogrammetry and Remote Sensing in 2010, the New Century Excellent Talents in University from the Ministry of Education of China in 2011, and the National Excellent Doctoral Dissertation Award of China in 2012. In 2011, he was recognized by the IEEE Geoscience and Remote Sensing Society (GRSS) as the Best Reviewer of IEEE G EOSCIENCE AND R EMOTE S ENSING L ETTERS. He was the winner of the IEEE GRSS 2014 Data Fusion Contest. Since 2014, he serves as an Associate Editor of the IEEE G EOSCIENCE AND R EMOTE S ENSING L ETTERS. He has frequently served as a referee of many international journals for remote sensing.
Paolo Gamba (SM’00–F’13) received the Laurea (cum laude) and Ph.D. degrees in electronic engineering from the University of Pavia, Pavia, Italy, in 1989 and 1993, respectively. He is an Associate Professor of telecommunications with the University of Pavia, where he also leads the Telecommunications and Remote Sensing Laboratory. He has been invited to give keynote lectures and tutorials in several occasions about urban remote sensing, data fusion, EO data and risk management. He published more than 100 papers in international peer-review journals and presented more than 250 research works in workshops and conferences. Dr. Gamba served as the Editor-in-Chief of the IEEE G EOSCIENCE AND R EMOTE S ENSING L ETTERS, from 2009 to 2013, and as the Chair of the Data Fusion Committee of the IEEE Geoscience and Remote Sensing Society (GRSS), from October 2005 to May 2009. He is currently the Chair of the Chapters’ Committee of IEEE GRSS. He has been the Organizer and Technical Chair of the biennial GRSS/ISPRS Joint Workshops on “Remote Sensing and Data Fusion over Urban Areas” since 2001. He also served as a Technical Cochair of the 2010 IEEE Geoscience and Remote Sensing Symposium,
1605
Honolulu, Hawaii, July 2010, and he will serve as a Technical Cochair of the 2015 IEEE Geoscience and Remote Sensing Symposium, in Milan, Italy. He has been the Guest Editor of special issues of IEEE T RANSACTIONS ON G EOSCIENCE AND R EMOTE S ENSING , IEEE J OURNAL OF S ELECTED T OPICS IN R EMOTE S ENSING A PPLICATIONS, ISPRS Journal of Photogrammetry and Remote Sensing, International Journal of Information Fusion, and Pattern Recognition Letters on the topics of Urban Remote Sensing, Remote Sensing for Disaster Management, and Pattern Recognition in Remote Sensing Applications.
José M. Bioucas-Dias (S’87–M’95) received the EE, M.Sc., Ph.D., and “Agregado” degrees from the Instituto Superior Tico (IST), the engineering school of the Technical University of Lisbon (TULisbon), Portugal, in 1985, 1991, 1995, and 2007, respectively, all in electrical and computer engineering. Since 1995, he has been with the Department of Electrical and Computer Engineering, IST, where he was an Assistant Professor from 1995 to 2007 and an Associate Professor since 2007. Since 1993, he is also a Senior Researcher with the Pattern and Image Analysis Group of the Instituto de Telecomunicaçs, which is a private non-profit research institution. His research interests include inverse problems, signal and image processing, pattern recognition, optimization, and remote sensing. Dr. Bioucas-Dias was an Associate Editor of the IEEE T RANSACTIONS ON C IRCUITS AND S YSTEMS (1997–2000), and he is an Associate Editor of the IEEE T RANSACTIONS ON I MAGE P ROCESSING and IEEE T RANSACTIONS ON G EOSCIENCE AND R EMOTE S ENSING . He was a Guest Editor of IEEE T RANSACTIONS ON G EOSCIENCE AND R EMOTE S ENSING for the Special Issue on Spectral Unmixing of Remotely Sensed Data and of the IEEE J OURNAL OF S ELECTED T OPICS IN A PPLIED E ARTH O BSERVATIONS AND R EMOTE S ENSING for the Special Issue on Hyperspectral Image and Signal Processing, and he is a Guest Editor of IEEE S IGNAL P ROCESSING M AGAZINE for the Special Issue on Signal and Image Processing in Hyperspectral Remote Sensing. He was the General Cochair of the 3rd IEEE GRSS Workshop on Hyperspectral Image and Signal Processing, Evolution in Remote Sensing (WHISPERS’2011) and has been a member of program/technical committees of several international conferences.
Liangpei Zhang (M’06–SM’08) received the B.S. degree in physics from Hunan Normal University, Changsha, China, in 1982, the M.S. degree in optics from the Chinese Academy of Sciences, Xi’an, China, in 1988, and the Ph.D. degree in photogrammetry and remote sensing from Wuhan University, Wuhan, China, in 1998. He is currently the Head of the Remote Sensing Division, State Key Laboratory of Information Engineering in Surveying, Mapping and Remote Sensing, Wuhan University. He is also a Chang-Jiang Scholar Chair Professor appointed by the Ministry of Education of China. He is currently a Principal Scientist with the China State Key Basic Research Project (2011–2016) appointed by the Ministry of National Science and Technology of China to lead the remote sensing program in China. He has more than 300 research papers. He is the holder of five patents. His research interests include hyperspectral remote sensing, high-resolution remote sensing, image processing, and artificial intelligence. Dr. Zhang is a Fellow of the Institution of Engineering and Technology, an Executive Member (Board of Governor) of the China National Committee of the International Geosphere-Biosphere Programme, and an Executive Member of the China Society of Image and Graphics. He regularly serves as a Cochair of the series SPIE Conferences on Multispectral Image Processing and Pattern Recognition, Conference on Asia Remote Sensing, and many other conferences. He edits several conference proceedings, issues, and Geoinformatics symposiums. He also serves as an Associate Editor of the International Journal of Ambient Computing and Intelligence, the International Journal of Image and Graphics, the International Journal of Digital Multimedia Broadcasting, the Journal of Geo-spatial Information Science, the Journal of Remote Sensing, and the IEEE T RANSACTIONS ON G EOSCIENCE AND R EMOTE S ENSING.
1606
IEEE TRANSACTIONS ON GEOSCIENCE AND REMOTE SENSING, VOL. 53, NO. 3, MARCH 2015
Jón Atli Benediktsson (F’04) received the Cand.Sci. degree in electrical engineering from the University of Iceland, Reykjavik, Iceland, in 1984 and the M.S.E.E. and Ph.D. degrees from Purdue University, West Lafayette, IN, USA, in 1987 and 1990, respectively. He is currently a Pro Rector for Academic Affairs and Professor of electrical and computer engineering at the University of Iceland. He is a cofounder of the biomedical start up company Oxymap (www.oxymap.com). His research interests are in remote sensing, biomedical analysis of signals, pattern recognition, image processing, and signal processing, and he has published extensively in those fields. Prof. Benediktsson was the 2011–2012 President of the IEEE Geoscience and Remote Sensing Society (GRSS) and has been on the GRSS AdCom since 2000. He was Editor-in-Chief of the IEEE T RANSACTIONS ON G EOSCIENCE AND R EMOTE S ENSING (TGRS) from 2003 to 2008, and he has served as an Associate Editor of TGRS since 1999, the IEEE G EOSCIENCE AND R EMOTE S ENSING L ETTERS since 2003, and IEEE Access since 2013. He is on the editorial board of P ROCEEDINGS OF THE IEEE and a member of the International Editorial Board of the International Journal of Image and Data Fusion, and he was the Chairman of the Steering Committee of IEEE J OURNAL OF S ELECTED T OPICS IN A PPLIED E ARTH O BSERVATIONS AND R EMOTE S ENSING (J-STARS) in 2007–2010. He is a Fellow of SPIE. He received the Stevan J. Kristof Award from Purdue University in 1991, as an outstanding graduate student in remote sensing. In 1997, he was the recipient of the Icelandic Research Council’s Outstanding Young Researcher Award; in 2000, he was granted the IEEE Third Millennium Medal; in 2004, he was a corecipient of the University of Iceland’s Technology Innovation Award; in 2006 he received the Yearly Research Award from the Engineering Research Institute of the University of Iceland; and in 2007, he received the Outstanding Service Award from the IEEE Geoscience and Remote Sensing Society (GRSS). He was a corecipient of the 2012 IEEE T RANSACTIONS ON G EOSCIENCE AND R EMOTE S ENSING Paper Award, and in 2013, he was a corecipient of the IEEE GRSS Highest Impact Paper Award. In 2013, he received the IEEE/VFI Electrical Engineer of the Year Award. He is a member of the Association of Chartered Engineers in Iceland (VFI), Societas Scinetiarum Islandica, and Tau Beta Pi.
Antonio Plaza (M’05–SM’07) was born in Cáceres, Spain, in 1975. He received the M.S. and Ph.D. degrees in computer engineering from the University of Extremadura, Cáceres. He is an Associate Professor (with accreditation for Full Professor) with the Department of Technology of Computers and Communications, University of Extremadura, Cáceres, Spain, where he is the Head of the Hyperspectral Computing Laboratory (HyperComp). He was the Coordinator of the Hyperspectral Imaging Network. He authored more than 400 publications, including 119 Journal Citation Reports (JCR) journal papers (71 in IEEE journals), 20 book chapters, and over 240 peer-reviewed conference proceeding papers (94 in IEEE conferences). Mr. Plaza has guest edited seven special issues on JCR journals (three in IEEE journals). He has been a Chair for the IEEE Workshop on Hyperspectral Image and Signal Processing: Evolution in Remote Sensing (2011). He is a recipient of the recognition of Best Reviewers of the IEEE G EOSCIENCE AND R EMOTE S ENSING L ETTERS (in 2009) and a recipient of the recognition of Best Reviewers of the IEEE T RANSACTIONS ON G EOSCIENCE AND R EMOTE S ENSING (in 2010), a journal for which he has served as Associate Editor in 2007–2012. He also serves as an Associate Editor for IEEE Access, and he was a member of the Editorial Board of the IEEE G EOSCIENCE AND R EMOTE S ENSING N EWSLETTER (2011–2012) and the IEEE G EOSCIENCE AND R EMOTE S ENSING M AGAZINE (2013). He was also a member of the steering committee of the IEEE J OURNAL OF S ELECTED T OPICS IN A PPLIED E ARTH O BSERVATIONS AND R EMOTE S ENSING (2012). He served as the Director of Education Activities for the IEEE Geoscience and Remote Sensing Society (GRSS) in 2011–2012, and he is currently serving as the President of the Spanish Chapter of IEEE GRSS (since November 2012). He is currently serving as the Editor-in-Chief of the IEEE T RANSACTIONS ON G EOSCIENCE AND R EMOTE S ENSING J OURNAL (since January 2013).