symbols in a specific manner such that a signature can be ... provided by hyperspectral imagery to accomplish tasks such as ... file for signature characterization.
Optical Engineering 45共9兲, 097002 共September 2006兲
Progressive coding for hyperspectral signature characterization Chein-I Chang, FELLOW SPIE University of Maryland Baltimore County Department of Computer Science and Electrical Engineering Remote Sensing Signal and Image Processing Laboratory Baltimore, Maryland 21250 and National Chung Hsing University Department of Electrical Engineering Taichung, Taiwan, Republic of China
Jing Wang, MEMBER SPIE University of Maryland Baltimore County Department of Computer Science and Electrical Engineering Remote Sensing Signal and Image Processing Laboratory Baltimore, Maryland 21250
Abstract. Spectral signature coding is an effective means of characterizing spectral features. This paper develops a rather different encoding concept, called progressive signature coding 共PSC兲, which encodes a signature in a hierarchical manner. More specifically, it progressively encodes a spectral signature in multiple stages; each of these stages captures disjoint spectral information contained in the spectral signature. As a result of this progressive coding, a spectral profile of progressive changes in a spectral signature can be generated for spectral characterization. The proposed idea is very simple and evolved from the pulse code modulation 共PCM兲 commonly used in communications and signal processing. It expands PCM to multistage PCM 共MPCM兲 in the sense that a signature can be decomposed and quantized by PCM progressively in multiple stages for spectral characterization. In doing so, the MPCM generates a priority code for a spectral signature so that its spectral information captured in different stages can be prioritized in accordance with significance of changes in spectral variation. Such MPCMbased progressive spectral signature coding 共MPCM-PSSC兲 can be useful in applications such as hyperspectral data exploitation, environmental monitoring, and chemical/biological agent detection. Experiments are provided to demonstrate the utility of the MPCM-PSSC in signature discrimination and identification. © 2006 Society of Photo-Optical Instrumentation
Engineers. 关DOI: 10.1117/1.2353113兴
Chein-Chi Chang University of Maryland Baltimore Country Department of Civil and Environmental Engineering Baltimore, Maryland 21250
Subject terms: multistage pulse code modulation 共MPCM兲; MPCM-based progressive spectral signature coding 共MPCM-PSSC兲; progressive spectral signature coding 共PSSC兲; spectral signature coding 共SSC兲; spectral discrimination; spectral identification. Paper 050881R received Nov. 6, 2005; revised manuscript received Feb. 8, 2006; accepted for publication Feb. 17, 2006; published online Sep. 27, 2006.
Chinsu Lin National Chiayi University Department of Forestry Environment Monitoring and Planning Laboratory 300 University Road Chiayi 600 Taiwan, Republic of China
1
Introduction
Spectral signature coding 共SSC兲 is a scheme or a rule or a mapping that transforms spectral values into a new set of symbols in a specific manner such that a signature can be represented by the new symbols more effectively or efficiently. In hyperspectral imagery, each pixel is acquired by hundreds of contiguous spectral channels to form a column vector that can be used to diagnose subtle material substances based on their spectral characteristics. Therefore, taking advantage of such intrapixel spectral information 共e.g., spectral information provided by spectral channels within a hyperspectral image pixel vector兲 is one of great benefits resulting from hyperspectral data. However, this comes at the price that many unknown spectral signatures may be also extracted to further complicate spectral analysis. So, one of major challenges in hyperspectral data exploitation is how to best utilize the spectral information 0091-3286/2006/$22.00 © 2006 SPIE
Optical Engineering
provided by hyperspectral imagery to accomplish tasks such as detection, discrimination, classification, and identification while discarding undesired information caused by unwanted interference such as noise. This paper investigates a new approach to SSC, called progressive spectral signature coding 共PSSC兲, where the SSC is carried out in a progressive fashion rather than as sequential coding. It is a technique that can decompose a signature in multiple stages, each of which captures spectral changes in a progressive manner.1–3 As a consequence, it provides a profile of progressive changes in spectral variation that describes the spectral behavior of a pixel vector in various stages. Accordingly, we can consider PSSC as soft coding in a progressive procedure, as opposed to SSC, which can be viewed as hard coding performed by classical coding techniques with binary decisions. This paper develops a technique, called multistage pulse code modulation 共MPCM兲 for PSSC 共MPCM-PSSC兲, which was previously developed for progressive image compression.4 The success of MPCM has been also dem-
097002-1
September 2006/Vol. 45共9兲
Chang et al.: Progressive coding for hyperspectral signature characterization
onstrated in image progressive reconstruction,5,6 progressive edge detection7,8 and progressive text detection.9 It is in fact a one-dimensional 共1-D兲 transform coding technique, which encodes a 1-D signal progressively according to a priority assigned to each signal point. The signal priorities are determined by changes between two successive signal points. Interestingly, a hyperspectral image pixel can be also considered as a 1-D signal function.10,11 As a consequence, each signal point corresponds to the spectral value of a particular wavelength in spectral dimension. With this interpretation, the MPCM can be implemented to capture progressive changes of spectral variation occurring at spectral wavelengths that are used to acquire the pixel. One major advantage of using the PSSC is characterization of a spectral signature in progressive changes across its spectral channels. This unique feature cannot be accomplished by any hard-coding-based spectral coding methods. Another advantage is that the spectral profile of progressive changes produced for a signature can be used for various applications such as discrimination, classification, or identification. It is often the case that two signatures are very similar in the spectral signature vector direction measured by a spectral angle mapper 共SAM兲,11,12 but in fact have very different spectral profiles of progressive changes in a range of spectral channels. The PSSC provides such a profile for signature characterization. A third advantage is its use for change detection, which is a major task in landcover remote sensing image classification and has been generally performed by temporal processing. The PSSC offers a different perspective on change detection in terms of spectral variation. A fourth advantage is that it can be viewed as a progressive implementation of a sequence of binary coding with a set of decreasing thresholds. The proposed MPCM-PSSC provides a new look at how a SSC can be accomplished progressively for signature characterization. The idea is derived from the success of the MPCM in text detection for video images,9 where the edges of text were detected more effectively in a progressive manner. Such progressive edge detection seems to be very useful in hyperspectral signature characterization. It generates a priority code that keeps track of progressive changes in spectral variation. The larger the change in a spectral wavelength is, the higher the priority of this particular wavelength is. Such an MPCM-PSSC-generated priority code provides fingerprints of a spectral signature via priority code words assigned to each of spectral wavelengths. Here, the term “code” refers to a codebook, which is made up of code words that are used for encoding. Another important advantage resulting from the MPCM-PSSCgenerated priority code is progressive decomposition of a spectral signature in accordance with the priority code words assigned to each spectral wavelength. The resulting progressive decomposition delineates a profile of progressive changes in spectral variation that can be used for discrimination and identification of a spectral signature, a feature that cannot be achieved by any spectral similarity measure. Furthermore, the MPCM-PSSC-generated priority code can progressively reconstruct a spectral signature simply by the priority code words assigned to spectral wavelengths. This progressive signature reconstruction enables one to see how spectral changes are updated in order to recover the original signature from the MPCM-generated Optical Engineering
priority code. Most importantly, the MPCM-PSSC priority code can describe progressive transitions of spectral values from one spectral band to another via a simple coding scheme with a detailed profile of a spectral signature in terms of progressive changes in spectral variation across spectral wavelengths. Such capability makes the MPCMPSSC unique. It distinguishes the MPCM-PSSC from a spectral similarity measure, which can only measure the closeness or similarity between two spectral signatures, not progressive spectral signature similarity across spectral wavelengths. In order to facilitate analysis, a distinction between discrimination and identification, suggested in Ref. 11, is also made clear in this paper. The former is performed among a set of signatures, so that one signature is discerned from another, whereas the latter is performed by verifying a signature via a database 共spectral library兲. Consequently, algorithms designed for discrimination and identification are slightly different. In particular, a threshold is generally required for signature discrimination to discriminate one signature from another. On the other hand, signature identification via a database can be performed directly by finding the signature in the database that best matches the signature to be identified. In our proposed MPCM-PSSC, the signature discrimination and signature matching are measured by priority code words using the Hamming distance. Finally, computer simulations and real data experiments are conducted to demonstrate the utility of the MPCM-PSSC in applications of signature discrimination and identification. The remainder of this paper is organized as follows. Section 2 describes the MPCM encoding scheme in detail. Section 3 presents an MPCM-based progressive spectral signature coding 共MPCM-PSSC兲 and develops algorithms for discrimination and identification. Section 4 conducts extensive experiments to substantiate the proposed MPCMPSSC. Section 5 summarizes the results and conclusions with some remarks. 2 Multistage Pulse Code Modulation In this section, we present a new concept, called multistage pulse coding modulation 共MPCM兲, that can be used for encoding spectral signatures in a progressive manner. MPCM was originally developed for image progressive transmission and reconstruction.4–6 It can be viewed as a progressive version of a commonly used coding scheme in communications, pulse code modulation 共PCM兲.13 It expands the hard-decision PCM-based quantizer to a softdecision quantizer in such a fashion that it allows PCM to have a nondecision region, which passes on its decisions progressively to the next stage. As a result, a decision can be refined stage by stage so as to improve the quantization results. The idea of multistage coding is not new and can be found in Ref. 13, in which many references are available, such as to tree or residual coding,2,3,13,14 and multiresolution decomposition.15 Nevertheless, the MPCM is new and quite different from the reported references in that it makes use of priority code words derived from multiple stages for progressive coding. The detailed idea of the MPCM can be described as follows. A PCM-based coder is a quantizer, denoted by Q共x兲, M which is specified by a set of quantization levels 兵⌬k其k=1
097002-2
September 2006/Vol. 45共9兲
Chang et al.: Progressive coding for hyperspectral signature characterization
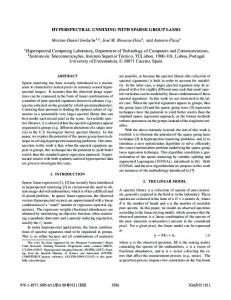
Fig. 2 Case 1 for MPCM encoding algorithm.
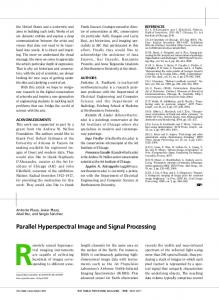
Fig. 1 A soft quantizer Qk共x共n兲兲 described by Eq. 共2兲.
M and a corresponding set of quantization thresholds 兵k其k=1 . It quantizes a signal function x共n兲 according to
Q共x共n兲兲 = ⌬k
if x共n兲 苸 关k−1, k兲,
共1兲
where ⌬0 and ⌬ M are initial conditions determined by the domain of the signal function x共n兲. It is a hard-decisionbased quantizer, referred to as a hard quantization, because Q共x共n兲兲 must make a decision on the input x共n兲 via Eq. 共1兲 by assigning the quantization level ⌬k to x共n兲. The proposed MPCM expands Q共x兲 in the sense that x共n兲 in Eq. 共1兲 is encoded by a sequence of M soft-decision-based quanM in multiple stages, referred to as soft tizers 兵Qk共x共n兲兲其k=1 quantizers, in a progressive manner, as opposed to the hard decision made by one single value ⌬k in Eq. 共1兲. Unlike the hard-decision-based quantizer described in Eq. 共1兲, which makes its binary decision on x共n兲 by means of a single threshold interval 关k−1 , k兲 for each quantization level ⌬k, Qk共x共n兲兲 makes its decision based on three threshold intervals, 共−⬁ , −⌬k兴, 共−⌬k , ⌬k兲, and 关⌬k , ⬁兲, determined by its quantization level ⌬k, where the interval 共−⌬k , ⌬k兲 is designated as a no-decision threshold interval. More specifically, a soft quantizer Qk共x共n兲兲 derived from Q共x共n兲兲 via the k’th quantization level ⌬k is defined by
冦
− ⌬k if x共n兲 苸 共− ⬁,− ⌬k兴,
Qk共x共n兲兲 = x共n兲 if x共n兲 苸 共− ⌬k,⌬k兲, if x共n兲 苸 关⌬k,⬁兲, ⌬k
冧
共2兲
where the soft quantizer Qk共x共n兲兲 passes its input x共n兲 without making any decision when the input x共n兲 falls in the region x共n兲 苸 共−⌬k , ⌬k兲 as described in Fig. 1. The consequence of soft decisions comes from the inclusion of the no-decision interval 共−⌬k , ⌬k兲 in the quantizer Qk共x共n兲兲. The MPCM takes advantage of the soft quantizer Qk共x共n兲兲 specified by Eq. 共2兲 to perform quantization proM gressively in multiple stages specified by 兵⌬k其k=1 , referred M are to as stage levels in the MPCM. Assume that 兵⌬k其k=1 strictly decreasing quantization levels, i.e., ⌬1 ⬎ ⌬2 ⬎ ¯ ⬎ ⌬ M ⬎ 0. Therefore, the no-decision-made outputs passed by the k’th soft quantizer Qk共x共n兲兲 at stage k are further processed by the follow-up 共k + 1兲st soft quantizer Qk+1共x共n兲兲 in the next stage, which uses a smaller quantization level, ⌬k+1 ⬍ ⌬k to refine its decision. In other words, instead of encoding x共n兲 directly into ⌬k by Eq. 共1兲, x共n兲 is M actually encoded by M soft quantizers 兵Qk共x共n兲兲其k=1 one at a time, progressively using M refined quantization levels. Optical Engineering
As a result of using a sequence of progressive soft quantizM ers 兵Qk共x共n兲兲其k=1 , x共n兲 can be decomposed into a set of M binary-valued stage components, denoted by 兵xˆk共n兲其k=1 where xˆk共n兲 苸 兵0 , 1其 for 1 艋 k 艋 M, so that the x共n兲 can be approximated by the estimate xˆ共n兲 of x共n兲 given by M
xˆ共n兲 = xˆ1⌬1 + xˆ2⌬2 + ¯ + xˆ M ⌬ M = 兺 xˆk共n兲⌬k .
共3兲
k=1
The key task is to find the desired set of M soft binary M for a given set of quantization levquantizers, 兵Qk共x共n兲兲其k=1 M els 兵⌬k其k=1 to produce an optimal M-block-length binary code for Eq. 共3兲 in approximation. In doing so, the soft quantizer using the quantization level ⌬k defined by Eq. 共2兲 can be used for the k’th progressive soft quantizer in the MPCM defined by
冦
− ⌬k
if k−1共n兲 苸 共− ⬁,− ⌬k兴,
Qk共k−1共n兲兲 = k−1共n兲 if k−1共n兲 苸 共− ⌬k,⌬k兲, if k−1共n兲 苸 关⌬k,⬁兲, ⌬k
冧
共4兲
which takes as its input the approximation error k−1共n兲 ˆ j共n兲⌬ j obtained at the 共k − 1兲st stage. It should = x共n兲 − 兺k−1 j=1 x be noted that k−1共n兲 used in Eq. 共4兲 is the approximation error obtained by successive approximations using the binary code word 共xˆ1共n兲xˆ2共n兲 ¯ xˆ M 共n兲兲 up to the 共k − 1兲st stage. The soft decision comes from the case that if k−1共n兲 苸 共−⌬k , ⌬k兲, then Qk共k−1共n兲兲 = k−1共n兲. A detailed implementation of the MPCM is described as follows. A generalized version of MPCM can be found in Refs. 4–6. MPCM encoding algorithm for the n’th signal point x共n兲.
097002-3
M 1. Initial condition: Let 兵⌬k其k=1 be a set of M stage levels that are used for MPCM, and the initial approximation error be 0共n兲 = x共n兲 − xˆ共n − 1兲, where xˆ共n − 1兲 is obtained by Eq. 共3兲. Set xˆ共0兲 = 0 and k = 1. 2. At the k’th stage, three cases are considered for the k’th two-valued soft quantizer Qk defined by Eq. 共4兲:
Case 1. If k−1共n兲 艌 ⌬k, then Qk共k−1共n兲兲 = ⌬k, xˆk共n兲 = 1; set xˆ j共n兲 = 0 for k ⬍ j 艋 M. In this case, the priority code word c共n兲 assigned to x共n兲 is c共n兲 = k. Its diagram is depicted in Fig. 2. September 2006/Vol. 45共9兲
Chang et al.: Progressive coding for hyperspectral signature characterization
Fig. 3 Case 2 for MPCM encoding algorithm.
ˆ j共n兲⌬ j = k−1共n兲 Let M 共n兲 = k−1共n兲 − 兺 M j=kx − ⌬k. Go to step 4. Case 2. If k−1共n兲 艋 −⌬k, then Qk共k−1共n兲兲 = −⌬k, xˆk共n兲 = 0; set xˆ j共n兲 = 1 for k ⬍ j 艋 M. In this case, the priority code word c共n兲 assigned to x共n兲 is c共n兲 = k. Its diagram is depicted in ˆ j共n兲⌬ j Fig. 3. Let M 共n兲 = k−1共n兲 − 兺 M j=kx M = k−1共n兲 − 兺 j=k+1⌬k. Go to step 4. Case 3. If −⌬k ⬍ k−1共n兲 ⬍ ⌬k, then Qk共k−1共n兲兲 = k−1共n兲 and xˆk共n兲 = xˆk共n − 1兲. Its diagram is depicted in Fig. 4. Go to step 3.
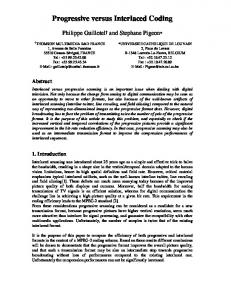
Fig. 5 Spectral signature of methyl salicylate, r.
stage by stage in M stages, the MPCM decoding algorithm reconstructs the n’th signal samples stage by stage according to its priority code word c共n兲. MPCM decoding algorithm for x共n兲. M be a set of M stage lev1. Initial condition: Let 兵⌬k其k=1 els that are used for MPCM. Set the initial condition as xˆ共0兲 = 0, and let xˆ共n − 1兲 be the reconstruction of x共n兲, which is unknown and can be expressed by M as 兵xˆk共n − 1兲其k=1
3. If k ⬍ M, let k = k + 1 and go to step 2. Otherwise, continue. 4. Go to the next sample, 共n + 1兲st signal point, x共n + 1兲.
xˆ共n − 1兲 = xˆ1共n − 1兲⌬1 + xˆ2共n − 1兲⌬2
In this MPCM encoding algorithm, the priority code word is only assigned when a hard decision is made in a certain stage. When it occurs at stage k, the encoding for x共n兲 is terminated and the priority code word for x共n兲 is encoded as c共n兲 = k. In this case, the priority assigned to x共n兲 is k, which indicates that there is a significant change in x共n兲 at stage k. As a result, the higher the priority is, the greater the change is, and the smaller the index number of the stage is. That is, c共n兲 = 1 has the highest priority, since there is a drastic change in stage 1 specified by the largest quantization level ⌬1. To the contrary, c共n兲 = M indicates that there only has been a small change in stage M, because the quantization level ⌬M is the smallest one. Interestingly, an immediate advantage resulting from the MPCM encoding algorithm is that it allows one to decompose a signal sample x共n兲 in multiple stages, viz., M stages, and its priority code word indicates in which stage the priority occurs—where the signal sample makes a significant change. Correspondingly, we also describe the MPCM decoding algorithm as follows. It decodes the n’th signal sample x共n兲 according to the encoded priority code word c共n兲 along with the previous decoded xˆ共n − 1兲, which is an approximation of x共n − 1兲 via Eq. 共3兲. In contrast to the MPCM encoding algorithm, which decomposes the n’th signal sample
Fig. 4 Case 3 for MPCM encoding algorithm.
Optical Engineering
+ ¯ + xˆ M 共n − 1兲⌬ M .
共5兲
2. Input the encoded priority code word c共n兲 = k for x共n兲, in which case the priority of x共n兲 occurs in stage k. Two cases are considered. Case 1. If xˆk共n − 1兲 = 1, then xˆ j共n兲 = xˆ j共n − 1兲 for 1 艋 j ⬍ k, xˆk共n兲 = 0, and xˆ j共n兲 = 1 for k ⬍ j ˆ j共n − 1兲⌬ j ⬍ M. In this case, xˆ共n兲 = 兺k−1 j=1 x + 兺M ⌬ . j=k+1 j Case 2. If xˆk共n − 1兲 = 0, then xˆ j共n兲 = xˆ j共n − 1兲 for 1 艋 j ⬍ k, xˆk共n兲 = 1, and xˆ j共n兲 = 0 for k ⬍ j ˆ j共n − 1兲⌬ j ⬍ M. In this case, xˆ共n兲 = 兺k−1 j=1 x + ⌬ k.
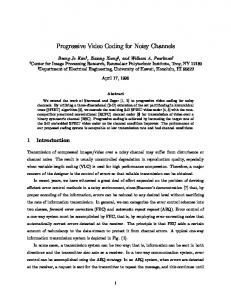
Fig. 6 Graphical plot of priority code words for the signature of methyl salicylate in Fig. 5. x-coordinates: band numbers; y-coordinates: priority code words.
097002-4
September 2006/Vol. 45共9兲
Chang et al.: Progressive coding for hyperspectral signature characterization
Fig. 7 MPCM-encoded progressive spectral signatures of methyl salicylate. x-coordinates: band numbers; y-coordinates: priority code words.
In order to apply the MPCM to spectral signature coding, we consider the spectrum of a signature vector r = 共r1 , r2 , . . . , rL兲T as a 1-D signature vector with rl the spectral value of the l’th band. Let ⌬共r兲 = maxl兵rl其 − minl兵rl其. The number of stages, M, is then given by M = 关log2 ⌬共r兲兴 + 1
共6兲
with 关x兴 defined as the largest integer less than or equal to M used in the MPCM are dex. So, the stage levels 兵⌬k其k=1 fined by ⌬k共r兲 = 2−k⌬共r兲
for k = 1,2, . . . ,M .
共7兲
In order to demonstrate the utility of the MPCM in spectral signature coding, two examples are provided for illustration. The first example shows a progressive MPCM-encoded signal of a 1-D chemical spectral data vector r, methyl salicylate, obtained from the Web book of the National Institute of Standards and Technology 共NIST兲.16 It is shown in Fig. 5 and has 880 bands of spectral coverage from 450 to 3966 cm−1. In order for the MPCM to operate on this signal, the number of stages required for the MPCM encoding was calculated by Eq. 共6兲 to be M = 13 stages. Since there are 13 stages, the stage levels obtained by Eq. 共7兲 are ⌬k = ⌬共r兲 / 2k for k = 1 , 2 , . . . , 13. The initial condition is assumed to be x共0兲 = 0. Figure 6 shows a graphical plot of the priority code words c共n兲 for each of signal points x共n兲 in Fig. 5 produced by the MPCM encoding algorithm with the x axis and y axis specified by signal points and their corresponding priority code words ranging from 1 to 13. Using the MPCM encoded priority code words provided by Fig. 6, a 13-stage progressive decomposition into signal components of the original signal in Fig. 5 can be obtained as in Fig. 7. As we can see from Fig. 7, the MPCM encoding Optical Engineering
algorithm started with the highest stage level, ⌬1 = 共213 / 2兲 ⫻兵⌬共r兲 / 213其 = 4096⫻ 兵⌬共r兲 / 213其, in stage 1, and then reduced stage levels by factors of 2 to refine signal samples until it reached the last stage, which is stage 13 specified by stage level ⌬13 = ⌬共r兲 / 213. In order to decode the signal of methyl salicylate, the MPCM-encoded priority code words in Fig. 6 were used as inputs, and Fig. 8 shows the 13 decoded signal components of methyl salicylate for stage-by-stage signature reconstruction along with the approximation error 13共n兲. Since it may not be trivial to fully understand how the MPCM works, a second example is provided by Table 1 for illustration. It takes the first 20 signal points in Fig. 5 and walks through detailed stage-by-stage implementations of the MPCM encoding and decoding algorithms. In Table 1, the first set of columns lists the inputs speci20 with the initial fied by the first 20 signal points 兵x共n兲其n=1
Fig. 8 Stage-by-stage decoded spectral signatures of methyl salicylate from the priority code words in Fig. 6, along with the approximation error 13共n兲. x-coordinates: band numbers; y-coordinates: priority code words.
097002-5
September 2006/Vol. 45共9兲
Chang et al.: Progressive coding for hyperspectral signature characterization Table 1 The first 20 MPCM-encoded signal samples in Fig. 5, using 13 stages for signal decomposition. Input
Prediction
Signal components
xˆ共n兲
共n兲
xˆ1
xˆ2
xˆ3
xˆ4
xˆ5
xˆ6
xˆ7
xˆ8
xˆ9
xˆ10
xˆ11
xˆ12
xˆ13
Output c共n兲
0
0
0
0
0
0
0
0
0
0
0
0
0
0
0
0
367
256
111
0
0
0
0
1
0
0
0
0
0
0
0
0
5
2
144
255
−111
0
0
0
0
0
1
1
1
1
1
1
1
1
5
3
33
127
−94
0
0
0
0
0
0
1
1
1
1
1
1
1
6
4
108
111
−3
0
0
0
0
0
0
1
1
0
1
1
1
1
9
5
70
95
−25
0
0
0
0
0
0
1
0
1
1
1
1
1
8
6
106
96
10
0
0
0
0
0
0
1
1
0
0
0
0
0
8
7
59
63
−4
0
0
0
0
0
0
0
1
1
1
1
1
1
7
8
119
64
55
0
0
0
0
0
0
1
0
0
0
0
0
0
7
9
157
128
29
0
0
0
0
0
1
0
0
0
0
0
0
0
6
10
162
160
2
0
0
0
0
0
1
0
1
0
0
0
0
0
8
11
198
192
6
0
0
0
0
0
1
1
0
0
0
0
0
0
7
12
233
224
9
0
0
0
0
0
1
1
1
0
0
0
0
0
8
13
240
240
0
0
0
0
0
0
1
1
1
1
0
0
0
0
9
14
223
223
0
0
0
0
0
0
1
1
0
1
1
1
1
1
8
15
245
224
21
0
0
0
0
0
1
1
1
0
0
0
0
0
8
16
290
256
34
0
0
0
0
1
0
0
0
0
0
0
0
0
5
17
388
384
4
0
0
0
0
1
1
0
0
0
0
0
0
0
6
18
516
512
4
0
0
0
1
0
0
0
0
0
0
0
0
0
4
19
591
576
15
0
0
0
1
0
0
1
0
0
0
0
0
0
7
20
665
640
25
0
0
0
1
0
1
0
0
0
0
0
0
0
6
n
x共n兲
0
0
1
condition specified by x共0兲 = 0. The second set lists the values of predicted xˆ共n兲 and predicted error 共n兲. The third set lists all predicted values of signal components in 13 stages with stage levels specified by the largest stage level, ⌬1 = 212 = 4096, down to the smallest stage level, ⌬13 = 20 = 1. Finally, the last column lists the priority code words 20 20 for the first 20 signal points, 兵x共n兲其n=1 . 兵c共n兲其n=1 Table 2 provides a stage-by-stage decoding process for signal reconstruction of the 20 MPCM signal samples encoded in Table 1, where the first set of columns takes the priority code words from the output in Table 1 as the input to the MPCM decoder to decode the signal components in all 13 stages in the second set of columns. Finally, the last column of Table 2 lists the predicted values of all the first 20 . 20 signal points of 兵x共n兲其n=1 To conclude this section, two comments are noteworthy. Optical Engineering
In order to implement the MPCM-PSSC, a set of paramM eters, such as the stage levels 兵⌬k其k=1 , is required a priori. A general approach to such selection is given by Eq. 共7兲, which is empirically reasonable in our experiments. Another comment is that the computational complexity of the MPCM-PSSC is simple. As a matter of fact, it can be implemented as a real-time process for progressive transmission. 3
MPCM-Based Progresssive Spectral Signature Coding As recalled in the MPCM encoding algorithm, a signature vector r = 共r1 , r2 , . . . , rL兲T will be considered as a 1-D spectral signature where rl is represented by one of the priority M with ck共r兲 taking values in code words 兵ck共r兲其k=1 兵1 , 2 , . . . , M其. For example, cl共r兲 indicates the priority of rl
097002-6
September 2006/Vol. 45共9兲
Chang et al.: Progressive coding for hyperspectral signature characterization Table 2 The first 20 MPCM decoded signal points for the signal reconstruction in Fig. 5 with 13 stages. Input
Signal components Output xˆ共n兲
n
c共n兲
xˆ1
xˆ2
xˆ3
xˆ4
xˆ5
xˆ6
xˆ7
xˆ8
xˆ9
xˆ10
xˆ11
xˆ12
xˆ13
0
0
0
0
0
0
0
0
0
0
0
0
0
0
0
0
1
5
0
0
0
0
1
0
0
0
0
0
0
0
0
256
2
5
0
0
0
0
0
1
1
1
1
1
1
1
1
255
3
6
0
0
0
0
0
0
1
1
1
1
1
1
1
127
4
9
0
0
0
0
0
0
1
1
0
1
1
1
1
111
5
8
0
0
0
0
0
0
1
0
1
1
1
1
1
95
6
8
0
0
0
0
0
0
1
1
0
0
0
0
0
96
7
7
0
0
0
0
0
0
0
1
1
1
1
1
1
63
8
7
0
0
0
0
0
0
1
0
0
0
0
0
0
64
9
6
0
0
0
0
0
1
0
0
0
0
0
0
0
128
10
8
0
0
0
0
0
1
0
1
0
0
0
0
0
160
11
7
0
0
0
0
0
1
1
0
0
0
0
0
0
192
12
8
0
0
0
0
0
1
1
1
0
0
0
0
0
224
13
9
0
0
0
0
0
1
1
1
1
0
0
0
0
240
14
8
0
0
0
0
0
1
1
0
1
1
1
1
1
223
15
8
0
0
0
0
0
1
1
1
0
0
0
0
0
224
16
5
0
0
0
0
1
0
0
0
0
0
0
0
0
256
17
6
0
0
0
0
1
1
0
0
0
0
0
0
0
384
18
4
0
0
0
1
0
0
0
0
0
0
0
0
0
512
19
7
0
0
0
1
0
0
1
0
0
0
0
0
0
576
20
6
0
0
0
1
0
1
0
0
0
0
0
0
0
640
in the MPCM encoding and decoding. The smaller the number cl共r兲 is, the higher priority the rl is for spectral encoding and decoding. Next, we can further construct an M-dimensional priority unit vector associated with the priority code word cl共r兲 for MPCM-PSC as follows: cl共r兲 = 共cl1共r兲,cl2共r兲, . . . ,clM 共r兲兲T
共8兲
M with clk共r兲 苸 兵0 , 1其 and 兺k=1 clk共r兲 = 1. The condition that M 兺k=1clk共r兲 = 1 in Eq. 共8兲 implies that cl共r兲 is the only one component with 1 component and all zeros for its remaining components. It should be noted that the priority code word cl共r兲 takes its value in 兵1 , 2 , . . . , M其. Instead of using the priority code word cl共r兲 itself, we use its corresponding M-dimensional priority unit vector cl共r兲 defined by Eq. 共8兲, where the boldface version cl共r兲 of cl共r兲 indicates that it is
Optical Engineering
the priority unit vector of the original scalar priority code word cl共r兲. As an example, for M = 8, cl共r兲 can take any of eight values, 1, 2, 3, 4, 5, 6, 7, 8. In this case, the following eight-dimensional priority unit vectors derived from Eq. 共8兲 can be used for spectral signature coding: cl共r兲 = 1 ⇔ cl共r兲 = 共1,0,0,0,0,0,0,0兲, cl共r兲 = 2 ⇔ cl共r兲 = 共0,1,0,0,0,0,0,0兲, cl共r兲 = 3 ⇔ cl共r兲 = 共0,0,1,0,0,0,0,0兲, cl共r兲 = 4 ⇔ cl共r兲 = 共0,0,0,1,0,0,0,0兲, cl共r兲 = 5 ⇔ cl共r兲 = 共0,0,0,0,1,0,0,0兲,
097002-7
September 2006/Vol. 45共9兲
Chang et al.: Progressive coding for hyperspectral signature characterization
3.1 Spectral Discrimination
Fig. 9 Five spectral signatures of chemical data from NIST. x-coordinates: band numbers; y-coordinates: priority code words.
By virtue of Eq. 共11兲, the similarity between two signature vectors r and s can be measured progressively. In other words, two signature vectors r and s are first measured by Eq. 共11兲 in stage 1 via a prescribed stage threshold, say ⌬1. If the distance D1共r , s兲 is greater than ⌬1, then r and s will be declared to be distinct. Otherwise, the comparison between r and s is continued to proceed at stage 2. If the distance D2共r , s兲 is greater than a prescribed stage threshold ⌬2, then r and s will be considered to be distinct signatures. Otherwise, a further comparison between r and s is continued on at stage 3, etc. The implementation of the MPCMbased progressive spectral coding for target discrimination can be summarized as follows. MPCM-PSSC spectral discrimination algorithm.
cl共r兲 = 6 ⇔ cl共r兲 = 共0,0,0,0,0,1,0,0兲,
1. Let r and s be two spectral signature vectors to be discriminated. 2. Specify the number of stages, M, needing to be processed. If two signatures produce different stage numbers M 1 and M 2, then M is chosen as the minimum of M 1 and M 2. M to be used for 3. Determine the stage thresholds 兵k其k=1 discrimination in each of the M stages. 4. Apply the MPCM to r and s to generate their priority code words as described in Eq. 共8兲 and expressed by Eq. 共10兲. 5. Use Eq. 共11兲 to measure the similarity between r and s progressively. For each stage k, we calculate the distance Dk共r , s兲 and compare it against the k’th stage threshold, ⌬k. If Dk共r , s兲 ⬎ k, the two pixel vectors r and s are declared to be distinct, and the process is terminated. Otherwise, repeat the same procedure until it reaches the last stage M. In this case, we check if D M 共r , s兲 ⬎ M . 6. If D M 共r , s兲 ⬎ M , the two pixel vectors r and s are declared to be distinct, and the process is terminated. 7. If D M 共r , s兲 艋 M , the process is also terminated and the output is “no discrimination,” which declares r and s to be the same signature.
cl共r兲 = 7 ⇔ cl共r兲 = 共0,0,0,0,0,0,1,0兲, cl共r兲 = 8 ⇔ cl共r兲 = 共0,0,0,0,0,0,0,1兲.
共9兲
More specifically, if the priority code word cl共r兲 resulting from rl is the priority k, its M-dimensional priority unit vector cl共r兲 is then specified by 共10兲 where only 1 occurs in the k’th component and represents its priority specified by the k’th stage. The advantage of using the M-dimensional priority unit vector is that the position of the 1 in Eq. 共10兲 indicates the significance of its priority in the same manner that the bit position indicates the precision of the bit in a binary representation. Most importantly, we can use Eq. 共10兲 and the Hamming distance to define a distance measure between two signature vectors r = 共r1 , r2 , . . . , rL兲T and s = 共s1 , s2 , . . . , sL兲T at the k’th stage via their corresponding M-dimensional priority unit vectors by L
Dk共r,s兲 = 兺 clk共r兲 丣 clk共s兲.
共11兲
l=1
where there is an 丣 exclusive OR.
A key issue in implementing the MPCM-PSSC discrimination algorithm is the determination of an appropriate set of M stage thresholds for a signature. In doing so a simu-
Table 3 Thirteen stage thresholds for five signatures in Fig. 9 with SNR 30 : 1. Signature
1
2
3
4
5
6
7
8
9
10
11
12
13
s1
2
3
7
16
23
28
40
47
58
58
54
48
47
s2
1
9
6
19
29
40
61
61
83
96
94
83
81
s3
2
3
6
10
21
27
38
49
50
57
70
66
64
s4
1
2
9
26
27
52
92
110
150
150
140
80
130
s5
0
0
1
5
8
18
20
30
37
55
55
58
87
Optical Engineering
097002-8
September 2006/Vol. 45共9兲
Chang et al.: Progressive coding for hyperspectral signature characterization Table 4 Discrimination among five signatures in Fig. 9 using the stage thresholds in Table 3. Signatures
1
2
3
4
5
6
7
8
9
10
11
12
13
s1-s2
10
32
49
80
94
120
170
190
190
200
160
110
120
s1-s3
12
32
53
72
100
120
150
180
180
180
190
120
140
s1-s4
12
30
57
98
100
150
200
160
180
170
150
87
150
s1-s5
10
28
48
69
88
120
140
160
180
180
170
130
260
s2-s3
6
22
36
54
88
110
140
160
180
200
180
140
170
s2-s4
6
20
42
78
82
140
180
160
190
190
160
110
170
s2-s5
4
18
27
45
66
100
140
130
180
210
160
130
280
s3-s4
8
16
44
78
88
130
160
170
160
180
170
130
170
s3-s5
6
14
35
39
80
98
96
140
160
170
180
170
270
s4-s5
6
14
39
67
76
120
150
130
170
180
160
110
280
2. Specify, via Eq. 共6兲, the number of stages, M, needed to be processed. For each signature sh, let M h be the associated stage number. Then M is chosen as the minimum among M 1, M 2 , . . . , M p. M 3. Determine stage thresholds for all M stages, 兵k其k=1 for s1 , s2 , . . . , s p. 4. Apply the MPCM to the target signature t to generate its priority code. Set k = 1. 5. At the k’th stage, calculate the distance Dk共t , sh兲 between t and sh at stage k for 1 艋 h 艋 p, using Eq. 共11兲. The best t is identified by sh* with h* = min1艋h艋p兵Dk共t , sh兲其. If there is a tie, the process is continued with those signatures that yield min1艋h艋p兵Dk共t , sh兲其. 6. If k ⬍ M, let k ← k + 1 and go to step 5. Otherwise, continue. 7. In this case, we reach the last stage M. The best t is identified by sh* with h* = min1艋h艋p兵D M 共t , sh兲其. If there is a tie at this final stage, the algorithm either declares “no match” or identifies t as one of the tied signatures.
lated white Gaussian noise is added to the signature to achieve a certain signal-to-noise ratio 共SNR兲. This SNR is determined by how much sensitivity we would like to have for a signature responding to its spectral variations. 3.2 Spectral Identification The target identification studied in this section is different from the spectral discrimination in Sec. 3.1. While the target discrimination only discriminates one signature from another without performing any additional task such as detection, classification, or identification, the target identification uses a given database 共spectral library兲 ⌫ to identify an unknown target signature t. Unlike spectral discrimination, the proposed spectral identification does not require stage thresholds. MPCM-PSSC spectral identification algorithm 1. 1. Let ⌫ be a given database 共spectral library兲 that is made up of p spectral signatures s1 , s2 , . . . , s p 共i.e., p· 兲, and t be the target spectral signature vec⌫ = 兵sh其h=1 tor to be identified via the database ⌫.
Steps 5 to 7 in this algorithm calculate the distance
Table 5 Spectral identification for a mixed signature, s = 0.6t + 0.1s2 + 0.1s3 + 0.1s4 + 0.1s5 with t = s1. Signature
1
2
3
4
5
6
7
8
9
10
11
12
13
SUM
s1
6
24
46
80
110
120
140
170
140
130
130
70
68
1234
s2
12
34
47
88
100
130
170
170
190
190
150
99
120
1500
s3
14
34
55
92
110
130
150
170
170
170
180
130
150
1555
s4
14
30
61
110
110
170
200
160
170
160
140
79
160
1564
s5
12
30
46
77
95
130
140
150
180
170
160
120
270
1580
Optical Engineering
097002-9
September 2006/Vol. 45共9兲
Chang et al.: Progressive coding for hyperspectral signature characterization Table 6 Spectral identification for a mixed signature, s = 0.1s1 + 0.6t + 0.1s3 + 0.1s4 + 0.1s5 with t = s2. Signature
1
2
3
4
5
6
7
8
9
10
11
12
13
SUM
s1
10
32
53
87
120
150
180
190
170
170
160
96
98
1516
s2
0
16
22
59
98
130
140
160
150
190
150
110
100
1325
s3
6
20
42
65
100
130
150
190
160
180
170
130
160
1503
s4
6
18
48
83
110
160
190
180
170
160
150
95
150
1520
s5
4
16
31
54
96
120
130
150
170
180
170
120
290
1531
Dk共t , sh兲 between t and sh for each 1 艋 h 艋 p stage by stage and makes a progressive decision to determine if there is a match between t and sh* for some h*. There is no need of implementing stage thresholds as with spectral discrimination. As an alternative, we can also replace steps 5 to 7 to derive a second version of MPCM-PSSC target identification that postpones the decision until the last stage M by calculating the sum of stage distances between t and sh in all M stages. In this case, the identification is to find the signature that yields the smallest sum.
was demonstrated in Figs. 7 and 8 and Tables 1 and 2. This and the following sections further demonstrate the versatility of the MPCM-PSSC in other applications: spectral discrimination and identification. Two sets of data were used for experiments: laboratory data and real hyperspectral images. The laboratory data used in this section are chemical/ biological spectral data available online at NIST’s Web site.16 The data set has the five 880-band chemical/ biological spectral signatures shown in Fig. 9, which are for methyl salicylate, pentanedione, propanoic acid, thiodiglycol, and 3-heptanol. The selection of the data set for the experiments was arbitrary, and all the experiments conducted on this data set can be also applied to other data sets in Ref. 16. There are two reasons to select this data set. One is to demonstrate that the MPCM-PSSC has an application in chemical/biological defense. The other is to demonstrate that the MPCM-PSSC can be also used for ultraspectral signature characterization with thousands of spectral channels. Some other applications, such as hyperspectral laboratory data experiments, can be found in Ref. 17.
MPCM-PSSC spectral identification algorithm 2. The same first four steps used in MPCM-PSSC target identification algorithm 1 are followed by 5⬘. Compute SUMh M = 兺k=1 Dk共t , sh兲, and identify t by sh* with h* = arg兵min1艋h艋p兵SUMh其其, the signature that yields the smallest SUMh. If there is a tie at this final stage, the algorithm either declares “no match” or identifies t as one of the tied signatures. It should be noted that step 5⬘ does not make its decision progressively. Instead, it makes its decision at the final stage, M, based on the sum of all stage distances. Nevertheless, it does take advantage of the progressive spectral signature changes occurred at each stage, each of which contributes its change to the sum.
Example 1 (Spectral discrimination). In order to perform spectral discrimination using the MPCM-PSSC, we need to determine appropriate thresholds for each stage that are implemented by MPCM-PSSC stage by stage. For each signature we create a noise-corrupted signature with SNR 30 : 1, where the SNR was defined in Ref. 18 as the ratio of the 50%-reflectance signal to the noise standard deviation. Using the methyl salicylate signature in Fig. 5 as an example, the spectral signature is denoted by r
4
Data Experiments on Chemical/Biological Laboratory The ability of the MPCM-PSSC in progressive signature decomposition and progressive signature reconstruction
Table 7 Spectral identification for a mixed signature, s = 0.1s1 + 0.1s2 + 0.6t + 0.1s4 + 0.1s5 with t = s3. Signature
1
2
3
4
5
6
7
8
9
10
11
12
13
SUM
s1
14
34
57
93
100
160
160
180
170
170
140
110
100
1488
s2
8
30
40
79
92
120
170
160
200
190
160
130
130
1509
s3
6
18
24
59
84
130
130
150
160
160
150
140
120
1331
s4
10
24
46
95
92
150
180
160
170
170
140
110
150
1497
s5
8
24
39
58
78
120
130
140
170
180
140
140
260
1487
Optical Engineering
097002-10
September 2006/Vol. 45共9兲
Chang et al.: Progressive coding for hyperspectral signature characterization Table 8 Spectral identification for a mixed signature, s = 0.1s1 + 0.1s2 + 0.1s3 + 0.6t + 0.1s5 with t = s4. Signature
1
2
3
4
5
6
7
8
9
10
11
12
13
SUM
s1
12
34
55
110
130
140
190
180
180
150
150
95
130
1556
s2
6
24
36
83
110
130
190
160
190
190
160
110
130
1519
s3
8
22
40
85
110
130
160
160
170
160
170
120
170
1505
s4
6
14
42
87
110
150
170
130
150
140
130
72
96
1297
s5
6
20
31
74
110
110
140
130
150
170
160
130
270
1501
= 共r1 , r2 , . . . , r880兲T. Then a noise-corrupted signature de˜1 ,˜r2 , . . . ,˜r880兲T can be obtained by adding a noted by ˜r = 共r white Gaussian noise to each band to achieve a SNR of 30 : 1. Finally, the MPCM is applied to both the pure signature with no noise and the 30 : 1-SNR noise-corrupted signature to obtain their respective MPCM priority code words for band l, viz., cl = 共cl1 , cl2 , . . . , clM 兲T and ˜cl ˜ l1 ,˜cl2 , . . . ,˜clM 兲T with M = 13. Then the k’th stage thresh= 共c old ⌬k is obtained by 880
k = 兺 clk 丣 ˜clk .
共12兲
l=1
M Table 3 tabulates all the stage thresholds 兵k其k=1 for each of five signatures, methyl salicylate, pentanedione, propanoic acid, thiodiglycol, and heptanol, which are denoted by s1, s2, s3, s4, and s5. It should be noted that the total number of stages, M M is deter= 13, is determined by Eq. 共6兲. As long as 兵k其k=1 mined, the discrimination process starts with the stage threshold in stage 1. If the distance between two signatures in stage 1 is greater than the threshold, the two signatures are declared to be distinct and discrimination process is terminated. Otherwise, the two signatures cannot be discriminated in stage 1, and the discrimination process is then passed on to stage 2, where the distance between the two signatures is calculated and compared with the threshold at stage 2. If the distance at stage 2 is greater than the threshold, the process is terminated. Otherwise, the same procedure is repeated until the last stage is reached. Since the stage thresholds produced by one signature generally are different from those produced by another signature, the discrimination threshold is then determined by the minimum of the two different stage thresholds, that is, min兵i共signature 1兲 , i共signature 2兲其. Table 4 shows the results where the stage thresholds in Table 3 were used for discrimination, and the shaded numbers are for the stages at which two signatures were discriminated. As we can see from Table 4, all the five signatures can be discriminated in stage 1.
Example 2 (Spectral identification). In this example, we further demonstrate the utility of the MPCM-PSSC in specOptical Engineering
tral identification via a database 共spectral library兲 ⌫, which consists of the five signatures in Fig. 9. For each target signature t, 60% abundance fraction was simulated, the other four signatures sharing the remaining 40% abundance fraction at 10% each. Five different admixtures were generated by a fixed mixing composition 共0.6, 0.1, 0.1, 0.1, 0.1兲 of the five signatures. When one of s1, s2, s3, s4, and s5 was designated as a target signature, say s1, a mixed signature s was then generated by mixing 0.6 of s1 with abundance fraction of 0.1 from each of the other four signatures s2, s3, s4, and s5. Table 5 tabulates a progressive spectral identification process for such a mixed signature s, where s was quickly identified correctly by the target signature t = s1 immediately by algorithm 1 in the first stage, as well as by algorithm 2. Similar experiments were also performed by changing the designated target signature t from s1 to s2, s3, s4, and s5 for two spectral identification algorithms. Tables 6–9 tabulate their respective spectral progressive identification results. All the four mixed signatures are correctly identified by both algorithm 1 and algorithm 2. This experiment indicated that s4 as s5 are very similar to each other in spectral variation. Algorithm 1 had difficulty with identification until stage 2. As a concluding remark, the abundance fraction of the target signature t has an effect on the performance of the MPCM-PSSC in identification. If the abundance fraction was greater than 60%, its performance improved significantly. Otherwise, its performance deteriorated as the abundance fraction diminished. In the following real image experiments, we further demonstrate that the MPCM-PSSC can still perform effectively when the estimated abundance fraction of a subpixel target is above 40%. 5 Real-Image Hyperspectral Experiments The second data set used for experiments was a real image, shown in Fig. 10共a兲, from the HYperspectral Digital Imagery Collection Experiment 共HYDICE兲. It has a size of 64 ⫻ 64 pixel vectors with 15 panels in the scene. Within the scene there is also a large grass field background, a forest on the left edge, and a barely visible road running on the right edge. Low-signal, high-noise bands 共bands 1 to 3 and bands 202 to 210兲 and water vapor absorption bands 共bands
097002-11
September 2006/Vol. 45共9兲
Chang et al.: Progressive coding for hyperspectral signature characterization Table 9 Spectral identification for a mixed signature, s = 0.1s1 + 0.1s2 + 0.1s3 + 0.1s4 + 0.6t with t = s5. Signature
1
2
3
4
5
6
7
8
9
10
11
12
13
SUM
s1
10
26
54
72
120
150
180
170
190
160
160
120
140
1552
s2
4
20
35
56
92
130
180
160
180
210
170
130
170
1537
s3
6
16
41
58
94
120
150
160
180
170
170
150
160
1475
s4
6
16
47
72
94
150
190
140
170
160
150
98
170
1463
s5
2
6
28
37
88
110
130
130
150
150
150
130
230
1341
101 to 112 and bands 137 to 153兲 were removed. The spatial resolution is 1.56 m, and the spectral resolution is 10 nm. There are 15 panels located in the center of the grass field and arranged in a 5 ⫻ 3 matrix as shown in Fig. 10共b兲, which provides the ground truth map of Fig. 10共a兲. Each element in this matrix is a square panel and denoted by pij with row indexed by i = 1 , 2 , 3 , 4 , 5 and column indexed by j = 1 , 2 , 3. For each row, the three panels pi1, pi2, pi3 were painted with the same material but have three different sizes. For each column j = 1 , 2 , 3, the five panels p1j, p2j, p3j, p4j, p5j have the same size but were painted with five different materials. It should be noted that the panels in rows 2 and 3 are made of the same material, but with different paints; likewise the panels in rows 4 and 5. Nevertheless, they were still considered as different materials. The sizes of the panels in the first, second, and third columns are 3 ⫻ 3, 2 ⫻ 2, and 1 ⫻ 1 m, respectively. So the 15 panels have five different materials and three different sizes. Figure 10共b兲 shows the precise spatial locations of these 15 panels, where red 共R;兲 pixels are the panel center pixels, and yellow 共Y兲 pixels are panel pixels mixed with background. The 1.56-m spatial resolution of the image scene suggests that most of the 15 panels are one pixel in
Fig. 10 共a兲 A HYDICE panel scene ground truth map of spatial locations signatures of panels p1, p2, p3, p4, numbers; y-coordinates: priority code
Optical Engineering
that contains 15 panels; 共b兲 of the 15 panels; 共c兲 spectral and p5. x-coordinates: band words.
size except for p21, p31, p41, p51, which are two-pixel panels, their pixels being denoted by p211, p221, p311, p312, p411, p412, p511, p521. Since the size of the panels in the third column is 1 ⫻ 1 m, they cannot be seen visually in Fig. 10共a兲, because their size is less than the 1.56-m pixel resolution. Figure 10共c兲 plots the five panel spectral signatures 5 兵pi其i=1 obtained from Fig. 10共b兲, where the i’th panel signature, pi, was generated by averaging the R pixels in row i. These panel signature are used to represent target knowledge of the panels in each row. Two scenarios have been conducted for experiments based on this 15-panel HYDICE scene. One is spectral discrimination among the five panel signatures, p1, p2, p3, p4, and p5. The other is identifying the 15 panels unsupervised, using only knowledge obtained directly from the data. Example 3 (Spectral discrimination). As in example 1, the spectral discrimination was performed by the MPCMPSSC, for which number of stages required was calculated 13 by Eq. 共6兲 to be M = 13 and the stage levels 兵⌬k其k=1 were obtained by Eq. 共7兲. In order to implement MPCM-PSSC algorithms, we also need to determine an appropriate set of stage thresholds. In the same way as in example 1, the desired set of stage 13 thresholds 兵k其k=1 共Table 10兲 were obtained by Eq. 共13兲, using noise-corrupted signatures with SNR set to 30:1 as a variation of the signature tolerance. Table 11 tabulates the discrimination results obtained by 5 in the MPCM-PSSC among the five panel signatures 兵pi其i=1 Fig. 10共c兲. As shown in Table 11, p1 and p2 are more similar to each other than to the other three panel signatures, since the discrimination could be accomplished in stage 2 in terms of spectral variation, in contrast with the other signature discrimination, which was made in stage 1. Example 4 (Spectral identification). The experiments conducted in this example are very interesting and offer several intriguing results and observations. It was designed to identify the 19 共R兲 panel pixels, pij in Fig. 10共b兲 by the MPCM-PSSC. Since the panel pixels p13, p23, p33, p43, p53 have size 1 ⫻ 1 m, which is smaller than the pixel size, their abundance fractions present in single pixels can be at most 1 / 共1.56兲2 = 0.4109, which can be interpreted as approximately 50% of the pixel size. As a result, the perfor-
097002-12
September 2006/Vol. 45共9兲
Chang et al.: Progressive coding for hyperspectral signature characterization Table 10 Stage thresholds for five panel signatures with SNR 30 : 1. Panel
1
2
3
4
5
6
7
8
9
10
11
12
13
p1
2
1
5
10
14
24
23
16
16
16
9
4
4
p2
2
2
14
9
13
23
24
15
13
11
10
4
4
p3
1
4
6
8
16
19
21
13
11
11
7
6
5
p4
3
6
3
11
15
21
23
20
16
12
7
7
3
p5
3
6
4
10
16
19
21
18
13
10
7
4
3
mance in identification of these subpixel panels can be expected to be very challenging and difficult. On the other hand, due to its very high spatial and spectral resolution, the spectral variations of image pixels in this HYDICE scene can be very subtle and sensitive. Therefore, using the 5 in Fig. 10共c兲 as a database may five panel signatures 兵pi其i=1 not be appropriate. Instead, a more effective database must be obtained in an unsupervised way, directly from data. In doing so, the result of the 34 target pixels generated directly from the scene by an unsupervised fully constrained least-squares 共UFCLS兲 method developed in Refs. 11 and 19 was used to form a desired database ⌫. Among these 34 generated target pixels there were five panel pixels identified as corresponding to the five distinct panel signatures 5 . Table 12 tabulates the results produced by the 兵pi其i=1 MPCM-PSSC using Algorithm 1 and Algorithm 2 for target identification along with the abundance fractions of the 19 R pixels estimated by the fully constrained least-squares method in Ref. 19, where an identification error is highlighted by shading. According to Table 12, Algorithm 1 yielded the best performance in the sense that it only missed identification
of the panels, p13, p212, p33, p412, p43, p53 with estimated abundance fractions less than 0.3821. Algorithm 2 also made six identification errors, but it seemed that these misidentifications had no clear tie to the abundance fractions as with Algorithm 1. For example, it correctly identified p212, whose abundance is only 0.3141, but it misidentified p32, whose abundance is 0.5343. Compared to Algorithm 2, the SAM and the spectral information divergence 共SID兲11,12 not only made the same six identification errors as did Algorithm 2, but also made two additional errors, which are panel pixels p511, p52 with abundance fractions 0.7203 and 0.7789. This experiment showed that the MPCM-PSSC performed more effectively than a pixel-based spectral similarity measure such as SAM and SID in Table 12. It should be noted that real target pixels in Table 12 were compared 5 for analysis. against the five panel signatures 兵pi其i=1 It is interesting to note that when the five panel signa5 in Fig. 10共c兲 were directly used for identificatures 兵pi其i=1 tion, the results were reported in Ref. 17 and were not as good as the results in Table 12 that were produced by using the real target pixels in Table 12. This is primarily because
Table 11 Discrimination among five panel signatures using the stage thresholds in Table 10. Panels
1
2
3
4
5
6
7
8
9
10
11
12
13
p1-p2
2
2
10
13
20
32
30
24
29
21
16
4
5
p1-p3
4
4
17
23
28
29
31
26
24
22
11
6
5
p1-p4
4
8
8
22
26
37
32
26
22
23
10
6
4
p1-p5
4
8
11
22
32
34
34
21
13
16
12
2
5
p2-p3
2
2
13
12
24
35
31
22
21
9
11
6
4
p2-p4
4
8
14
23
28
33
36
22
21
10
10
8
3
p2-p5
4
8
17
23
28
30
30
25
28
13
8
4
4
p3-p4
6
10
19
27
30
34
31
12
20
13
9
10
5
p3-p5
6
10
22
29
34
35
29
29
17
16
7
6
6
p4-p5
4
8
3
6
16
25
24
29
21
13
4
6
1
Optical Engineering
097002-13
September 2006/Vol. 45共9兲
Chang et al.: Progressive coding for hyperspectral signature characterization Table 12 Identification of 19 R panel pixels in Fig. 10共a兲.
Panel pixels Algorithm 1 Algorithm 2
SAM/ Abundance fractions SID estimated by FCLS
p11
p1
p1
p1
1
p12
p1
p2
p2
0.4098
p13
p3
p2
p2
0.0499
p211
p2
p2
p2
0.5255
p221
p3
p2
p2
0.3141
p22
p2
p2
p2
0.6917
p23
p2
p2
p2
0.4221
p311
p3
p3
p3
0.8647
p312
p3
p3
p3
1
p32
p3
p2
p2
0.5343
p33
p2
p2
p2
0.3285
p411
p4
p4
p4
1
p412
p5
p4
p4
0.3821
p42
p4
p4
p4
0.7034
p43
p2
p2
p2
0.2242
p511
p5
p5
p4
0.7203
p521
p5
p5
p5
1
p52
p5
p5
p4
0.7789
p53
p2
p2
p2
0.1466
acterization. It is derived from a technique called multistage pulse code modulation 共MPCM兲, which was previously developed for progressive image reconstruction and edge detection. Unlike the commonly used spectral signature coding, which performs coding with hard decisions, the proposed PSSC characterizes a hyperspectral signature in a sequence of soft decisions in multiple stages to produce a profile of progressive changes in spectral variation of the spectral signature. The idea of the MPCM-based PSSC 共MPCM-PSSC兲 is to use a sequence of soft-decision-based quantizers to generate a priority code for a hyperspectral signature, which can be used to prioritize the signature values across its spectral coverage according to priorities specified by stage levels implemented in various stages. Such a priority code allows one to decompose and reconstruct a hyperspectral signature progressively in accordance with the priorities assigned to spectral signature values in wavelengths. As a result, a profile of progressive changes in spectral variation can be generated for a hyperspectral signature and can be further used to dictate subtle differences in spectral characterization. In order to substantiate the utility of the proposed MPCM-PSSC, applications in spectral discrimination and identification have been considered and investigated. Experiments have also been conducted to demonstrate unique features of the MPCM-PSSC in hyperspectral signature characterization, such as progressive spectral changes, progressive signature decomposition, and progressive signature reconstruction, which cannot be found in any spectral signature coding. Acknowledgments The first author would like to acknowledge support received from his NRC 共National Research Council兲 senior research associateship sponsored by the U.S. Army Soldier and Biological Command, Edgewood Chemical and Biological Center 共ECBC兲 from 2002–2003. References
5 兵pi其i=1
the signatures obtained by averaging R-panel pixels are not real pixels, but rather signatures. As a result, the signature variations of real target pixels have been compromised. The MPCM-PSSC seemed to remedy such deficiency by capturing subtle spectral variations in multiple stages, which can dictate changes in subtle difference encountered in real data as shown in Table 12. As a final comment, it should be noted that the 34 target pixels used in this experiment were shown in Ref. 19 to be sufficient to include target pixels that represent the five distinct panel spectral signatures. However, that did not imply that it required at least 34 target pixels to do so. There may be some unsupervised target detection and classification algorithms that can generate fewer target pixels than 34 but still include pixels that can represent all the desired five panel signatures. In that case, these generated target pixels can be used as a database as well. As expected, the conclusion drawn from Table 12 will remain unchanged. 6 Conclusions This paper introduces a new concept of progressive spectral signature coding 共PSSC兲 for hyperspectral signature charOptical Engineering
1. K. H. Tzou, “Progressive image transmission: a review and comparison of techniques,” Opt. Eng. 26共7兲, 581–589 共1987兲. 2. L. Wang and M. Goldberg, “Progressive image transmission using vector quantization on images in pyramid form,” IEEE Trans. Commun. 37共12兲, 1339–1349 共1989兲. 3. L. Wang and M. Goldberg, “Progressive image transmission by transform coefficient residual error quantization,” IEEE Trans. Commun. 36共1兲, 75–87 共1988兲. 4. Y. Cheng, “Multistage pulse code modulation 共MPCM兲,” MS Thesis, Dept. of Electrical Engineering, Univ. of Maryland, Baltimore County; Baltimore 共1993兲. 5. C.-I Chang, Y. Cheng, M. L. G. Althouse, L. Zhang, and J. Wang, “Multistage image coding: a top-down gray-level triangle method,” in Proc. Int. Symp. on Spectral Sensing Research (ISSSR), pp. 497– 511 共1992兲. 6. C.-I Chang, Y. Cheng, and M. L. G. Althouse, “Chemical vapor detection using multistage predictive coding,” in Proc. Scientific Conf. on Chemical Defense Research, pp. 909–915 CRDEC 共1992兲. 7. C.-J. Chang, C.-I Chang, and M.-L. Chang, “Subband multistage predictive coding,” Proc. Int. Conf. on Signal Processing ’93/Beijing, pp. 783–787 共1993兲. 8. C.-I Chang, Y. Cheng, J. Wang, M. L. G. Althouse, and M. L. Chang, “Progressive edge extraction using multistage predictive coding,” Proc. 1994 Int. Symp. on Speech, Image and Neural Networks, pp. 57–60 共1994兲. 9. Y. Du, C.-I Chang, and P. Thouin, “An automatic system for text detection in single video images,” J. Electron. Imaging 12共3兲, 410– 422 共2003兲. 10. R. A. Schwengerdt, Remote Sensing, Models and Methods for Image Processing, 2nd ed., New York, Academic Press 共1997兲. 11. C.-I Chang, Hyperspectral Imaging: Techniques for Spectral Detection and Classification, Kluwer Academic/Plenum Publishers 共2003兲.
097002-14
September 2006/Vol. 45共9兲
Chang et al.: Progressive coding for hyperspectral signature characterization 12. C.-I Chang, “An information theoretic-based approach to spectral variability, similarity and discriminability for hyperspectral image analysis,” IEEE Trans. Inf. Theory 46共5兲, 1927–1932 共2000兲. 13. A. Gersho and R. M. Gray, Vector Quantization and Signal Compression, Kluwer Academic Publishers 共1992兲. 14. B. H. Juang and A. H. Gray, Jr., “Multiple stage vector quantization for speech coding,” in Proc. IEEE Conf. on ASSP, Vol. 1, pp. 597– 600 共1982兲. 15. S. Mallat, “A theory for multiresolution signal decomposition,” IEEE Trans. Pattern Anal. Mach. Intell. 11共7兲, 674–693 共1989兲. 16. webbook.nist.gov/chemistry. 17. C.-I Chang, J. Wang, F. D’Amico, and J. O. Jensen, “Multistage pulse code modulation for progressive spectral signature coding,” in Chemical and Biological Standoff Detection II, Proc. SPIE 5584, 252–261 共2003兲. 18. J. Harsanyi and C.-I Chang, “Hyperspectral image classification and dimensionality reduction: an orthogonal subspace projection approach,” IEEE Trans. Geosci. Remote Sens. 32共4兲, 779–785 共1994兲. 19. D. Heinz and C.-I Chang, 共2001兲, “Fully constrained least squares linear mixture analysis for material quantification in hyperspectral imagery,” IEEE Trans. Geosci. Remote Sens. 39共3兲, 529–545 共2001兲. Chein-I Chang received his BS degree from Soochow University, Taipei, Taiwan, his MS degree from the Institute of Mathematics at National Tsing Hua University, Hsinchu, Taiwan, and his MA degree from the State University of New York at Stony Brook, all in mathematics. He also received his MS and MSEE degrees from the University of Illinois at Urbana-Champaign and his PhD degree in electrical engineering from the University of Maryland, College Park. He has been with the University of Maryland, Baltimore County 共UMBC兲 since 1987 and is currently a professor in the Department of Computer Science and Electrical Engineering. He was a distinguished lecturer chair at the National Chung Hsing University, sponsored by the Ministry of Education in Taiwan from 2005 to 2006 and is currently holding a chair professorship with National Chung Hsing University. He has three patents and several pending on hyperspectral image processing. He is on the editorial board of the Journal of High Speed Networks and was the guest editor of a special issue of the same journal on telemedicine and applications and will co-edit two special issues on Broadband Multimedia Sensor Networks in Healthcare Applications for Journal of High Speed Networks and on High Performance Computing of Hyperspectral Imaging for International Journal of High Performance Computing Applications, . His research interests include multispectral/hyperspectral image processing, automatic target recognition, medical imaging, information theory and coding, signal detection and estimation, and neural networks.
Chein-Chi Chang received his BS degree from Tamkang University, Taiwan, in 1979; his MS degree from the Ohio State University in 1981; and his PhD degree in civil engineering from the University of Missouri– Rolla in 1988. He has been a senior engineer with District of Columbia Water and Sewer Authority since 2000. Before his current position, he had worked with numerous engineering consulting companies. He has been an adjunct professor at four universities: University of Maryland, Baltimore County; University of Northern Virginia; China Hunan University; and China Central South University. He has been in several engineering societies: the American Society of Civil Engineers, the Chinese Institute of Engineers— USA, and the Overseas Chinese Environmental Engineers and Scientists Association. His research interests include multispectral/ hyperspectral image processing in environmental applications, system optimizations, remote sensing, geographic information systems, and water resources engineering. Chinsu Lin received his MS and PhD degrees in forestry from National Taiwan University in 1988 and 1996, respectively. He is currently a full professor and the head of the Department of Forestry and Natural Resources at National Chiayi University 共NCYU兲, Taiwan. His research interests include multispectral and hyperspectral signal processing and pattern recognition. He is currently investigating applications of remote sensing techniques in extraction of spatial information for forest ecosystem management; the major applications are automatic delineation and mapping of individual tree canopy, forest biomass and productivity, carbon fixation estimation, individual-based tree species classification, and wireless sensor networks for monitoring the ecosystem environment. He also makes efforts at upgrading the forest inventory accuracy by incorporating the techniques of hyperspectral and hyperspatial remote sensing, GIS, and GPS.
Jing Wang received her BS degree in electrical engineering and the MS degree in computer engineering from the Beijing University of Post and Telecommunications in 1998 and 2001. She also received her PhD degree in electrical engineering from the University of Maryland, Baltimore County 共UMBC兲, Baltimore, in 2006. Currently she is a research member of Xerox Wilson Center for Research and Technology 共WCR&T兲 in Webster, NY.
Optical Engineering
097002-15
September 2006/Vol. 45共9兲