JOURNAL OF MULTIMEDIA, VOL. 3, NO. 1, MAY 2008
47
Multiresolution Feature Based Fractional Power Polynomial Kernel Fisher Discriminant Model for Face Recognition Dattatray V. Jadhav Vishwakarma Institute of Technology, Department of Electronics, Pune, India Email:
[email protected]
Jayant V. Kulkarni1 Raghunath S. Holambe2 1
2
Vishwakarma Institute of Technology, Department of Instrumentation, Pune, India SGGS Institute of Engineering and Technology, Department of Instrumentation, Nanded, India Email: {
[email protected],
[email protected]}
Abstract—This paper presents a technique for face recognition which uses wavelet transform to derive desirable facial features. Three level decompositions are used to form the pyramidal multiresolution features to cope with the variations due to illumination and facial expression changes. The fractional power polynomial kernel maps the input data into an implicit feature space with a nonlinear mapping. Being linear in the feature space, but nonlinear in the input space, kernel is capable of deriving low dimensional features that incorporate higher order statistic. The Linear Discriminant Analysis is applied to kernel mapped multiresolution featured data. The effectiveness of this Wavelet Kernel Fisher Classifier algorithm is compared with the different existing popular algorithms for face recognition using FERET, ORL Yale and YaleB databases. This algorithm performs better than some of the existing popular algorithms. Index Terms—multiresolution, face recognition, kernel, linear discriminant analysis
I. INTRODUCTION Biometric authentication technologies across voice, iris, fingerprint, palm, and face are playing a crucial role in person authentication to control the access for important systems and attracting intensive interest of many researchers. Face recognition is an amicable alternative because the authentication can be completed in a hands free way without stopping user activities. In case of surveillance, the authentication is done without noticed by the person. A practical face recognition technique needs to be robust to the variations caused by the illumination conditions, facial expressions, pose of perspective, aging,
Corresponding Author: D. V. Jadhav, Phone: +91-9422797509.
© 2008 ACADEMY PUBLISHER
and other factors such as makeup, hair style, or glasses. The variations between the images of the same class due to illumination and viewing direction are almost always larger than the image variations due to a change in face identity, and so most existing face recognition methods encounter difficulties in case of large variations, especially when only one upright frontal image is available for each person, and the training images are under even illumination and a neutral facial expression [1]. Mathew Turk and Alex Pentland in “Ref [2]” presented a well known classical approach for the detection and identification of human faces called as Principal Component Analysis (PCA). This approach treats face recognition as a two dimensional recognition problem, taking advantage of the fact that faces are normally upright and thus may be described by a small set of 2-D characteristics views. The facespace is defined by the eigenfaces, which are eigenvectors of the set of faces. Chengjun Liu and Harry Wechsler in “Ref [3]” presented an Independent Gabor Features (IGF) method. The IGF method first derives a Gabor feature vector from a set of down sampled Gabor wavelet representations of face images, then reduces the dimensionality of the vector by means of PCA, and finally defines the independent Gabor features based on Independent Component Analysis (ICA). The independence property of these Gabor features facilitates the application of the Probabilistic Reasoning Model for classification. The Gabor transformed face images exhibit strong characteristics of spatial locality, scale and orientation selectivity. ICA further reduces redundancy and represents independent features explicitly. These independent features are the most useful for subsequent pattern discrimination and associative recall. With the Cover’s theorem on the seperability of patterns, nonlinearly separable patterns in an input space will become linearly separable with a high probability if
48
the input space is transformed nonlinearly to a high dimensional feature space. We can map an input image into a high dimensional feature space, so that linear discriminant methods can then be employed for face recognition. In “Ref [4]” Xudong Xie, and Kin-Man Lam presented Gabor based Kernel PCA (KPCA) with doubly non linear mapping for face recognition. The Gabor wavelets are used to extract the facial features. A doubly nonlinear mapping KPCA (DKPCA) is proposed to perform feature transformation and face recognition. The nonlinear mapping performed in the original feature space not only considers the statistical property of the input features, but also adopts the eigenmask to emphasize the important facial feature points. The conventional KPCA is performed on this mapped data. P. N. Belhumeur, J. P. Hespanha, and D. J. Kriegman in “Ref [5]” proposed a Linear subspace analysis, which considers a feature space as a linear combination of a set of bases has been widely used for face recognition. Fisher Linear Discriminant (FLD) or Linear Discriminant Analysis (LDA) defines a projection that makes within class scatter small and the between class scatter large. As a result, FLD derives compact and well separated clusters. As the original image space is high dimensional, most of these methods apply PCA for dimensionality reduction. Subsequent FLD transformation is used to build the most discriminating feature (MDF) space for classification. However this method requires more than one image per person in the training set. For a face recognition problem, however, usually there are a large number of faces (classes), but only a few training samples per face. Jing X. Y., Tang Y. Y., and Zhang D in “Ref [6]” used Fourier transform to derive the spatial frequency facial features. LDA is performed on these features to enhance the discriminating capability. Guang Dai, Dit Yan Yeung, and Yun Tao Qian in “Ref [7]” introduced an enhanced kernel discriminant analysis called kernel fractional step discriminant analysis for nonlinear feature extraction and dimensionality reduction. An appropriate wavelet transform can result in robust representations with regard to illumination changes and is capable of capturing substantial facial features, keeping computational complexity low. Jen Tzung Chien and Chia Chen Wu in “Ref [8] used multiresolution wavelet transform to extract waveletfaces. LDA is performed on these features to reinforce discriminating power. This paper presents a new multiresolution (wavelet) feature based Kernel Fisher Discriminant model called as Wavelet Kernel Fisher Classifier (WKFC) for face recognition by integrating the multiresolution features of face images with Kernel Fisher Discriminant. Daubechies wavelet DB3 first derives the desirable facial features characterized by spatial frequency to cope with variations due to facial expression and illumination changes. The fractional power polynomial kernel which uses nonlinear mapping is computed from these features. The FLD analysis is performed on the kernel mapped space to enhance the discriminating capability. The images are classified using the nearest neighbor classifier on the
© 2008 ACADEMY PUBLISHER
JOURNAL OF MULTIMEDIA, VOL. 3, NO. 1, MAY 2008
basis of Euclidean distance. In this paper we have presented the result of extra tests carried out on the approach presented in [9] which have been extended for fractional power of polynomial degree to evaluate the invariantness for facial expression and illumination variations using four different databases. In [9], we have presented the result of the algorithm for normal faces using FERET and ORL databases only. II. MULTIRESOLUTION FEATURES Wavelet transform (WT) is an increasingly popular tool in image processing and computer vision. WT has the nice features of space frequency localization and multiresolution. The main reasons for WT’s popularity lie in its complete theoretical framework, the great flexibility in choosing the bases and the low computational complexity. Wavelet based image representation has many advantages and according to psycho visual research there is strong evidence that the human visual system processes images in a multiscale way. Converging evidence in neurophysiology and psychology is consistent with the notion that the visual system analyses input at several spatial resolution scales. By spatial frequency analysis, an image is represented as a weighted combination of basis functions, in which high frequencies carry fine, detailed information and low frequencies carry coarse, shape based information. 2
Let L (R ) denote the vector space of a measurable, square integrable, one dimensional (1-D) signal. Wavelet
f (t ) ∈ L2 (R) is defined as
transform of
(Wa f )(b) = ∫ f (t )φa ,b (t )dt
(1)
where the wavelet basis function can be expressed as
φa ,b (t ) ∈ L2 (R)
⎛ t −b ⎞ φa ,b (t ) = a φ ⎜ ⎟. ⎝ a ⎠ −
1 2
(2)
These basis functions are called wavelets and have at least one vanishing moment. The arguments a and b denote the scale and the translation parameters respectively. Lower value of parameter a gives rapidly changing behavior of signal (high frequency components) whereas; its high value gives slowly changing behavior (low frequency components) of the signal. The translation parameter b determines the localization of
φa ,b (t ) in time. The wavelet basis functions in (2) are dilated (scaled) and translated versions of the mother wavelet φ(t ) [10]. Therefore, the wavelet coefficients of any scale (or resolution) could be computed from the wavelet coefficients of the next higher resolutions. The scaled and dyadic Discrete Wavelet Transform (DWT) of signal f (t ) is represented as
f (t ) = ∑ µ j0 ,kψ j0,k (t ) + k∈z
j0
∑ ∑ω
j =−∞ k∈z
j ,k
φ j , k (t )
(3)
JOURNAL OF MULTIMEDIA, VOL. 3, NO. 1, MAY 2008
where
ψ j (t ) 0 ,k
and
φ j ,k (t )
are the flexing and parallel
shift of the basic scaling function
φ (t ) respectively. coefficients and ω j , k
wavelet function the scaling
ψ (t ) and mother µ j ,k ( j < j0 ) are 0
are the wavelet
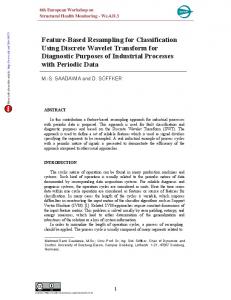
coefficients [10]. The DWT for 2-D images can be similarly defined by implementing the one dimensional DWT for each dimension (row and column) separately. Two dimensional wavelet transform decomposes an image into sub bands that are localized in frequency and orientation. A wavelet transform is created by passing the image through a series of filter bank stages. Fig. 1 illustrates the decomposition of an image using DWT into four sub images via the high-pass and low-pass filter. H and L represent the high pass and low pass filter, respectively, and ↓2 denotes the sub sampling by 2. The high pass filter (wavelet function) and low pass filter (scaling function) are finite impulse response filters. The output at each point depends only on a finite portion of the input. The filtered outputs are then down sampled by a factor of 2 in the horizontal direction. These signals are then filtered by an identical filter pair in the vertical direction. An image is decomposed into four subband denoted by LL, HL, LH and HH. Each of these subbands can be thought of as a smaller version of the image representing different image properties. The subband LL is a coarser approximation to the original image. The bands LH and HL record the changes of the image along horizontal and vertical directions, respectively. The HH band shows the high frequency components (detail components) of the image. Second level decomposition can then be conducted on LL sub band.
49
gearing with the highest discriminating power [12]. Three level Daubechies wavelet DB3 (because of its symmetry, compact support and the use of overlapping windows to reflect all changes between pixel intensities) have been used for image decomposition to derive the multiresolution features. The image feature vector using multiresolution approach is represented as stated below. 1. Single level decomposition is done and low frequency component YLL is concatenated to form the image feature vector. X i = [YLL ] (4) 2. In single level decomposition low frequency component YLL, and high frequency component YHH are concatenated to form the image feature vector. (5) X i = [YLL ,YHH ] 3. The low frequency subimage YLL is decomposed twice and low frequency subimages are concatenated to form image feature vector.
X i = [YLL ,YLL1,YLL 2 ]
(6)
III. KERNEL FISHER DISCRIMINANT ANALYSIS The Kernel Fisher Discriminant (KFD) method derives a unique solution based on a discriminant analysis criterion in the high dimensional feature space. It combines the kernel trick with FLD. The KFD method is nonlinear in the feature space due to the nonlinear mapping between the input space and the feature space. Let w1 ,w2 ,...,wL denotes the classes and
N1, N 2 , ...,N L denotes the number of samples within each class. Let X 1 , X 2 ,..., X M be the training samples in the input space and φ be a nonlinear mapping between the input space and the feature space. Assume the mapped data is centered and let D represent the data matrix in the feature space: (7) D = [φ(X 1 )φ(X 2 )...φ(X j )]. A kernel matrix K by means of the dot product in the feature space is defined as:
Figure 1. Multiresolution approach used for image decomposition.
Earlier studies concluded that information in low spatial frequency bands play a dominant role in face recognition. Nastar and Ayach in “Ref [11]” have investigated the relationship between variations in facial appearance and their deformation spectrum. He demonstrated that the low frequency components only are sufficient for recognition. Global description of faces is more significant in face recognition than finer details. Hence, the low frequency subimage (LL), which possesses high energy, is selected for further decomposition. This component represents the basic figure of an image and is the most informative subimage © 2008 ACADEMY PUBLISHER
K = DT D , (8) d K ij = (x.y ) =(φ(X i ))(φ(X j )) i, j = 1, 2 ,...,M (9) where d is the degree of polynomial. This has been varied for d = 3, 2 ,1, 0.9 , 0.8.0.7.0.6 . The best performance is obtained for d = 0.7 . Because of this, the proposed algorithm is called as fractional power kernel. The within class scatter matrix in the feature space is given as
Sw =
1 DDT M
The between class matrix is given as
(10)
50
JOURNAL OF MULTIMEDIA, VOL. 3, NO. 1, MAY 2008
C
S B = ∑ ni (mi − m)(mi − m)T
(11)
i =1
where c is the number of classes, ni is the number of
i , mi is the mean of that
samples belonging to class
class and m is the overall mean. A good criterion for class seperability should convert these scatter matrices to a number, which becomes larger when the between class scatter is large or the within class scatter is small. The KFD projection matrix consists of the eigenvectors corresponding to the largest eigenvalues of (12) S BV = λS wV . M
V = ∑ Ci φ(X i ) = Dα
(13)
i =1
where α = [C1 ,C2 ,...,CM ] and α ∈ IR . However, the scatter matrices reside in the high dimensional feature space and are difficult to evaluate. In practice, the kernel matrix K is computed by means of a kernel function rather than by explicitly implementing the nonlinear mapping φ . The nonlinear mapping, with a possibly prohibitive computational cost, is never implemented explicitly. KFD method applies kernel function in the input space to achieve the same effect of the expensive nonlinear mapping. It takes advantage of the Mercer equivalence condition and is feasible because the dot products in the high dimensional feature space are replaced by a kernel function in the input space while computation is related to the number of training examples rather than the dimension of the feature space. The scatter matrices reside in the high dimensional feature space and are difficult to evaluate. To evaluate this difficulty, S B and S w are replaced by the kernel matrix. (14) KWK α = λKK α . The generalized eigenvalue problem of (14) can be converted into an ordinary eigenvalue problem: T
M
(15) (KK + εI ) −1 (KWK )α = λα . where ε is a small positive regularization number and I an MXM identity matrix. The vector α should be normalized so that KFD basis vector V has unit norm:
V
2
= V T V = αT K α = 1 .
(16)
Let V1 ,V2 ,...,Vn (n ≤ L − 1) be the KFD basis vectors associated with the largest eigenvalues of (12) and α1 , α 2 ,..., α n be the corresponding normalized vectors of (12). The KFD projection matrix for training images becomes:
P = AT X where
(17)
A = [α1α 2...α n ] and A ∈ IR
© 2008 ACADEMY PUBLISHER
The similar features of test image are also computed. The Euclidean distance between training and test image feature is computed to classify the test image using the nearest neighbor classifier.
MXn
[13].
IV. WAVELET KERNEL FISHER CLASSIFIER (WKFC) Following steps explain the proposed algorithm in detail. A. Training Phase 1.
The Daubechies wavelet derives the facial multiresolution features by concatenating all the rows or columns of LL subimage in the decomposition. 2. These multiresolution features are nonlinearly mapped using the fractional power polynomial kernel to obtain the M x M kernel matrix K . 3. Compute the within class SW and between class S B matrices from K using (10) and (11) respectively. 4. Solve (12) to obtain a set of KFD basis vectors. 5. Project the nonlinearly mapped multiresolution features of training images on the KFD basis vectors (A).
X i = AT .X .
(18) These represent the reference feature vectors stored in the database.
B. Testing Phase 1. Compute the multiresolution features of test image. 2. Map these features nonlinearly into kernel space. 3. Project this test feature (Y ) on Kernel Fisher basis vectors.
Y = AT Y .
(19) 4. Compute the Euclidean distance between the test and training images. 5. Classify the test image using the nearest neighbor classifier. V. EXPERIMENTAL RESULTS In this Section, the performance of the proposed approach is evaluated using four databases: (1) Face Recognition Technology (FERET), (2) an Olivetti Research Laboratory (ORL), (3) Yale, and (4) YaleB. The effectiveness of this method is shown in terms of absolute performance index and comparative performance against some of the existing popular face recognition schemes. In the first part of this section, we have briefly described the databases, the characteristics of the images and the normalization procedure. This is followed by the experiments carried out for comparison. The proposed approach has been tested and compared with other algorithms for expression, and illumination variations. Following sets of experiments were carried out
JOURNAL OF MULTIMEDIA, VOL. 3, NO. 1, MAY 2008
1. 2. 3.
Testing the performance of algorithms for normal faces. Testing the performance of algorithms in facial expression variations. Testing the performance of algorithms in illumination variations.
A. Databases and Normalization The FERET database is designed to advance the state of the art in face recognition with the collected images directly supporting the development of algorithms and testing. It consists of more than 13,000 facial images corresponding to more than 1500 subjects. The illumination conditions, facial expressions, and the size of the face have been varied. The data set used in our experiments consists of 2000 FERET face images corresponding to 250 subjects, such that each subject has at least six images or more of size 256 X 384 with 8-bit resolution. Three galleries (training) and probes (testing) are used for evaluating the performances of the algorithms. The gallery is the set of known facial images, which are used for training. The images in the probe set are the unknown facial images to be recognized [14]. The ORL face database (developed at Olivetti Research Laboratory, Cambridge, U. K.) is composed of 400 images with ten different images for each of the 40 distinct subjects. The variations of the images are across pose, size, time and facial expression. The Yale face database was compiled by the centre for computational vision and control at Yale University. It contains 165 images of 15 subjects each of size 640 x 480, with 11 images per subject. The images vary in facial expressions and lighting conditions. The lighting is either from left or right of the face images. YaleB database consists of 5760 single light source images of 10 subjects each seen under 576 viewing conditions (9 poses x 64 illumination conditions) with each subject having 65 images under different lighting conditions, is often used to investigate the effect of illumination on face recognition. The spatial resolution of image is 640 x 480. The images from the FERET, Yale and YaleB databases are normalized to extract the facial regions that contain only face, so that the performances of the algorithms is not affected by the factors not related to the face. In normalization, the center of the eyes is detected manually and images are cropped to the size of 128 x 128 to extract the facial region. Fig .2 shows the normalized images from the FERET database.
51
comparison of the performance of the proposed approach, we implemented PCA [2] and its results were considered as baseline, LDA [5] is implemented after PCA is performed to reduce the dimensionality. KLDA [13] which derive more information because of nonlinear mapping is the third experiment for comparison. The performances of these algorithms are compared with the proposed WKFC algorithm. WKFC algorithm is tested for integer and fractional degree of polynomial. The highest recognition rate is obtained for polynomial degree d = 0.7 . This result is presented in the subsequent sections. B. Testing the performance of algorithm for normal faces: A normal face image is of frontal view, and under even illumination and with neutral expression. The algorithm was trained on galleries of different size of FERET database and recognition accuracy for different probes was computed. This result is presented in Table I. The recognition accuracies of the proposed approach under normal conditions on different databases are presented in Table II. The proposed algorithm has attained the better performance than other known approaches. This is due to extraction of non redundant spatial frequency multiresolution component as a facial feature and nonlinear mapping performed on these features to extract more useful information. The effect of different combinations of components in decomposition (as specified by 4 to 6) on the performance of WKFC algorithm and are presented in Table III. The algorithm attains high recognition rate with low frequency component only. However performance improves marginally when low and high frequency components are used in feature vector. This is because of description of finer details in high frequency components useful in recognition process. The proposed approach is effective in dimensionality reduction and hence computationally efficient. TABLE I RECOGNITION ACCURACY OF WKFC FOR DIFFERENT GALLERIES AND PROBES USING THE FERET DATABASE. Gallery Gallery size/ Probe size PCA LDA KLDA WKFC
% Recognition Rate Gallery 2 Gallery 3 500/750 750/1000 87 88.5 89.3 94.3
88 90.3 92 95.2
TABLE II FACE RECOGNITION RESULTS UNDER NORMAL CONDITIONS BASED ON DIFFERENT DATABASES.
Fig. 2 Normalized face images from the FERET database To evaluate the performance of the proposed approach following experiments were carried out. For the
© 2008 ACADEMY PUBLISHER
Gallery size / Probe size PCA LDA KLDA WKFC
FERET 750/1000 88 90.3 92 95.2
% Recognition Rate ORL Yale 120/200 45/75 88 88.7 90.5 92 91.5 95 95 96.8
YaleB 30/90 90 94 96 97.2
52
JOURNAL OF MULTIMEDIA, VOL. 3, NO. 1, MAY 2008
TABLE III PERFORMANCE OF WKFC FOR DIFFERENT COMPONENTS IN DECOMPOSITION (FERET DATABASE). Component in decomposition
% Recognition Rate
X i = YLL
95
X i = YLL + YLL1 + YLL 2
95.2
X i = YLL 2 + YH H
95.8
approach using different type of Daubechies wavelet was also investigated. The result is presented in Table VI. It has been observed from the experimental results that the best performance of the proposed algorithm is obtained for dB3 wavelet because of its symmetry, compact support and the use of overlapping windows to reflect all changes between pixel intensities of an image. TABLE VI TYPE OF WAVELET AND THE RECOGNITION RATE OF WKFC ON DIFFERENT DATABASES. Sr.no.
C. Testing the performance of algorithms in facial expression variations: Experiments based on the face images with different facial expressions were conducted to evaluate the performance of the proposed approach using FERET, ORL, and Yale databases. The result is presented in Table IV. The performance of the proposed algorithm is not affected by the facial expression variations when only low frequency components are selected in the facial features. However, when high frequency components are included in the feature, the performance is affected by the variations in facial expression. This is because facial expressions are formed from the local distortions of the facial feature points which contribute in the high frequency components in the decomposition. TABLE IV FACE RECOGNITION RESULTS OF WKFC UNDER DIFFERENT FACIAL EXPRESSIONS ON DIFFERENT DATABASES. Gallery size/ Probe size PCA LDA KLDA WKFC
% Recognition Rate FERET ORL 500/350 80/63 85 87.4 78 75.3 90 89 94.2 93
Yale 30/75 88.3 65 92.4 92.5
D. Testing the performance of algorithm under different illumination conditions: The effect of illumination variation on face recognition using FERET and YaleB databases was investigated and the result is given in Table V. In this experiment, low frequency subimage after removing the DC component which corresponds to the average brightness (illumination) is selected as the facial feature to make the approach invariant to illumination variations. TABLE V FACE RECOGNITION RESULTS UNDER DIFFERENT ILLUMINATION CONDITIONS ON DIFFERENT DATABASES. Gallery size/ Probe size PCA LDA KLDA WKFC
% Recognition Rate FERET YaleB 500/350 30/75 54 62.2 76.2 79.8 77.4 78.9 94.6 96.5
E. Performance of WKFC for different types of Daubechies wavelet: The performance of the proposed
© 2008 ACADEMY PUBLISHER
1 2 3 4 5 6 7 8
Type of wavelet dB1 dB3 dB6 dB9 dB12 dB15 dB18 dB21
FERET 94 95.5 94.3 95.3 95.46 95 95.4 95.13
ORL 93 95 94.5 94.5 94.5 94 95 95
VI CONCLUSIONS In this paper, a new technique for face recognition which uses DWT to derive the multiresolution features has been presented. Daubechies wavelet first derives desirable facial features. The KFD algorithm is implemented on the multiresolution features. The algorithm takes less running time because of reduced dimensionality of multiresolution feature vectors. The recognition rate is slightly improved when high frequency component in the decomposition along with low frequency component are selected in the facial feature vector. However performance degrades in presence of facial expression variation. When only low frequency image is selected, the approach is invariant to expression variations. The approach is also invariant to illumination changes if DC component in low frequency subimage is removed before it is concatenated to form the image feature vector. With the proposed approach, the recognition rates based on FERET, ORL, Yale, and YaleB databases are 95.5%, 95%, 96.8, and 97.2% respectively.
References [1] Y. Adini, Y. Moses, and S. Ullman, “Face Recognition: The problem of compensating for changes in illuminations Direction,” IEEE Transactions on Pattern Analysis and Machine Intelligence, vol. 19, no. 7, pp. 721-732, July 1997. [2] Mathew Turk, and Alex Pentland, “Eigenfaces for Recognition,” Journal of Cognitive Neuroscience, vol. 13, no. 1, pp. 71-86, 1991. [3] Chengjun Liu, and Harry Wechsler, “Independent Component Analysis of Gabor Features for Face Recognition,” IEEE Transactions on Neural Network, vol. 14. no. 4, pp. 919-928, 2003. [4] Xudong Xie, and Kin-Man Lam, “Gabor – Based Kernel PCA with Doubly nonlinear Mapping for Face Recognition
JOURNAL OF MULTIMEDIA, VOL. 3, NO. 1, MAY 2008
with a Single Face Image,” IEEE Transactions on Image Processing, vol. 15, no. 9, pp. 2481-2492, 2006. [5] P. N. Belhumeur, J. P. Hespanha, and D. J. Kriegman, “Eigenfaces vs. Fisherfaces: Recognition using class specific linear projection,” IEEE Transactions on Pattern Analysis and Machine Intelligence, vol. 19, no. 7, pp. 711– 720, 1997. [6] Jing X. Y., Tang Y. Y., and Zhang D., “A Fourier – LDA Approach for Image Recognition,” Pattern Recognition, vol. 38, no. 2, pp. 453-457, 2005. [7] Guang Dai, Dit Yan Yeung, and Yun Tao Qian, “Face Recognition Using a Kernel Fractional Step Discriminant Analysis Algorithm,” Pattern Recognition, vol. 40, pp. 229-243, 2006. [8] Jen Tzung Chien, and Chia Chen Wu, “Discriminant Waveletfaces and Nearest Feature Classifiers for Face Recognition,” IEEE Transactions on Pattern Analysis and Machine Intelligence, vol. 24, no. 12, pp. 1644- 1649, 2002. [9] Dattatray V. Jadhav, and Raghunath S. Holambe, Multiresolution Featured Based Kernel Fisher Classifier for Face Recognition, 4th IEE International Conference on Information Technology: New Generation (ITNG-07), Los Vegas, Newada, (2007), 848-853. [10] S. Mallat, “A Theory of Multiresolution Signal Decomposition: The Wavelet Representation,” IEEE Transactions on Pattern Analysis and Machine Intelligence, vol. 11, pp. 674-693, 1989. [11] C. Nastar and N. Ayach, “Frequency Based Nonrigid Motion Analysis,” IEEE Transactions on Pattern Analysis and Machine Intelligence, vol. 18, pp. 1067-1079, 1996. [12] A.Z. Kouzani, F. He, and K. Sammut, “Wavelet Packet Face Representation and Recognition,” Proceeding of IEEE Conference on Systems, Man, and Cybernetics, vol. 2, Orlando F L, USA, pp. 1614-1619, 1997. [13] Juwei Lu, Plataniotis K. N, A. N. Venetsanopoulos, “Face Recognition Using Kernel Direct Discriminant Analysis Algorithms,” IEEE Transactions on Neural Networks, vol. 14, no. 1, pp. 117-126, 2003. [14] P. J. Phillips, Hyeonjoon Moon, Sayed A. Rizvi, and Patric J. Rauss, “The FERET Evaluation Methodology for Face Recognition Algorithms,” IEEE Transactions on Pattern Analysis and Machine Intelligence, vol. 22, no. 10, pp. 1090-1104, 2000 .
Dattatray V. Jadhav received the B. E degree in Electronics engineering from Marathwada University in 1991 and M. Tech. degree in 1997 from Dr. BA Marathwada University, India. He is currently pursuing the Ph. D. degree at SGGS Institute of Engineering and Technology, Nanded, India. He is working as Assistant Professor in Electronic Engineering Department of Vishwakarma Institute of Technology, Pune. His areas of interests include computer vision, biometrics and image processing.
Jayant V. Kulkarni received the B. E degree in Electronics engineering from Marathwada University in 1990 and M. E. degree in 2000 from S. R. T. M. University, Nanded, India. He received his Ph. D. degree from the same university in 2008.
© 2008 ACADEMY PUBLISHER
53
Presently, he is working as professor in Instrumentation Engineering Department of Vishwakarma Institute of Technology, Pune. His research areas include pattern recognition in general and biometrics in particular.
Raghunath S. Holambe received B. E. and M. E. degree from S. G. G. S. Institute of Engineering and Technology, Nanded and Ph. D. degree from Indian Institute of Technology, Kharagpur in India. Presently, he is working as a professor in Instrumentation Engineering Department in S. G. G. S Institute of Engineering and Technology, Nanded (India). The areas of his research interest are digital signal processing, image processing, biometrics, and real time signal processing using DSP processors.