We present a multiresolution technique for interactive texture-based volume visualization of very large data sets. This method uses an adaptive scheme that ...
Multiresolution Techniques for Interactive Texture-Based Volume Visualization Eric LaMar∗ Bernd Hamann Kenneth I. Joy Center for Image Processing and Integrated Computing Department of Computer Science University of California, Davis 95616-8562
Abstract We present a multiresolution technique for interactive texture-based volume visualization of very large data sets. This method uses an adaptive scheme that renders the volume in a region-of-interest at a high resolution and the volume away from this region at progressively lower resolutions. The algorithm is based on the segmentation of texture space into an octree, where the leaves of the tree define the original data and the internal nodes define lower-resolution versions. Rendering is done adaptively by selecting high-resolution cells close to a center of attention and low-resolution cells away from this area. We limit the artifacts introduced by this method by modifying the transfer functions in the lower-resolution data sets and utilizing spherical shells as a proxy geometry. It is possible to use this technique to produce viewpoint-dependent renderings of very large data sets. Keywords: multiresolution rendering, volume visualization, hardware texture.
1
INTRODUCTION
The capability of computing technology has steadily increased for more than four decades and continues to increase rapidly. These increased computing capabilities have enabled applications to scale accordingly in overall throughput and resulting data set sizes. However, current visualization techniques break down when operating in this environment due to the massive size of the data sets. New techniques are necessary to provide exploration of large, multidimensional data sets. In this paper, we combine hardware-assisted texture mapping and multiresolution methods for rendering large volumetric data sets. The general idea is to assign priorities to different regions of the volume and to render the high-priority regions with highest accuracy, while lower-priority regions are rendered with progressively less accuracy, and progressively faster. We use an octree to decompose texture space and produce several coarser levels of the original data set. Each level is associated with ∗ {lamar,hamann,joy}@cs.ucdavis.edu
a level in the octree and each level is half the resolution of the next level. The leaf nodes are associated with the original resolution, and the root node with the coarsest resolution. The interior nodes are created by subsampling the node’s eight child nodes. Rendering a volume involves traversing the octree and applying a selection filter to each node. Three results are possible: (1) The node (and its children) are skipped entirely; (2) the node is skipped, but its children are visited; or (3) the node is rendered, and the children are skipped. The selected nodes are then sorted and rendered in back-to-front order. We use spherical shells for proxy geometries for accuracy under perspective projections. Section 2 contains a survey of related work. Section 3 discusses data issues for the multiresolution representation of textures, and Section 4 addresses the rendering of these textures. Section 5 shows results of the method on a number of data sets and gives performance results. Conclusions and future work are presented in Section 6.
2
RELATED WORK
High-performance computer graphics systems are evolving rapidly. Silicon Graphics, Inc. (SGI) has been a primary developer of this rendering technology, introducing the RealityEngine graphics system [1] in 1994 and the InfiniteReality graphics system [2] in 1998. SGI has also extended its graphics library OpenGL [3], [4] to take advantage of this hardware. These systems provided the initial capability for hardware-based rendering using solid textures. Cabral et al. [5] show that volume rendering and reconstruction integrals are generalizations of the Radon and inverse Radon transforms. They show that the Radon and inverse Radon transforms have similar mathematical forms, and by developing this relationship, show that both volume rendering and volume reconstruction can be implemented with hardware-accelerated textures. Thus, their algorithms execute many times faster than traditional software approaches. Cullip and Neumann [6] discuss general implementation issues for hardware textures and are the first to generate pictures using this technique based on two different transfer functions. Their work illustrates the superiority of viewport- versus object-aligned sampling planes. Wilson et al. [7] and Van Gelder and Kim [8] develop the mathematics for generating texture coordinates. Van Gelder and Kim also introduce a quantized gradient method for shading. Here, a triangulated sphere describes quantized normals which, when coupled with a quantized set of material values, allows the construction of a look-up table. For each new scene and texture block, the current viewing and lighting parameters are applied to the look-up table, and the look-up table is applied to the texture map as it is transfered to the texture subsystem. They report interactive rates, both for
Pixel Unused Half-Pixel
A0
Unused Half-Pixel
Tile
A1
Level A
0
1
2
3
4
5
6
7 0
1
2
3
4
5
6
7
B 0
0
Texture Function Domain
1
2
3
4
5
6
7
1
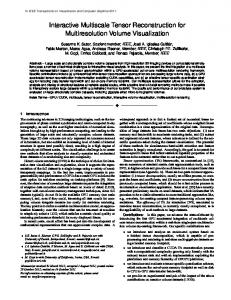
Figure 2: A texture hierarchy of two levels. Figure 1: A one-dimensional texture tile containing eight pixels. The tile is one pixel larger than the texture function domain. We assume that the half-pixels at the edges are constant.
Level 0 1
orthographic and perspective projections. However, low gradient regions show traditional quantization artifacts. Westerman et al. [9] show how to visualize isosurfaces resulting from rectilinear and unstructured grids. They use fragment testing to draw only those pixels that have a density value over a given threshold. Rectilinear grids are rendered by solid-texturing, which is shown to be much faster than the unstructured grid method. They also demonstrate how shade the texture-based isosurfaces with a technique that performs the shading as the texture map is transfered to the texturing subsystem. Grzeszczuk et al. [10] enumerate most methods for using hardware-accelerated texturing to provide interactive volume visualization. They also introduce a library for texture-based rendering called Volumizer, see [11]. Massively parallel computers have been used to provide interactive volume visualization and isosurface extraction, see [12], [13], [14], and [15]. Both ray-tracers and marching-cubes algorithms have been implemented, and both are very parallelizable. The overhead of data distribution and image composition is very high, and requires careful partitioning and tuning. Our new method differs from these prior approaches in the sense that we allow adaptive rendering of a volume. Prior algorithms assume that the data is “uniformly complex” and “uniformly important.” This is not the case, for example, in an immersive environment, where data closer to the viewer has more visual importance than data far away. Also, quality should be a “tunable” parameter: If a graphics supercomputer is not available or a user just wishes to quickly browse a data set, then the user will be satisfied with a poorer rendering quality.
3
GENERATING THE TEXTURE HIERARCHY
In hardware texturing algorithms, linear interpolation is used to interpolate the values at the centers of adjacent pixels. If we consider the one-dimensional example shown in Figure 1 and assume that the “tile” contains p pixels, then the texture function domain is the 1 2p−1 interval [ 2p , 2p ]. If the unused half-pixels are clipped, a larger texture can be broken into a set of smaller textures or tiles, where interior edge pixels are duplicated between adjacent tiles. This technique is known in the literature as “bricking,” see [10]. In Figure 2, we show a two-level texture hierarchy. The higherresolution texture is denoted as level A, with tiles A0 and A1 , and the lower-resolution one as level B. The grey regions at the ends are unused, and the grey region shared by A0 and A1 indicates the “overlay pixel.” The image represented by A can be approximated by B. The image represented by B has the same number of pixels as A0 or A1 , and half the number of pixels of A. We note that the natural relationship for two textures whose resolutions differ by
2 3
Texture Function Domain
Figure 3: A texture hierarchy of four levels. Level 0 is the original texture, broken into eight tiles. Overlapping pixels are shared between the tiles. The dashed lines show the texture function domain for each level.
a factor of two is using pixel-center alignment. In the binary tree arrangement defined by this one-dimensional texture B is the parent of A0 and A1 .
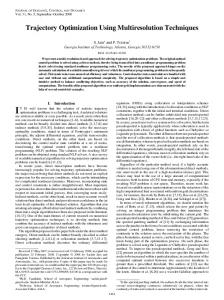
3.1 The Multiresolution Texture Hierarchy Figure 3 shows a one-dimensional texture hierarchy of four levels. The top level, level 0, is the original texture, broken into eight tiles; level 1 contains four tiles at half of the original resolution; level 2 contains two tiles at a quarter of the resolution; and level 3 has one tile at an eighth of the original resolution. The dashed vertical lines on either side show the domain of the texture function over the entire hierarchy. The arrows denote the parent-child relationship of the hierarchy, defining a binary tree, rooted at the coarsest tile, level 3. Figure 4 illustrates the logic for selecting tiles in a multiresolution environment: The thick vertical line denotes a point of interest, p, and tiles are selected if the distance from p to the center of the tile is greater than the width of the tile. Start with the root tile and
Point of Interest Level 0 1 2 3 Final Image
Figure 4: Selecting tiles from a texture hierarchy of four levels. The vertical line represents a point of interest p. Tile selection depends on the width of the tile and the distance from the point.
Level 0 256 Tiles
Level 2 16 Tiles
Level 1 64 Tiles
�
Level 4 1 Tile
Level 3 4 Tiles
tile
�
Figure 6: Field-of-view selection filter. The projected angle β of the tile is less than half the field-of-view angle α. Final Image 49 Tiles
p
a tile size of 643 , the tile contains 262,144 voxels, 250,047 effective voxels and 12,097 extra voxels.
4
Figure 5: Selecting a tile set in two dimensions from a texture hierarchy of five levels. Given the point p, tiles are selected if the distance from the center of the tile to p is greater than the length of the diagonal of the tile. The selected tiles are shaded.
perform this selection until all tiles meet this criterion, or no smaller tiles exist. (This is the case on the left side of Figure 4.) Figure 5 shows a two-dimensional quadtree example. The original texture, level 0, has 256 tiles. The darker regions in each level show the portion of that level used to approximate the full image. The selection method is similar to the one-dimensional case: Select a node if the distance from the center of the node to the point p is greater than the length of the diagonal of the node. The original texture, divided into 256 tiles, requires 256 time units to render. The adaptive rendering requires 49 time units, which implies a speed-up factor of approximately five. This formulation extends in a straightforward manner to three-dimensional textures. We generate a texture hierarchy by subsampling textures.1 Subsampling chooses every other voxel when generating a lowerresolution data set; e.g., if A is a linear array of 2n elements and B is a linear array of n elements that approximates A, then we generate the elements of B as Bi = A2i , i = 0, 1, . . . , n − 1. How much memory is wasted by breaking a volume into bricks? The waste is generated by the outer layer of voxels, which is shared by adjacent tiles. If a brick has size n (n3 voxels) and is surrounded by a half-voxel layer of duplicate voxels, the effective size of a brick is n − 1, and there are n3 − (n − 1)3 “waste” voxels. The waste relative to the tile size is O(n2 /n3 ) = O(n−1 ), which means that as the tile size increases the relative waste decreases.2 If we choose 1 We have also tried several other methods, including averaging techniques, but the results are substantially better using subsampling for the data sets used in this study. 2 The total waste still increases.
RENDERING
The rendering phase is divided into three steps: (1) Selecting tiles to render; (2) sorting the tiles; and (3) rendering the tiles using a proxy geometry.
4.1
Selecting Tiles
The first rendering step determines which tiles will be rendered. The general filtering logic starts at the root tile and performs a depth-first traversal of the octree. At each tile, we evaluate a selection filter, which returns one of three possible responses: • Ignore this tile and all of its children. This response is used to cull the tree. For example, if a tile is not in the view frustum, then we can ignore the tile and its children. • The tile satisfies all criteria. Render the tile and do not consider the children. • The tile does not satisfy the criteria. Check the children of the tile. Our primary selection filter is based on one of the following criteria: • Distance. This filter selects a tile if the distance from the viewpoint to the center of the tile is greater than the diagonal length of the tile. • Field-of-View. This filter selects a tile if it intersects the view frustum and the projected angle of the tile is less than half the view frustum’s field-of-view angle, see Figure 6. Tiles must be sorted and composited in back-to-front order. We order tiles with respect to a view direction such that, when drawn in this order, no tile is drawn behind a rendered tile. The order is fixed for the entire tree for orthogonal projections, and has to be computed just once for each new rendering, see [10]. The order is not fixed for perspective projections, and it must be computed at each new node.
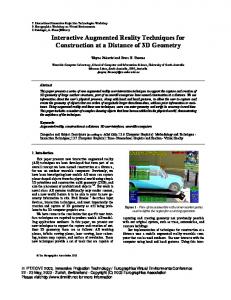
(a) Figure 7: Spherical shells intersecting the voxelized data set. These shells provide a proxy geometry that can be adapted to the location of the viewpoint.
4.2
Proxy Geometries
Texture-based volume visualization requires proxy geometries on which to render the texture. Object-aligned planes and viewportaligned planes are two traditional techniques, but they lead to serious artifacts under perspective projections. To deal with these artifacts, we use “spherical shells” – finely tessellated concentric spheres surrounding the viewpoint, culled to the view frustum. Figure 8 shows the differences when object-aligned planes, viewport-aligned planes, and spherical shells are used as proxy geometries on a constant texture defined over a cube. Object-aligned planes (OAP) are implemented with twodimensional textures on polygons aligned with the xy-, yz-, and xz-planes of the volume. This is the fastest method, and it is supported by most contemporary graphics workstations. However, three sets of polygons must be maintained. If only one set is used, certain viewpoints will lead to an “edge-on situation,” and nothing will be rendered. Also, the light attenuation is not computed correctly as the projected distance between polygons is not constant. This error is worst for an angle of 45o . Figure 9 illustrates multiresolution OAP in two dimensions. Here, OAPs planes must be generated independently for each tile, generating substantial artifacts at the boundaries of the tiles. Viewport-aligned planes (VAP) are implemented with threedimensional textures and polygons that are aligned parallel to the viewport. Only one texture set is required. All orthographic projections yield visually correct results. Three-dimensional texturing is currently only supported on high-end workstations. Rendering based on VAPs is generally less than half as fast as OAPs because (1) the Nyquist sampling theorem requires twice the number of polygons as OAPs requires, and (2) the underlying computations are more complex. Figure 10 shows the use of multiresolution VAPs. This technique creates strong artifacts under perspective projections. The tiles are rendered with a differently oriented set of polygons, and these polygons do not meet at the tile borders. This creates an artifact reminiscent of the “cracking” artifact from multiresolution polygonal schemes, and it manifests itself as light-and-dark alternating bands at the tiles boundaries. Viewpoint-centered spherical shells (VCSS) are implemented with three-dimensional textures and use concentric spherical shells centered at the viewpoint, culled to the view frustum. This technique does not produce artifacts under perspective projections, but it is slower than VAPs due to the increased geometric complexity required to approximate a spherical shell. In Figure 7, the view-
(b)
(c) Figure 8: Differences between (a) object-aligned planes; (b) viewport-aligned planes; and (c) spherical shells on a constant texture. Note the artifacts at the “tile boundaries” visible in (b).
Figure 9: Multiresolution object-aligned planes. The proxy geometry is generated independently for each tile.
���
���
��
���
�
�
Figure 12: When the space is sampled at two different resolutions, the colors C and C ? should be the same. point is on the left-hand side, almost touching the volume. The sample interval is exaggerated to show the structure – one shell every two voxels. Figure 11 illustrates multiresolution VCSSs. Using this approach, one can achieve continuity across tile faces.
4.3 Figure 10: Multiresolution viewpoint-aligned planes. The proxy geometry is generated independently for each tile. Substantial artifacts can appear at the boundaries.
Preserving Visual Properties
When rendering tiles at different levels of the hierarchy, the opacity properties of the tiles are different. The classical rendering algorithms depend on using the same sampling along rays for each pixel, see [16]. But in the context of a multiresolution format, the the volume is sampled in different ways, and at varying resolutions. To preserve optical properties between tiles of different resolutions, we must modify the transfer functions for those tiles generated by subsampling the original texture. Figure 12 shows an example where we have sampled a texture with spherical shells at two different resolutions – one is half the resolution of the other. Each sample si has an associated color ci and an opacity value αi . The light emitted by si is a function of the incoming light, and the color and opacity properties of the sample itself. Following [16], the color C resulting from the higherresolution sampling is C = α0 c0 + (1 − α0 )C1 ,
(1)
where C1 is the incoming color from samples s1 , s2 , ... – that is C1 = α1 c1 + (1 − α1 )C2 ,
(2)
where C2 is the incoming color from samples s2 , s3 , ... For the coarse resolution, the color C ? is given by C ? = α0? c0 + (1 − α0? )C2? ,
(3)
where C2? is the color calculated as a result of the samples s4 , s6 , ... By considering only the first three samples, the resulting colors C and C ? are given by C =α0 c0 + (1 − α0 )α1 C1 + (1 − α0 )(1 − α1 )C2 and C
Figure 11: Multiresolution viewpoint-centered spherical shells. The differences between sampling on the boundaries of the tiles is relatively small.
?
=α0? c0
+ (1 −
α0? )C2? ,
(4) (5)
and these quantities, in general, are different. However, if we compute the total-accumulated opacities A and A? , we obtain A =α0 + (1 − α0 )α1 + (1 − α0 )(1 − α1 )A2 and A? =α0? + (1 − α0? )A?2 .
(6) (7)
Assuming that the accumulated opacities are equal at the even samples, it follows that A2 = A?2 and A = A? , i.e., α0 + (1 − α0 )α1 + (1 − α0 )(1 − α1 )A2 = α0? + (1 − α0? )A2 . (8)
Model Data Set Size Tile Size Number of Tiles (Fixed Tile Size) Number of Tiles (Mulriresolution) Time (OAP) (Fixed Tile Size) Time (OAP) (Mulriresolution) Time (VAP) (Fixed Tile Size) Time (VAP) (Mulriresolution) Time (VCSS) (Fixed Tile Size) Time (VCSS) (Mulriresolution)
Horse Metacarpus 1282 × 108 163 391 195 0.848 0.424 1.51 0.964 2.87 1.530
Immersive Auditory 1263 163 237 64 0.419 0.123 1.10 0.683 1.73 0.830
Trebecular Bone 2563 163 1049 397 2.25 0.853 4.20 2.23 8.94 3.93
Table 1: Rendering times for the various data sets. All times are in seconds.
interesting features are inside the data set. Figures 14f–i show two views of this data set, one from just outside the data set, and one from the interior. The respective viewpoints and bricks associated with the views are shown in Figures 14f and 14h, while the resulting renderings are shown in Figures 14g and 14i. The third image is a rendering of data generated from an immersive auditory interface system, shown in Figure 14j. This data set has a “channel” in the middle of the volume. An image from the interior of the channel is shown in Figures 14k and 14l. Statistics concerning the rendering times for the various algorithms applied to the three data sets are given in Table 1.
Figure 13: The horse metacarpus data set.
Solving this equation for α0? , one obtains α0? = α0 + (1 − α0 )α1 = 1 − (1 − α0 )(1 − α1 ).
(9) (10)
By assuming that α1 = α0 + � (where � is a very small number), we obtain the equation α0? = 1 − (1 − α0 )(1 − α1 ) = 1 − (1 − α0 )(1 − α0 ) + �(1 − α0 ) = 1 − (1 − α0 )2 + O(�).
(11) (12) (13)
Therefore, we modify the transfer function of the parent (coarser) texture by α? = 1 − (1 − α)2
(14)
for all opacity values in the subsampled texture to minimize the artifacts between the texture bricks. This formula is used when applying the transfer function to a level of the texture hierarchy.
5
RESULTS
We have implemented our algorithm and applied it to several complex data sets. All data sets were rendered on an SGI Onyx2 computer system with .5 gigabytes of main memory, using a single 195Mz R10000 processor. The first data set is a CT scan of a horse metacarpus. This data set consists of 128 × 128 × 108 voxels. Figure 13 shows this data set. The primary feature of this data set is the “empty interior” of the bone, which can be visualized only from close inspection of one end. Figures 14a and 14b were generated using fixed tile sizes, while Figures 14c and 14d were generated using our multiresolution technique. In Figure 14a, we show the viewpoint and bricks associated with the rendering in Figure 14b. In Figure 14c, we show the bricks used for the adaptive rendering of the texture, resulting in the image in Figure 14d. The second image is a rendering of a trebecular bone data set, shown in Figure 14e. The data set consists of 2563 voxels, and the
6
CONCLUSIONS
We have described a new method for building and rendering a multiresolution texture hierarchy approximation for very large data sets. The approach utilizes a “bricking” strategy, where the displayed bricks are selected from an octree representation. Despite the fact that our overall system is limited by the amount of available texture memory, the algorithm produces very good results, and we expect that this approach will have a major impact on the huge volumetric data sets that are currently encountered in numerous applications. Future work will involve the extension of the technique to vector fields and the parallelization of our algorithm.
7
ACKNOWLEDGMENTS
This work was supported by the National Science Foundation under contract ACI 9624034 (CAREER Award), the Office of Naval Research under contract N0001497-1-0222, the Army Research Office under contract ARO 36598-MA-RIP, the NASA Ames Research Center through an NRA award under contract NAG21216, the Lawrence Livermore National Laboratory through an ASCI ASAP Level-2 Award under contract (W7405-ENG-48 and B335358, B347878), and the North Atlantic Treaty Organization (NATO) under contract CRG.971628 awarded to the University of California, Davis. We also acknowledge the support of Silicon Graphics, Inc. The equine metacarpal data set was provided by Dr. C.M. Les of the JD Wheat Veterinary Orthopedic Research Laboratory at the University of California, Davis. The trebecular bone data set was provided by Tait Smith of the Mechanical and Aeronautical Engineering Department at the University of California, Davis, and the auditory interface data set was provided by Carlos Avendano of CIPIC. We would like to thank all members of the Visualization Group at CIPIC for their help.
References [1] K. Akeley, “RealityEngine graphics,” Computer Graphics, vol. 27, no. Annual Conference Series, pp. 109–116, 1993. [2] J. S. Montrym, D. R. Baum, D. L. Dignam, and C. J. Migdal, “Infinite Reality: a Real-Time Graphics System,” in Proceedings of Siggraph 97, pp. 293–302, ACM, Aug. 1997. [3] M. Segal and K. Akeley, The OpenGL Graphics System: A Specification (Version 1.2). Mountain View, CA,USA: Silicon Graphics Computer Systems, 1998. [4] T. McReynolds and D. Blythe, SIGGRAPH ’98 ”Advanced Graphics Programming Techniques Using OpenGL” course notes. ACM, July 1998. [5] B. Cabral, N. Cam, and J. Foran, “Accelerated volume rendering and tomographic reconstruction using texture mapping hardware,” in 1994 Symposium on Volume Visualization (A. Kaufman and W. Krueger, eds.), pp. 91–98, ACM SIGGRAPH, Oct. 1994. ISBN 0-89791-741-3. [6] T. J. Cullip and U. Neumann, “Accelerating volume reconstruction with 3D texture hardware,” Tech. Rep. TR93-027, Department of Computer Science, University of North Carolina - Chapel Hill, May 1 1994. [7] O. Wilson, A. Van Gelder, and J. Wilhelms, “Direct volume rendering via 3D textures,” Tech. Rep. UCSC-CRL-94-19, University of California, Santa Cruz, June 29 1994. [8] A. Van Gelder and K. Kim, “Direct volume rendering with shading via three-dimensional textures,” in 1996 Volume Visualization Symposium, pp. 23–30, IEEE, Oct. 1996. ISBN 0-89791-741-3. [9] R. Westermann and T. Ertl, “Efficiently using graphics hardware in volume rendering applications,” in Proceedings of Siggraph 98, pp. 169–177, ACM, 19-24July 1998. [10] R. Grzeszczuk, C. Henn, and R. Yagel, SIGGRAPH ’98 ”Advanced Geometric Techniques for Ray Casting Volumes” course notes. ACM, July 1998. [11] G. Eckel, OpenGL Volumizer Programmer’s Guide. Mountain View, CA,USA: Silicon Graphics Computer Systems, 1998. [12] F. A. Ortega, C. D. Hansen, and J. P. Ahrens, “Fast data parallel polygon rendering,” in Proceedings, Supercomputing ’93: Portland, Oregon, November 15–19, 1993 (IEEE, ed.), pp. 709–718, IEEE Computer Society Press, Nov. 1993. [13] C. D. Hansen, M. Krogh, J. Painter, G. C. de Verdiere, and R. Troutman, “Binary-swap volumetric rendering on the T3D,” in Cray Users Group Conference, (Denver, Co.), Mar. 1995. [14] C. D. Hansen, M. Krogh, and W. White, “Massively parallel visualization: Parallel rendering,” in Proceedings of the 27th Conference on Parallel Processing for Scientific Computing (Bailey, David H., Bjørstad, Petter E., Gilbert, John E., Mascagni, Michael V., Schreiber, Robert S., Simon, Horst D., Torczon, Virginia J. and L. T. Watson, eds.), (Philadelphia, PA, USA), pp. 790–795, SIAM Press, Feb.15–17 1995. [15] C. D. Hansen and P. Hinker, “Isosurface extraction SIMD architectures,” in Visualization’92, Oct. 1992. [16] M. Levoy, “Display of surfaces from volume data,” IEEE Computer Graphics and Applications, vol. 8, pp. 29–37, Feb. 1987.
(a)
(b)
(c)
(d)
(e)
(f)
(g)
(h)
(i)
(j)
(k)
(l)
Figure 14: Multiresolution Texture-Based Volume Rendering