Instantaneous Frequency Estimation and its Application in Radar Signal. Analysis. Irena Orovic, Srdjan Stankovic, Thayananthan Thayaparan, and LJubiša ... modification is proposed in this paper. ... The short-time Fourier transform (STFT).
TIME-FREQUENCY SIGNAL ANALYSIS
1475
Multiwindow S-method for Instantaneous Frequency Estimation and its Application in Radar Signal Analysis Irena Orovi´c, Srdjan Stankovi´c, Thayananthan Thayaparan, and LJubiša Stankovi´c Abstract – A new distribution that provides high concentration in the time-frequency domain is proposed. It is based on the S-method and multiwindow approach, where different order Hermite functions are employed as multiple windows. The resulting distribution will be referred to as the multiwindow S-method. It preserves favorable properties of the standard S-method while the distribution concentration is improved by using Hermite functions of just a few first orders. The proposed distribution is appropriate for radar signal analysis, as it will be proven by experimental examples.
I. INTRODUCTION Various forms of time-frequency distributions have been used for the non-stationary signals analysis. Their applications cover many different fields: radars, sonars, biomedicine, image processing, etc. The simplest time-frequency representation is the shorttime Fourier transform. It localizes the spectral content around a time point by using a lag window. The energetic version of this transform is spectrogram. The spectrogram is very simple for realization, but generally, it provides low time-frequency resolution. Therefore, the quadratic time-frequency distributions have been introduced in order to provide better concentration in the time-frequency domain [1]-[3]. The most frequently used among them is the Wigner distribution that provides an ideal representation for linear frequency modulated signals. However, in the case of multicomponent signals, it suffers from undesired time-frequency components called crossterms. The S-method has been introduced to IET Signal Processing, Vol. 4, No. 4, Jan. 2010.
overcome this shortcoming of the Wigner distribution [4]. By using the S-method crossterms could be completely removed while the auto-terms concentration will be the same as in the Wigner distribution. It is simple for realization and has been successfully used in radar signals analysis [5], [6], speech signals analysis [7], [8], etc. A new distribution based on the S-method modification is proposed in this paper. It is achieved by introducing a set of Hermite functions that improve the standard S-method concentration. The Hermite functions act as multiple windows that satisfy a number of desirable properties. The STFT is calculated by using Hermite function of a certain order, and after that, it is weighted and convolved within the frequency window. Thus, each order of Hermite function produces one form of the Smethod. The cumulative distribution is obtained as their sum. In practical realizations the Hermite functions of a few first orders are sufficient to provide satisfactory results. The proposed distribution shows better properties for radar signal analysis than the standard Smethod. The paper is organized as follows. In Section II, the standard S-method is reviewed. The multiwindow S-method based on the Hermite functions is introduced in Section III. In Section IV, the efficiency of using the multiwindow S-method for obtaining high resolution radar data representation is demonstrated. Concluding remarks are given in Section V.
1476
TIME-FREQUENCY SIGNAL ANALYSIS
II. T � ������ B���� ��� — � � S-��� � The short-time Fourier transform (STFT) is the simplest tool for time-frequency signal representation. The STFT is obtained by sliding the window w(t) along the analyzed signal x (t) as follows: ST F T (t, ω) =
�∞
x(t + τ )w(τ )e−jωτ dτ . (1)
−∞
The spectrogram is defined as a square module of the STFT: SP EC(t, ω) = |ST F T (t, ω)|2 .
(2)
However, in most cases the spectrogram cannot provide high time-frequency resolution. The significant improvement of the timefrequency resolution is achieved by using the quadratic time-frequency distributions, such as the Wigner distribution. In order to produce the same auto-terms concentration as in the Wigner distribution but to remove the cross-terms, the S-method has been introduced. The appropriate timefrequency representation is obtained by combining the values of the STFT along the frequency axis as follows [4]: SM(t, ω) = =
�∞
P (θ)ST F T (t, ω + θ)ST F T ∗ (t, ω − θ)dθ,
−∞
(3) where P(θ) represents a finite frequency domain window function. The discrete version of the S-method is given by: SM (n, k) = =
L �
l=−L
P (l)ST F T (n, k + l)ST F T ∗ (n, k − l),
(4) where n and k are the discrete time and frequency variables, respectively, while P(l ) is the window of the length 2L+1. By taking the rectangular window, the discrete S-method can be written as: SM(n, k) = |ST F T (n, k)|2 +
+2Re
� L � l=1
∗
�
ST F T (n, k + l)ST F T (n, k − l) .
(5) Note that the terms in summation improve the quality of spectrogram toward the quality of the Wigner distribution. The window P(l ) should be wide enough to enable the complete summation over the auto-terms. At the same time, in order to remove the cross-terms, it should be narrower than the minimal distance between the auto-terms. The convergence within P(l ) is very fast, providing a high auto-terms concentration with only a few summation terms. In many applications LK ), the multiwindow S-method contains (N -K )/2 phase derivatives (higher than the K -th derivative), which is half of their number in the case of multiwindow spectrogram. The spread factors for the spectrogram, the S-method, the multiwindow spectrogram and the multiwindow S-method are given in Table I. It is also important to note that the multiwindow S-method provides better resolution comparing to the standard S-method, similarly as the multiwindow spectrogram outperforms the standard one. An example demonstrating the efficiency of the multiwindow S-method is given in Fig 2. The signal is considered in the form: x(t) = exp(6πj cos(0.1πt) + 4πj cos(0.2πt)). The results obtained by using the spectrogram, the S-method, the multiwindow spectrogram and the multiwindow S-method are presented (Figs 2.a, b, c and d, respectively). The multiwindow distributions are obtained by using four Hermite functions (k=0,1,2,3). The parameter L=5 is used in the calculation of standard and multiwindow S-method. Observe that the multiwindow S-method in Fig 2.d provides better concentration than the other considered distributions. Also, the computational demands for the multiwindow Smethod are just slightly increased compared to the standard S-method having in mind that satisfactory results are achieved with a small number of Hermite functions.
Fig. 2. Time-frequency distributions of a signal x (t ): a) Spectrogram, b) S-method by using L=5, c) multiwindow spectrogram by using four Hermite functions, d) multiwindow S-method by using four Hermite functions and L=5
Based on the considered distributions, the instantaneous frequency is estimated in the presence of noise for several values of signal to noise ratio: SNR=5dB, SNR=7.5dB, and SNR=10dB. Mean square errors (MSE) are calculated in 40 realizations, while the average MSE is calculated as: E{M SE} =
N−1
2 � 1 � � E f(n) − f (n) , N n=0
where f(n) represents the true instantaneous frequency whilef (n) is the instantaneous frequency estimated by using the considered time-frequency distributions (TFD): f (n) = max T F D(n, m). m
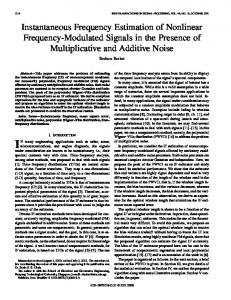
The results are presented in Table II. An illustration of the mentioned time-frequency distributions for a noisy signal: y(t) = x(t) + ν(t), is given in Fig 3 (for SNR=7.5dB). Observe that the multiwindow Hermite Smethod is less sensitive to noise than the other presented distributions. This is an additional advantage, especially in the case of real signals, that are usually corrupted by the noise. Additionally, it is important to emphasize that the Hermite S-method provides crossterms free representation for multicomponent
M ULTIW INDOW S-M ETHOD FOR INSTANTANEOUS FREQUENCY ESTIMATION...
1479
TABLE I S$ ��� !��� ! �� ����-! �%����& �� � ����� �
Distribution Spectrogram S-method Multiwindow Spectrogram with K functions
Spread factor 2 3 4 Q(t, τ) = φ2 (t) τ2! + φ3 (t) τ3! + φ4 (t) τ4! + ... 3 5 Q(t, τ) = φ3 (t) 2τ2 3! + φ5 (t) 2τ4 5! + ... K+1 τ τ K+2 Q(t, τ) = φ(K+1) (t) (K+1)! + φ(K+2) (t) (K+2)! +
Multiwindow S-method with K functions
even K
K+3
τ φ(K+3) (t) (K+3)! + ...
Q(t, τ ) (K+3)
φ odd K
Q(t, τ ) (K+4)
φ
K+1
φ(K+1) (t) 2Kτ(K+1)!
=
τ K+3 (t) 2(K+2) + ... (K+3)! (K+2)
=
K+2
τ (t) 2K+1 (K+2)!
φ
τ K+4 (t) 2(K+3) (K+4)!
+ +
+ ...
TABLE II M��� %�� � �
! � � �� ������� � ! �%����& � ������ � ! ��!!� ��� '���� ! �
Mean square Error (MSE) Spectrogram S-method Multiwindow Spectrogram Multiwindow S-method
SNR =5dB 45.41 40.33 24.17 13.77
signals in the same manner as the standard Smethod. Again in this case, the width 2L+1 of frequency domain window P(θ) should be narrower than the minimal distance between the auto-terms. An illustration of Hermite Smethod for multicomponent signal: z(t) = exp(3πj cos(0.1πt) + 2πj cos(0.2πt) + 12jt)+exp(4πj cos(0.15πt)+4πj cos(0.05πt)− 12jt), is given in Fig 4. The optimal weighting coefficients dk (n) in (11) are calculated according to [11]: K−1 � k=0
=
N/2−1
m=−N/2 A
dk (n) N/2−1
m=−N/2
2
(n + m)Ψ2k (m)mi
A2 (n
+ m)Ψ2k (m)
=
1, i = 0 , i = 0, 1, . . . , K − 1, (12) 0, i > 0
where A(n) is the signal amplitude, while N is the number of samples within the window function. Note that for constant amplitude within the window (A(n + m) = A(n)), the weighting coefficients are constants, given in Table III.
SNR =7.5dB 40.05 31.34 20.56 12.9
SNR =10dB 32.77 21.9 13 11.8
IV. A$$������ � ! M�������� � S-��� � ! �� �& � ����� ����
�$ � ������ � ! ��� ����� Efficiency of the multiwindow S-method will be also proven in the example with radar data. Hence, we provide a brief overview of the basic radar signal model and related target motion estimation. Consider a Doppler radar transmitting a signal in the form [17], [18]: ωs 2
s(t) = ejπ Tr t , 0 ≤ t ≤ Tr ,
(13)
where Tr is the repetition time. Commonly, the transmitted signal consists of M chirps: sM (t) = e−jω0 t
M−1 � m=0
s(t − mTr ),
(14)
where ω 0 is the radar operating frequency. Note that we can consider just one component of the received signal sm (t) = e−jω0 t s(t − mTr ). Furthermore, if the target distance from radar (also known as range) is d(t), the received signal is delayed with respect to the transmitted signal for 2d(t)/c:
1480
TIME-FREQUENCY SIGNAL ANALYSIS
TABLE III W��� ���� � �!!������ dk ! � � ���� ��$������ ����� ! K=1,. . . ,11
K=1 K=2 K=3 K=4 K=5 K=6 K=7 K=8 K=9 K=10 K=11
d0 1 1.5 1.75 1.875 1.937 1.968 1.984 1.992 1.996 1.998 1.900
d1
d2
d3
d4
D5
d6
d7
d8
d9
d 10
-0.5 -1 -1.375 -1.625 -1.781 -1.875 -1.929 -1.961 -1.978 -1.561
0.25 0.625 1 1.312 1.546 1.710 1.820 1.890 0.955
-0.125 -0.375 -0.687 -1 -1.273 -1.492 -1.656 -0.223
0.062 0.219 0.453 0.727 1 1.246 -0.357
-0.031 -0.125 -0.289 -0.507 -0.754 0.573
0.016 0.070 0.179 0.344 -0.460
-0.008 -0.039 -0.109 0.237
0.003 0.021 -0.079
-0.002 0.016
-0.001
) s(t − 2d(t) − mT ), r c (15) where c is the propagation rate equal to the speed of light, while σ is the reflection coefficient. The Doppler phase can be written as [17]: � t φr (t) = ∆ω d (τ)dτ , (16) sm (t) = σe−jω0 (t−
2d(t) c
0
where ∆ωd is the Doppler frequency shift. Thus, the phase of the received signal changes as follows: Fig. 3. Time-frequency distributions of a noisy signal y(t ): a) Spectrogram, b) standard S-method, c) multiwindow spectrogram, d) multiwindow Smethod
φr (t) =
(17)
where λ is the transmitted signal wavelength. According to (15) and (17), the Doppler frequency shift will be proportional to the target radial velocity: d 2ω 0 d 2ω 0 [φr (t)] = [d(t)] = υ(t). dt c dt c (18) The radar target may contain structures that produce mechanical vibrations or rotations, causing frequency modulation in the returned signal. This modulation is known as micro-Doppler phenomenon. The vibration of a reflecting surface may be measured with the phase change. Consequently, the Doppler frequency shift can be used to detect vibrations of structures on a target [18], [19]. The target can be observed as a set of primary reflecting points i.e. point scatterers [19]. ∆ωr (t) =
Fig. 4. An illustration of the Hermite S-method in the case of multicomponent signal
4π 2ω0 d(t) = d(t), λ c
M ULTIW INDOW S-M ETHOD FOR INSTANTANEOUS FREQUENCY ESTIMATION...
Assuming that the vibrating scatterer is set to a radian frequency oscillation of ω ν , its timevarying phase changes according to [19]: φ(t) =
4πDν sin(ω ν t), λ
(19)
where Dν is amplitude of the vibration and λ is the wavelength of the transmitted signal. The micro-Doppler frequency induced by the vibration can be obtained as: fD (t) =
1 dφ 2Dν ων = cos(ω ν t). 2π dt λ
(20)
The micro-Doppler signature caused by the vibrating structure is important for target identification, such as for example, human walking gait. The time-frequency signatures could be very suitable for this purpose, since the micro-Doppler of the vibrating scatterer is a time-varying frequency spectrum [18], [19]. Example: In this example we have considered a radar signal that captures human movements. The signal contains multiple physical movements taking place simultaneously. Various body parts have different shifts, since they are moving with various velocities. The strongest component corresponds to the main body movements, while the other components correspond to swinging arms and legs, etc. For example, the swinging arms induce frequency modulation of the returned signal and generate side-bands about the body Doppler. The standard spectrogram and the Smethod are calculated by using Hanning window and they are presented in Fig 5.a and Fig 5.b, respectively. Also, the spectrogram and the S-method obtained by using only one Hermite function (zero order function that corresponds to Gaussian window) are considered in Fig 5.c and Fig 5.d, respectively. The time domain windows of length 256 are used. The multiwindow spectrogram is shown in Fig 5.e, while the multiwindow S-method is presented in Fig 5.f. The multiwindow timefrequency representations are calculated by using five Hermite functions. Both the standard and the multiwindow S-method are calculated by using L=3, which provides crossterms free representation with good concentration of auto-terms. It has been shown that
1481
this is the optimal value for considered application. Higher value of parameter L would produces cross-terms, whose value would increase as L increases. Namely, after L has reached the value equal to the distance between the auto-terms, cross-terms start to appear. It is interesting to note that the standard S-method improves the concentration in comparison with the spectrogram. Some further improvements are achieved by using the multiwindow spectrogram. However, the multiwindow S-method outperforms both the standard S-method and the multiwindow spectrogram, which is especially emphasized in the region that corresponds to torso component. The standard S-method and multiwindow spectrogram can provide sufficiently good concentration for linear or almost linear frequency components. However, the Hermite S-method can further improve the concentration of components with higher nonlinearity. Note that good concentration of the Hermite S-method is achieved by using just a few orders (k=0,1,2,3,4) of Hermite functions. Namely, the presence of the fifth and higher order phase derivatives is not significant. Thus, higher number of Hermite functions (that would remove them) does not contribute to the concentration improvement.
V. C ���� � � The multiwindow S-method is developed from the idea to merge two efficient signal processing tools, the S-method and the Hermite functions, into a modified, highly concentrated time-frequency distribution. It exhibits good properties in the presence of noise, while regarding the concentration, outperforms both the standard S-method and the multiwindow spectrogram. This method provides very satisfying results even by using small number of Hermite functions and small number of samples within the frequency domain window. Therefore, it is computationally effective and suitable for realization. The efficiency of the proposed method is proven on the analytic signal, as well as on radar data.
1482
TIME-FREQUENCY SIGNAL ANALYSIS
Fig. 5. Time-frequency representations of radar signal: a) Standard spectrogram with hanning window, b) standard S-method by using hanning window, while L=3; c) Spectrogram with one Hermite function, d) Smethod with one Hermite function, e) Multiwindow spectrogram with 5 Hermite functions, d) Multiwindow S-method with five Hermite functions and L=3
R�!� ���� [1] [2] [3]
[4] [5]
Cohen, L.: ‘Time-Frequency distributions-A review’, Proc. IEEE, 1989., 77, 7, pp. 941-981. Boashash, B.: ‘Time-Frequency Analysis and Processing’, Elsevier, 2003, Amsterdam Boashash, B.: ‘Estimating and interpreting the instantaneous frequency of a signal-Part 1: Fundamentals’, Proc. of the IEEE, 1992, 80, 4, pp. 520-538. Stankovi´c, LJ.: ‘A method for Time-Frequency Signal Analysis’, IEEE Transaction on Signal Processing, 1994, 42, 1, pp. 225-229. Thayaparan, T, Stankovi´c, LJ., Wernik, C., and
[6]
[7] [8]
Dakovi´c , M.: ‘Real-time motion compensation, image formation and image enhancement of moving targets in ISAR and SAR using S-method based approach’, IET Signal Processing, 2008, 2, 3, pp. 247-264. Popovic, V., Dakovic, M., Thayaparan, T., and Stankovic, LJ.: ‘SAR Image Improvements by Using the S-method’, in Proc. IEEE ICASSP, 2006, 3, pp.III 177-III 180. Stankovic, S., and Tilp, J.: ‘Time-Varying Fltering of Speech Signals Using Linear Prediction’, Electronic Letters, 2000, 36, 8. Stankovic, S.: ‘About Time-Variant Filtering of
M ULTIW INDOW S-M ETHOD FOR INSTANTANEOUS FREQUENCY ESTIMATION...
[9] [10] [11]
[12]
[13] [14]
Speech Signals with Time-Frequency Distributions for Hands-Free Telephone Systems’, Signal Processing, 2000, 80, 9, pp. 1777-1785. Thomson, D. J.: ‘Spectrum estimation and harmonic analysis’, Proc. IEEE, 1982, 70, pp. 10551096. Frazer, G., and Boashash, B.: ‘Multiple window spectrogram and time-frequency distributions’, in Proc. IEEE ICASSP, 4, 1994, pp. 193-296. Cakrak, F., and Loughin, P. J.: ‘Multiwindow Time-Varying Spectrum with Instantaneous Bandwidth and Frequency Constraints’, IEEE Transactions on Signal Processing, 2001, 49, 8, pp. 1656-1666. Bayram, M., and Baraniuk, R. G.: ‘Multiple Window Time-Frequency Analysis’, Proc. of the IEEE Signal Processing International Symposium on Time-Frequency and Time-Scale Analysis, 1996, pp.173-176. Kortchagine, D. N., and Krylov, A. S.: ‘Projection Filtering in image processing’, Proc. of the Int. Conf. Graphicon 2000, pp.42-45. Krylov, A., and Kortchagine, D.: ‘Hermite Foveation’, Proceedings of the Int. Conference Graphicon 2004, pp. 166-169, Moscow, 2004.
1483
[15] Kutovoi, A.V., and Krylov, A. S.: ‘A New Method for Texture-based Image Analysis’, Proc. of Graphicon 2006, pp. 235-238, Novosibirsk, 2006. [16] Krylov, A. S., Kortchagine, D. N., Lukin, A. S.: ‘Streaming Waveform Data Processing by Hermite Expansion for Text-Independent Speaker Indexing form Continuous Speech’, Proc. of the Int. Conf. Graphicon 2002, pp. 91-98, Nizhi Novgorod 2002. [17] Billik, I., and Tabrikian, J.: ‘Radar Target Classification using Doppler Signatures of Human Locomotion Models’, IEEE Transactions on Aerospace and Electronic Systems, 2007, 43, 4, pp.1510-1522. [18] Chen, V. C., and Ling, H.: ‘Time-Frequency Transforms for Radar Imaging and Signal Analysis’, Artech House, CityBoston, Mass, USA, 2002. [19] Thayaparan, T., Stankovi´c , LJ., and Djurovi´c, I.: ’Micro-Doppler Based Target Detection and Feature Extraction in Indoor and Outdoor Environments’, Journal of the Franklin Institute, 2008, 345, 6, pp. 700-722.