Hindawi Publishing Corporation Shock and Vibration Volume 2015, Article ID 794921, 9 pages http://dx.doi.org/10.1155/2015/794921
Research Article Mutual Information-Assisted Wavelet Function Selection for Enhanced Rolling Bearing Fault Diagnosis Ruqiang Yan,1,2 Mengxiao Shan,1 Jianwei Cui,1 and Yahui Wu2 1
School of Instrument Science and Engineering, Southeast University, Nanjing, Jiangsu 210096, China Changcheng Institute of Metrology and Measurement, Aviation Industry Corporation of China, Key Laboratory of Science and Technology on Metrology & Calibration, Beijing 100095, China
2
Correspondence should be addressed to Ruqiang Yan;
[email protected] Received 28 February 2015; Revised 13 April 2015; Accepted 15 April 2015 Academic Editor: Changjun Zheng Copyright © 2015 Ruqiang Yan et al. This is an open access article distributed under the Creative Commons Attribution License, which permits unrestricted use, distribution, and reproduction in any medium, provided the original work is properly cited. This paper presents an enhanced rolling bearing fault diagnosis approach, based on optimized wavelet packet transform (WPT) assisted with quantitative wavelet function selection. Mutual information is utilized as a quantitative measure to select the most suitable wavelet function for the WPT-based vibration analysis. Energy features from coefficients of an optimal set of orthogonal wavelet subspaces which resulted from the WPT-based vibration analysis are input to different classifiers. The fault states of the rolling bearings can then be identified. Experiment studies conducted on a rolling bearing test system have verified the effectiveness of the proposed approach for rolling bearing fault diagnosis.
1. Introduction In modern industry, the rotating machine is one of the most important mechanical pieces of equipment and has been widely used in each field of industrial production. The performance of the key rotating components, such as bearings and gears, has a severe influence on the working status of the whole rotating machine [1] so that a weak defect of these components may eventually lead to the machine collapse or breakdown of the production. Therefore, fault diagnosis of these key rotating components has become current research trend. An important prerequisite for accurate diagnosis is to effectively extract characteristic features, which are indicative of faults, from signals measured on the rotating machine. As an effective tool for nonstationary signal analysis, wavelet transform and its extension, wavelet packet transform, have been widely used in feature extraction for fault diagnosis of rotating machines [2, 3]. For example, the statistical parameters were extracted from the collected signals obtained via the WPT at different decomposition depths and a support vector regressive (SVR)-based generic multiclass solver was proposed to identify the different fault patterns of rotating
machines [4]. The WPT was conducted to decompose multiclass signals into a library of time-frequency subspaces and the wavelet packet energy in each subspace was calculated to produce a feature vector for each signal for classification [5]. Renyi entropy values from subband coefficients of vibration signals were obtained to detect mechanical faults in rotational drives [6]. Such features were found to be sensitive to fault occurrence and robust to varying operating conditions. Sensitive subband feature set from the WPT-based signal decomposition was also extracted for classifying bearing faults [7]. In addition, the WPT was used to clean noisy signal before EEMD is applied to extracting informative feature vectors for early damage detection of rolling bearings [8]. An alternative empirical mode decomposition (EMD) method improved by WPT was developed to process the fault signals [9]. A preprocessing model of the bearing using WPT-EMD was constructed for feature extraction. Then it used self-organization mapping (SOM) for the condition assessment of the performance degradation [10]. Combined with manifold learning, the WPT was implemented to extract weak transient signal features for rolling bearing fault diagnosis [11]. Recently, a comprehensive review on wavelet transform for fault diagnosis of rotating machines has been conducted [3], where
2 the applications were summarized according to the following categories: continuous wavelet transform-based fault diagnosis, discrete wavelet transform-based fault diagnosis, wavelet packet transform-based fault diagnosis, and second generation wavelet transform-based fault diagnosis [3]. In addition, some new research trends have been discussed, among which wavelet function selection is considered as one of the important factors that affect the results of wavelet applications. This issue has also attracted more and more attention by the research community. For example, Rafiee et al. [12] used genetic algorithm to select proper Daubechies (Db) wavelet for gear fault diagnosis. They also compared 324 wavelet functions and found that Daubechies 44 wavelet showed the most similar shape across both gear and bearing vibration signals [13]. Jiang and Liu [14] applied 𝑡-test to validating the correlation between features extracted from DWT coefficients and the original signal and then applied the estimated probability from the 𝑡-test to guiding selection of wavelet functions. Yang and Ren [15] and Chen [16] utilized waveform matching method and similarity coefficient to select the optimal wavelet function for impact signal analysis. Schukin et al. [17] made use of the time-frequency window resolution and the estimation error of impact signal parameters to choose suitable wavelet functions. Li et al. [18–20] treated Shannon entropy as a measure to determine optimal wavelet function for lamb wave analysis and damage detection. Furthermore, Yan and Gao [21] investigated the energy measure for wavelet function selection in bearing vibration analysis. Later an energy-to-Shannon entropy ratio measure was also developed by Yan and Gao as a wavelet selection criterion for rotating machine fault diagnosis [22]. This criterion, together with maximum relative wavelet energy, was used by Kankar et al. to select appropriate wavelet function from six candidate wavelet functions for bearing defect-related feature extraction [23]. The energy-to-Shannon entropy ratio was also chosen by Wu et al. to guide the selection of wavelet functions for fault diagnosis of rolling bearings [24]. From these efforts, it can be seen that some of these researchers used qualitative method, such as waveform similarity method, to select wavelet functions, which largely relies on subjective assessment of the researchers. Other researchers designed quantitative measures calculated from wavelet coefficients directly to evaluate the similarity between signals and wavelet functions. In fact, the study of the relationship between wavelet coefficients and raw signals may be another outstanding angle for wavelet function selection, which has rarely been considered in previous studies in the field of fault diagnosis. Therefore, taking this relationship into consideration, this paper is intended to investigate a quantitative wavelet function selection method based on mutual information measure, with specific application for enhanced rolling bearing fault diagnosis. This paper is organized as follows. After introducing the basic knowledge of the wavelet packet decomposition, which is used as the tool for analyzing bearing vibration signals, the mutual information-based wavelet function selection is illustrated with numerical verification in Section 2. Then Section 3 presents the fault diagnosis method based on an optimized wavelet packet transform. After that, experimental studies are performed on a bearing test system to verify
Shock and Vibration the effectiveness of the proposed method in Section 4. Finally, conclusions are drawn in Section 5.
2. Wavelet Function Selection The essence of wavelet transform is to compare the signal 𝑥(𝑡) with a set of known functions {𝜓𝑛 (𝑡)}𝑛∈𝑧 and quantifies the similarity between the signal and the function. Such an operation can be mathematically expressed as 𝑤𝑡𝑛 = ∫
∞
−∞
𝑥 (𝑡) 𝜓𝑛∗ (𝑡) 𝑑𝑡,
(1)
where (⋅)∗ stands for the complex conjugate of the function (⋅). The set of functions {𝜓𝑛 (𝑡)}𝑛∈𝑧 are derived from a single wavelet function through a series of scaling (i.e., dilation and contraction, as denoted by the parameter 𝑠) and shifting (i.e., time translation, denoted by the parameter 𝜏) operations, as is expressed mathematically by 𝜓𝑠,𝜏 (𝑡) =
𝑡−𝜏 1 𝜓( ); √𝑠 𝑠
(2)
then (1) can be represented as 𝑤𝑡 (𝑠, 𝜏) =
𝑡−𝜏 1 ) 𝑑𝑡. ∫ 𝑥 (𝑡) 𝜓∗ ( √𝑠 𝑠
(3)
Through variations of the scales and time shifts of the wavelet function, the wavelet transform can extract signal features over the entire signal by using small scales for high frequency components and large scales for low frequency components. Generally, the wavelet transform can be represented in continuous (i.e., continuous wavelet transform) as well as in discrete forms (i.e., discrete wavelet transform). Dyadic discretization of the scaling parameter 𝑠 and shifting parameter 𝜏 leads to the formulation of orthogonal basis for the set of function 𝜓𝑠,𝜏 (𝑡); thus the discrete wavelet transform can be realized. 2.1. Wavelet Packet Decomposition. Wavelet packet decomposition is an extension of discrete wavelet transform and can be obtained by a generalization of the fast pyramidal algorithm [25]. Mathematically, a wavelet packet consists of a set of linearly combined wavelet functions, which are generated using the following recursive relationships: 𝜓2𝑘 (𝑡) = √2∑ℎ (𝑛) 𝜓𝑘 (2𝑡 − 𝑛) , 𝑛
𝜓2𝑘+1 (𝑡) = √2∑𝑔 (𝑛) 𝜓𝑘 (2𝑡 − 𝑛) ,
(4)
𝑛
where 𝜓0 (𝑡) = 𝜙(𝑡) is the scaling function and 𝜓1 (𝑡) = 𝜓(𝑡) is the wavelet function. The symbols ℎ(𝑛) and 𝑔(𝑛) represent coefficients of a pair of quadrature mirror filters (QMF) associated with the scaling function and wavelet function. Furthermore, ℎ(𝑛) and 𝑔(𝑛) are related to each other by
Shock and Vibration
3 Signal x(t)
G
H Level 1
x11 (t)
x10 (t) G
H Level 2
x20 (t)
H Level 3
H
x31 (t)
x32 (t)
G
x22 (t)
x21 (t) G
x30 (t)
H
G x33 (t)
H x34 (t)
x23 (t) G x35 (t)
H x36 (t)
G x37 (t)
Figure 1: Illustration of a 3-level WPT (H-low pass filter, G-high pass filter).
𝑔(𝑛) = (−1)𝑛 ℎ(1 − 𝑛). Using the QMF, a time-domain signal 𝑥(𝑡) can be decomposed recursively as 2𝑘 𝑥𝑗+1 (𝑡) = ∑ℎ (2𝑘 − 𝑚) 𝑥𝑗𝑘 (𝑡) , 𝑚
2𝑘+1 𝑥𝑗+1 (𝑡) = ∑𝑔 (2𝑘 − 𝑚) 𝑥𝑗𝑘 (𝑡) ,
(5)
𝑚
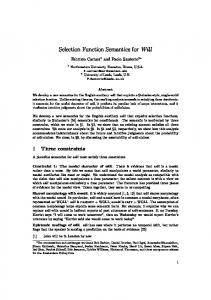
where 𝑥𝑗𝑘 (𝑡) denotes the wavelet packet coefficients at the 𝑗th level, 𝑘th denotes sub-frequency band, and 𝑥00 (𝑡) = 𝑥(𝑡). The symbol 𝑚 represents the number of the wavelet coefficients at the 𝑘th sub-frequency band within the level 𝑗. Figure 1 illustrates a 3-level decomposition of the signal 𝑥(𝑡). 2.2. Wavelet Selection Criterion. When the WPT is used to analyze vibration signals for rolling bearing fault diagnosis, a critical issue is to choose the most suited wavelet function for signal decomposition and feature extraction [22]. As it is known, the wavelet transform or wavelet packet transform can be considered as a kind of correlation calculation between the signals and the wavelet function in different scales. The more similar the signal and the wavelet function are, the more accurate the feature will be extracted by the wavelet analysis. In information theory, mutual information measures the information that the variables 𝑋 and 𝑌 share: it measures how much knowing one of these variables reduces uncertainty about the other. In other words, the mutual information measures the degree of similarity between two groups of data sequences; it is presented in this study to direct the selection of wavelet function. Mathematically, the mutual information is described as 𝐼 (𝑋; 𝑌) = ∑ ∑ 𝑝 (𝑥, 𝑦) log 𝑥∈𝑋 𝑦∈𝑌
𝑝 (𝑥, 𝑦) 𝑝 (𝑥) 𝑝 (𝑦)
= ∑ ∑ 𝑝 (𝑥, 𝑦) log 𝑝 (𝑥, 𝑦) 𝑥∈𝑋 𝑦∈𝑌
(6)
− ∑ 𝑝 (𝑥) log 𝑝 (𝑥) − ∑ 𝑝 (𝑦) log 𝑝 (𝑦) , 𝑥∈𝑋
𝑦∈𝑌
where 𝑝(𝑥, 𝑦) indicates the joint probability density of data sequences 𝑋 and 𝑌, 𝑝(𝑥) stands for the probability density of data sequence 𝑋, and 𝑝(𝑦) represents the probability
density of data sequence 𝑌. The mutual information determines how similar the joint distribution 𝑝(𝑥, 𝑦) is to the products of factored marginal distribution 𝑝(𝑥)𝑝(𝑦). Furthermore, in (6), − ∑𝑥∈𝑋 ∑𝑦∈𝑌 𝑝(𝑥, 𝑦) log 𝑝(𝑥, 𝑦) is the joint entropy of data sequences 𝑋 and 𝑌. − ∑𝑥∈𝑋 𝑝(𝑥) log 𝑝(𝑥) and − ∑𝑦∈𝑌 𝑝(𝑦) log 𝑝(𝑦) represent the Shannon entropy of data sequence 𝑋 and the Shannon entropy of data sequence 𝑌, respectively. Therefore, (6) can be expressed in another form: 𝐼 (𝑋; 𝑌) = −𝐻 (𝑋, 𝑌) + 𝐻 (𝑋) + 𝐻 (𝑌) .
(7)
This equation indicates that the mutual information is the sum of the entropies 𝐻(𝑋) and 𝐻(𝑌) minus the joint entropy 𝐻(𝑋, 𝑌). The relationships among entropies and mutual information are illustrated in a Venn diagram as shown in Figure 2. In Figure 2, it can be seen that the mutual information 𝐼(𝑋, 𝑌) is the intersection part of two data sequences. The greater the mutual information is, the more similar the two groups of data sequence will be. Such a relationship is applicable to wavelet selection for rolling bearing fault diagnosis by taking the vibration signal and wavelet packet coefficients as data sequences 𝑋 and 𝑌, respectively. It is expected that defect-induced transient vibration can be fully represented by the wavelet packet coefficients. In this study, raw vibration signals of rolling bearings are viewed as data sequence 𝑋. The reconstruction signals of the subband which contains the defect-induced transient components are viewed as data sequence 𝑌. Then the mutual information entropy can be used to evaluate the similarity between original vibration signals and the reconstruction signals using different wavelet functions. By comparison, the wavelet function that maximizes the mutual information between the vibration signal and the reconstruction signal represents the most appropriate wavelet for defect-induced transient vibration extraction. To evaluate the applicability of the mutual information for wavelet function selection, a simulation study is presented here. In the simulation, data sequence 𝑥 is the Daubechies 10 wavelet (denoted as Db 10 wavelet). The sample signal 𝑥(𝑡) is obtained by adding Gaussian white noise with signal-tonoise ratio (SNR) at 20 dB, which is viewed as data sequence 𝑋 and decomposed by the wavelet packet transform, while the reconstruction signal is viewed as data sequence 𝑌. The waveforms of Daubechies 10 wavelet, data sequence 𝑋, and data sequence 𝑌 are shown in Figure 3, respectively.
4
Shock and Vibration 100 50
H(X)
0 −50 −100
0
200
400 600 800 Data sequence X
1000
1200
I(X; Y)
H(X, Y)
50 0 H(Y)
−50 −100
0
200
400 600 800 Data sequence Y
1000
1200
Figure 2: Relationships among entropies and mutual information. 1.0
1.5 1.0 0.5 0 −0.5 −1.0 −1.5 0
0.5 0 −0.5 −1.0 −1.5
0
0.2
0.4
0.6
0.8
1.0
1.2
1.4
1.6
1.8
2.0 ×10⁴
0.2
0.4
0.6
(a)
0.8
1.0
1.2
1.4
1.6
1.8
2.0 ×10⁴
(b)
1.0 0.5 0 −0.5 −1.0 −1.5
0
0.2
0.4
0.6
0.8
1.0
1.2
1.4
1.6
1.8
2.0 ×10⁴
(c)
Figure 3: Waveform of (a) Daubechies 10 wavelet, (b) data sequence 𝑋, and (c) data sequence 𝑌.
Then the mutual information for each wavelet function can be calculated and the results are listed in Table 1. Since the sample signal is constructed by adding Gaussian white noise to the waveform of the Db 10 wavelet, in principle, it should be better characterized by the Db 10 wavelet itself. This is verified by the results shown in Table 1, as the Db 10 wavelet maximizes the mutual information between the sample signal and the reconstruction signal, which validate the effectiveness of the proposed quantitative wavelet selection method.
3. Fault Diagnosis Based on Optimized Wavelet Packet Transform With the wavelet function being chosen, the WPT can then be used to decompose the vibration signal for extracting features
to characterize rolling bearing faults. It can be seen from Figure 1 that there are multiple ways of decomposing a signal with the WPT. For the purpose of rolling bearing fault diagnosis, the challenge is to find a better representation of the signals that yields high discriminatory information among different bearing conditions. Therefore, an optimized wavelet packet transform (termed as OWPT) is applied to identifying the set of best subspaces that can provide maximum dissimilarity information between different classes of the signals, based on the local discriminant bases (LDB) algorithm [26]. The LDB algorithm is a pruning algorithm that can select an optimal set of complete orthogonal subspaces derived from the WPT. This algorithm has been successfully used in various engineering domains, such as audio signal analysis [27], physiological signal classification [28], and vibration data
Shock and Vibration
5 Table 1: Mutual information resulted from the simulation signal for different wavelets.
Wavelet function Haar Db2 Db4 Db6 Db8 Db10 Coif1 Coif2 Coif3 Coif4
Mutual information 20.325 24.268 24.297 24.307 24.294 24.313 24.265 24.245 24.286 24.265
Wavelet function Coif5 Sym2 Sym3 Sym4 Sym5 Sym6 Sym7 Sym8 Bior1.3 Bior2.4
processing [29, 30]. Specifically, if 𝐴 𝑗,𝑘 is used to represent the desired local discriminant basis restricted to the span of 𝐵𝑗,𝑘 , which is a set of basis vectors at (𝑗, 𝑘) subspace, then, for a given training dataset consisting of 𝐿 classes of signals 𝑁 {{𝑥𝑖(𝑙) }𝑖=1𝑙 }𝐿𝑙=1 with 𝑁𝑙 being the total number of training signals in class 𝑙, the LDB algorithm can be summarized as follows. (a) The wavelet packet transform is used to decompose the signals contained in the training dataset, and the time-frequency energy maps 𝐶𝑙 for 𝑙 = 1, . . . , 𝐿 on the wavelet packet coefficients can be constructed using the following equation: 𝑁
2
∑𝑖=1𝑙 ∑𝑚 (𝑥𝑗𝑘 (𝑚)𝑖 (𝑙) ) . 𝐶𝑙 (𝑗, 𝑘, 𝑚) ≡ 2 𝑁 ∑𝑖=1𝑙 𝑥𝑖(𝑙)
(8)
(b) Suppose that 𝐴 𝐽,𝑘 = 𝐵𝐽,𝑘 and set Δ 𝑗,𝑘 = 𝐷({𝐶𝑙 (𝑗, 𝑘, 𝑚)})𝐿𝑙=1 , where 𝐷(⋅) represents the dissimilarity measure to characterize the signal classification capability; then the best subspaces 𝐴 𝑗,𝑘 for 𝑗 = 𝐽 − 1, . . . , 0 and 𝑘 = 0, . . . , 2𝑗 − 1 can be obtained through a bottom-up search as follows. If Δ 𝑗,𝑘 ≥ Δ 𝑗+1,2𝑘 + Δ 𝑗+1,2𝑘+1 , namely, the dissimilaritymeasure of the parent subspace is greater than those of cumulative the children subspace. Then 𝐴 𝑗,𝑘 = 𝐵𝑗,𝑘 . Else 𝐴 𝑗,𝑘 = 𝐴 𝑗+1,2𝑘 ⊕ 𝐴 𝑗+1,2𝑘+1 and set Δ 𝑗,𝑘 = Δ 𝑗+1,2𝑘 + Δ 𝑗+1,2𝑘+1 . (c) After a complete set of orthogonal subspaces are found in the decomposition results, they can be ranked from higher to lower based on their discrimination power. It should be noted that the optimal choice of the complete subspaces for a given dataset is significantly affected by the dissimilarity measures used to distinguish between classes, as the dissimilarity measure indirectly controls the classification accuracy. Therefore, a good dissimilarity measure should be able to differentiate various classes as much as possible. Considering that a single dissimilarity measure for the optimal subspace selection may not be able to capture all the characteristic information of the signals, both the relative entropy, which describes the difference of energy distribution
Mutual information 24.302 24.288 24.273 24.257 24.274 24.273 24.280 24.284 20.317 24.280
Wavelet function Bior2.6 Bior4.4 Bior5.5 Bior6.8 rBio1.3 rBio2.4 rBio2.6 rBio4.4 rBio5.5 rBio6.8
Mutual information 24.284 24.241 24.279 24.264 24.277 24.254 24.274 24.257 24.280 24.296
in different classes of signals, and the normalized energy difference between different classes of signals are used as the dissimilarity measures in this study, which have been identified as good measures for classification. The details of these two measures can be seen in [30]. Features from these subspaces can then be extracted to distinguish different classes in a given set of data that belong to several classes. Therefore, an enhanced rolling bearing fault diagnosis scheme can be designed as shown in Figure 4. Vibration signals from each of the classes are decomposed using the WPT with the selected wavelet function. Then the LDB algorithm is used to identify the set of best subspaces that provide maximum dissimilarity information between different classes of the signals. Once the optimal discriminatory subspaces are identified, the energy feature of wavelet packet coefficients from each subspace is then calculated. These features have better discriminatory capability and are chosen as inputs to a diagnostic classifier for characterizing rolling bearing faults.
4. Experimental Study In order to verify the effectiveness of the proposed rolling bearing fault diagnosis approach, experimental study was conducted, where the data were collected on a bearing test system (Figure 5) from the Case Western Reserve University Bearing Data Center [31]. The system consists of a 2-horse power (hp) motor, a torque transducer, a dynamometer, and control electronics. Single point faults with the size of 0.18 mm, 0.36 mm, and 0.53 mm were set on the drive-end bearings (Type 6205-2RS JEM SKF) at the location of outer raceway, inner raceway, and rolling element (ball), respectively, using electrodischarge machining technique. The vibration data were measured by using an accelerometer being attached to the motor housing with the sampling frequency of 12 kHz. 4.1. Diagnosis of Rolling Bearing Faults under Different Severity Levels. The first study is to diagnose rolling bearing faults under different severity levels. The vibration signals of rolling bearings with different sizes of inner raceway defect are illustrated in Figure 6. The mutual information for each wavelet function is calculated and the results are listed in Table 2. Considering that the reverse Biorthogonal wavelet
6
Shock and Vibration
Training
Testing
Signal 1
···
Signal n
OWPT
···
OWPT
Energy features
···
Energy features
Input signal x Optimized wavelet packet transform (OWPT) using LDB Energy feature extraction
Energy feature vectors construction
Energy feature vector construction Store classifier models
Trained classifier models
Classifier models
Output diagnostic results
Figure 4: Flowchart of the rolling bearing fault diagnosis scheme.
2 hp motor
Torque Dynamometer transducer
0.5 0 −0.5
0
0.1
0.2
0.3
0.4
0.5
0.6
0.7
0.8
0.9
1
Amplitude
Amplitude
Figure 5: Bearing test system. 2 0 −2
0
0.1
0.2
0.3
0.4
Time (s)
0 −2
0
0.1
0.2
0.3
0.4
0.7
0.8
0.9
1
(b)
2
Amplitude
Amplitude
(a)
0.5 0.6 Time (s)
0.5
0.6
0.7
0.8
0.9
Time (s)
(c)
1
0.5 0
−0.5
0
0.1
0.2
0.3
0.4
0.5
0.6
0.7
0.8
0.9
1
Time (s)
(d)
Figure 6: Vibration signals of rolling bearings under different defect sizes: (a) normal, (b) 0.18 mm hole, (c) 0.36 mm hole, and (d) 0.53 mm hole (speed: 1797 rpm, load: 0 hp).
1.3 (denoted as rBio1.3) possesses the highest value, thus it is identified as the most appropriate wavelet to analyze the rolling bearing signals through an optimized wavelet packet transform. The energy values calculated from the optimal set of orthogonal wavelet subspaces (40 groups of training signals and 20 groups of testing signals, each containing 1,024 data points) are then chosen as inputs to a support vector machine (SVM) classifier for characterizing the rolling bearing defect
severity levels. The classification results are listed in Table 3. It can be seen that these features bring about much high classification accuracy score at 100%, which indicates that the developed fault diagnosis method is effective for classifying rolling bearing defect severity. For the purpose of comparison, the energy features are also input to different classifiers, and Table 4 presents the classification results achieved by four different classifiers. It can be seen that, except for the HMM classifier, the other
Shock and Vibration
7
Table 2: Mutual information of the extracted bearing vibration signal using different wavelets. Wavelet function Haar Db2 Db4 Db6 Db8 Db10 Coif1 Coif2 Coif3 Coif4
Mutual information 17.007 20.781 20.740 20.771 20.772 20.762 20.766 20.795 20.777 20.764
Wavelet function Coif5 Sym2 Sym3 Sym4 Sym5 Sym6 Sym7 Sym8 Bior1.3 Bior2.4
Mutual information 20.737 20.781 20.783 20.788 20.797 20.760 20.783 20.801 16.953 20.770
Wavelet function Bior2.6 Bior4.4 Bior5.5 Bior6.8 rBio1.3 rBio2.4 rBio2.6 rBio4.4 rBio5.5 rBio6.8
Mutual information 20.801 20.762 20.765 20.773 20.879 20.741 20.805 20.760 20.776 20.789
Table 3: Classification results of rolling bearing faults under different severity levels. Target classes
Sample size
Normal 0.18 mm hole 0.36 mm hole 0.53 mm hole
20 20 20 20
Normal 20 0 0 0
Classification results 0.18 mm hole 0.36 mm hole 0 0 20 0 0 20 0 0
Table 4: Comparison for classification results using different classifiers. Classifier types SVM classifier Bayes classifier HMM classifier BP-NN classifier
Classification rate [%] 100.00 100.00 93.75 100.00
three classifiers perform well for the selected features in characterizing the rolling bearing faults. Furthermore, control experiments using three different wavelet functions are conducted. It can be seen that the test using the reverse Biorthogonal wavelet 1.3 which is the most suitable wavelet to analyze the rolling bearing signals acquires higher classification accuracy than those using other wavelet functions as shown in Table 5. This verifies the effectiveness of the mutual information measures for wavelet selection. 4.2. Diagnosis of Rolling Bearing Faults with Different Locations. The second study is to diagnose rolling bearing faults at different locations. Figure 7 illustrates the waveform of the vibration signals of rolling bearings with different fault locations under varying load and rotating speed. Following the same procedure, the energy features extracted from the selected subspaces (40 groups of training signals and 20 groups of testing signals, each containing 1,024 data points) are chosen as inputs to the SVM classifier for distinguishing different faults of rolling bearing. The classification results for rolling bearing with different fault locations are shown in Table 6. It can be seen that the selected features produce the high accurate classification rate with 98.75%, where only one inner raceway fault is misclassified.
0.53 mm hole 0 0 0 20
Classification rate [%]
Total [%]
100 100 100 100
100
This indicates that the developed fault diagnosis approach is also effective for bearing fault location classification. The effects of different classifiers on test results are also studied in the experiment to identify different fault locations. The results shown in Table 7 indicate that the SVM classifier is again good for rolling bearing fault location classification. Similarly, control experiments using three different wavelets are conducted. In comparison, using the reverse Biorthogonal wavelet 1.3, which is the optimized wavelet function, to analyze the rolling bearing vibration signals has produced a higher classification rate than those using other two wavelet functions as shown in Table 8. This verifies the effectiveness of the quantitative wavelet selection criterion proposed in this paper.
5. Conclusions This paper presents a quantitative wavelet selection approach for rolling bearing vibration signal analysis. Based on the quantitative wavelet selection and the optimized wavelet packet transform using LDB algorithm, a new effective approach for rolling bearing fault diagnosis has been developed. The results of the experiment studies indicate that the proposed approach has good ability to diagnose the rolling bearing faults. Furthermore, the comparison experiments also show that the proposed quantitative wavelet selection method improves the classification accuracy, which confirm the performance for the enhanced rolling bearing fault diagnosis approach.
Conflict of Interests The authors declare that there is no conflict of interests regarding the publication of this paper.
8
Shock and Vibration Table 5: The classification results under different wavelet functions.
Wavelet function
Classification accuracy [%] 0.18 mm hole 0.36 mm hole 95 85 90 85 90 95
Normal 100 100 100
Bior5.5 Db10 rBio1.3
Classification rate [%]
0.53 mm hole 100 100 100
95.00 93.75 100.00
Table 6: Classification results of rolling bearing faults at different locations. Target classes
Sample size
Normal Inner raceway fault Ball fault Outer raceway fault
Normal 20 0 0 0
20 20 20 20
Classification results Inner raceway fault Ball fault Outer raceway fault 0 0 0 19 0 1 0 20 0 0 0 20
Classification rate [%]
Total [%]
100 95 100 100
98.75
Table 7: Comparison for classification results using different classifiers. Classifier types SVM classifier Bayes classifier HMM classifier BP-NN classifier
Classification rate [%] 98.75 88.75 86.25 98.75 Table 8: The classification results under different wavelet functions.
Wavelet function Bior5.5 Db10 rBio1.3 0.5
Amplitude
Amplitude
Classification accuracy [%] Inner raceway fault Ball fault 80 100 65 95 95 100
Normal 100 100 100
0 −0.5
0
0.1
0.2
0.3
0.4
0.5 0.6 Time (s)
0.7
0.8
0.9
1
0 −0.5
0
0.1
0.2
0.3
Amplitude
Amplitude
0 0.1
0.2
0.3
0.4
0.5 0.6 Time (s)
0.4
0.5 0.6 Time (s)
0.7
0.8
0.9
1
0.7
0.8
0.9
1
(b)
1
0
95.00 90.00 98.75
0.5
(a)
−1
Classification rate [%]
Outer raceway fault 100 100 100
0.7
0.8
0.9
1
10 0 −10
0
0.1
0.2
0.3
0.4
0.5
0.6
Time (s)
(c)
(d)
Figure 7: Vibration signals of bearings with different fault locations under varying load and rotating speed: (a) normal, (b) inner raceway fault, (c) ball fault, and (d) outer raceway fault (fault diameter: 0.53 mm).
Acknowledgments
References
This work has been supported in part by the National Natural Science Foundation of China under Grant 51175080, the Aeronautical Science Foundation of China under Grant 20122269015, and the Science and Technology Support Program of Jiangsu Province under Grant BE2012740.
[1] B. Rao, Handbook of Condition Monitoring, Elsevier Advanced Technology, Oxford, UK, 1996. [2] Z. K. Peng and F. L. Chu, “Application of the wavelet transform in machine condition monitoring and fault diagnostics: a review with bibliography,” Mechanical Systems and Signal Processing, vol. 18, no. 2, pp. 199–221, 2004.
Shock and Vibration [3] R. Yan, R. X. Gao, and X. Chen, “Wavelets for fault diagnosis of rotary machines: a review with applications,” Signal Processing, vol. 96, pp. 1–15, 2014. [4] C. Shen, D. Wang, F. Kong, and P. W. Tse, “Fault diagnosis of rotating machinery based on the statistical parameters of wavelet packet paving and a generic support vector regressive classifier,” Measurement, vol. 46, no. 4, pp. 1551–1564, 2013. [5] Q. He, “Vibration signal classification by wavelet packet energy flow manifold learning,” Journal of Sound and Vibration, vol. 332, no. 7, pp. 1881–1894, 2013. [6] P. Boˇskoski and D. Juriˇci´c, “Fault detection of mechanical drives under variable operating conditions based on wavelet packet R´enyi entropy signatures,” Mechanical Systems and Signal Processing, vol. 31, pp. 369–381, 2012. [7] J. Li, S. Li, X. Chen, and L. Wang, “The hybrid KICAGDA-LSSVM method research on rolling bearing fault feature extraction and classification,” Shock and Vibration, vol. 2015, 9 pages, 2015. [8] A. Tabrizi, L. Garibaldi, A. Fasana, and S. Marchesiello, “Early damage detection of roller bearings using wavelet packet decomposition, ensemble empirical mode decomposition and support vector machine,” Meccanica, vol. 50, no. 3, pp. 865–874, 2015. [9] J. Zhang, W. Ma, J. Lin, L. Ma, and X. Jia, “Fault diagnosis approach for rotating machinery based on dynamic model and computational intelligence,” Measurement, vol. 59, pp. 73–87, 2015. [10] Y. Wang, G. Xu, L. Liang, and K. Jiang, “Detection of weak transient signals based on wavelet packet transform and manifold learning for rolling element bearing fault diagnosis,” Mechanical Systems and Signal Processing, vol. 54-55, pp. 259–276, 2015. [11] S. Hong, Z. Zhou, E. Zio, and K. Hong, “Condition assessment for the performance degradation of bearing based on a combinatorial feature extraction method,” Digital Signal Processing, vol. 27, no. 1, pp. 159–166, 2014. [12] J. Rafiee, P. W. Tse, A. Harifi, and M. H. Sadeghi, “A novel technique for selecting mother wavelet function using an intelligent fault diagnosis system,” Expert Systems with Applications, vol. 36, no. 3, pp. 4862–4875, 2009. [13] J. Rafiee, M. A. Rafiee, and P. W. Tse, “Application of mother wavelet functions for automatic gear and bearing fault diagnosis,” Expert Systems with Applications, vol. 37, no. 6, pp. 4568– 4579, 2010. [14] D. Jiang and C. Liu, “Machine condition classification using deterioration feature extraction and anomaly determination,” IEEE Transactions on Reliability, vol. 60, no. 1, pp. 41–48, 2011. [15] W.-X. Yang and X.-M. Ren, “Detecting impulses in mechanical signals by wavelets,” EURASIP Journal on Advances in Signal Processing, vol. 8, pp. 1156–1162, 2004. [16] Z. X. Chen, “The optimal selection of base wavelet in fault diagnosis,” Journal of Mechanical Science and Technology, vol. 24, no. 2, pp. 172–175, 2005. [17] E. L. Schukin, R. U. Zamaraev, and L. I. Schukin, “The optimisation of wavelet transform for the impulse analysis in vibration signals,” Mechanical Systems and Signal Processing, vol. 18, no. 6, pp. 1315–1333, 2004. [18] F. Li, G. Meng, and L. Ye, “Optimal mother wavelet-based Lamb wave analyses and damage detection for composite structures,” Chinese Journal of Scientific Instrument, vol. 28, no. 10, pp. 1729– 1735, 2007. [19] F. Li, G. Meng, L. Ye, Y. Lu, and K. Kageyama, “Dispersion analysis of Lamb waves and damage detection for aluminum structures using ridge in the time-scale domain,” Measurement
9
[20]
[21]
[22]
[23]
[24]
[25] [26]
[27]
[28]
[29]
[30]
[31]
Science and Technology, vol. 20, no. 9, Article ID 095704, pp. 695–704, 2009. F. Li, G. Meng, K. Kageyama, Z. Su, and L. Ye, “Optimal mother wavelet selection for lamb wave analyses,” Journal of Intelligent Material Systems and Structures, vol. 20, no. 10, pp. 1147–1161, 2009. R. Yan and R. X. Gao, “Energy-based feature extraction for defect diagnosis in rotary machines,” IEEE Transactions on Instrumentation and Measurement, vol. 58, no. 9, pp. 3130–3139, 2009. R. Yan and R. X. Gao, “Base wavelet selection for bearing vibration signal analysis,” International Journal of Wavelets, Multiresolution and Information Processing, vol. 7, no. 4, pp. 411– 426, 2009. P. K. Kankar, S. C. Sharma, and S. P. Harsha, “Fault diagnosis of ball bearings using continuous wavelet transform,” Applied Soft Computing Journal, vol. 11, no. 2, pp. 2300–2312, 2011. C. Wu, T. Chen, R. Jiang, L. Ning, and Z. Jiang, “A novel approach to wavelet selection and tree kernel construction for diagnosis of rolling element bearing fault,” Journal of Intelligent Manufacturing, 2015. S. Mallat, A Wavelet Tour of Signal Processing, Academic Press, San Diego, Calif, USA, 1999. N. Saito and R. R. Coifman, “Local discriminant bases and their applications,” Journal of Mathematical Imaging and Vision, vol. 5, no. 4, pp. 337–358, 1995. K. Umapathy, S. Krishnan, and R. K. Rao, “Audio signal feature extraction and classification using local discriminant bases,” IEEE Transactions on Audio, Speech & Language Processing, vol. 15, no. 4, pp. 1236–1246, 2007. A. R. Harris, K. Schwerdtfeger, and D. J. Strauss, “Optimized shift-invariant wavelet packet feature extraction for electroencephalographic evoked responses,” in Proceedings of the 30th Annual International Conference of the IEEE Engineering in Medicine and Biology Society (EMBS ’08), pp. 2685–2688, August 2008. Q. He, R. Yan, and R. X. Gao, “Wavelet packet base selection for gearbox defect severity classification,” in Proceedings of the Prognostics and System Health Management Conference (PHM ’10), 5, p. 1, IEEE, Macao, China, January 2010. J. Cui, M. Shan, R. Yan, and Y. Wu, “Aero-engine fault diagnosis using improved local discriminant bases and support vector machine,” Mathematical Problems in Engineering, vol. 2014, Article ID 283718, 9 pages, 2014. http://csegroups.case.edu/bearingdatacenter.
International Journal of
Rotating Machinery
Engineering Journal of
Hindawi Publishing Corporation http://www.hindawi.com
Volume 2014
The Scientific World Journal Hindawi Publishing Corporation http://www.hindawi.com
Volume 2014
International Journal of
Distributed Sensor Networks
Journal of
Sensors Hindawi Publishing Corporation http://www.hindawi.com
Volume 2014
Hindawi Publishing Corporation http://www.hindawi.com
Volume 2014
Hindawi Publishing Corporation http://www.hindawi.com
Volume 2014
Journal of
Control Science and Engineering
Advances in
Civil Engineering Hindawi Publishing Corporation http://www.hindawi.com
Hindawi Publishing Corporation http://www.hindawi.com
Volume 2014
Volume 2014
Submit your manuscripts at http://www.hindawi.com Journal of
Journal of
Electrical and Computer Engineering
Robotics Hindawi Publishing Corporation http://www.hindawi.com
Hindawi Publishing Corporation http://www.hindawi.com
Volume 2014
Volume 2014
VLSI Design Advances in OptoElectronics
International Journal of
Navigation and Observation Hindawi Publishing Corporation http://www.hindawi.com
Volume 2014
Hindawi Publishing Corporation http://www.hindawi.com
Hindawi Publishing Corporation http://www.hindawi.com
Chemical Engineering Hindawi Publishing Corporation http://www.hindawi.com
Volume 2014
Volume 2014
Active and Passive Electronic Components
Antennas and Propagation Hindawi Publishing Corporation http://www.hindawi.com
Aerospace Engineering
Hindawi Publishing Corporation http://www.hindawi.com
Volume 2014
Hindawi Publishing Corporation http://www.hindawi.com
Volume 2014
Volume 2014
International Journal of
International Journal of
International Journal of
Modelling & Simulation in Engineering
Volume 2014
Hindawi Publishing Corporation http://www.hindawi.com
Volume 2014
Shock and Vibration Hindawi Publishing Corporation http://www.hindawi.com
Volume 2014
Advances in
Acoustics and Vibration Hindawi Publishing Corporation http://www.hindawi.com
Volume 2014