path, also called a âtunnel-in-the-skyâ display. The immersed perspective flight path is a virtual corridor, tunnel or pathway that is presented to pilots to assist ...
Aviation Research Lab Institute of Aviation
ARL
University of Illinois at Urbana-Champaign 1 Airport Road Savoy, Illinois 61874
AN ANALYSIS OF THE IMMERSED PERSPECTIVE FLIGHT PATH DISPLAY BENEFIT: BENEFITS OF PREVIEW, PREDICTION, AND FRAME OF REFERENCE Shawn M. Doherty and Christopher D. Wickens Technical Report ARL-00-5/NASA-00-1 June 2000 Prepared for NASA Ames Research Center Moffett Field, CA Contract NASA NAG 2-1120
Abstract A theoretical explanation for an immersed perspective flight path display is investigated in this current study. Past research suggests that the immersed perspective flight path display (“tunnel-in-the-sky”) can improve flight path tracking when compared to more conventional flight navigation instruments but at present the specific sources of this benefit have not adequately been explained. On the basis of past research, four properties of the tunnel were investigated. These are egocentric frame of reference, preview of the flight path, prediction of future aircraft location, and a high display gain. The four variables of frame of reference, preview, prediction, and display gain were experimentally contrasted in a partially crossed factorial design to investigate the relative contributions of each variable to the tunnel benefit. A quickened display condition was also included. Twenty-four subjects were asked to fly an aircraft through a series of vertically and laterally changing flight paths on a PC based simulation using eleven different displays incorporating the variables of interest. The dependent measures of root mean squared error in lateral and vertical tracking, mean number of resets, and mean number of control inputs were collected. The results showed that preview benefits were greater than those of prediction. An interaction of prediction and preview was found, with the benefits of prediction sometimes being contingent on the presence of preview. Explanations of control order account for the finding that prediction and preview benefited lateral tracking more than vertical tracking. The egocentric frame of reference was found to play a large role in the tunnel benefit. This was especially true in conjunction with preview such that performance without a tunnel was benefited by an egocentric viewpoint. The large cost of an exocentric frame of reference was mediated by the paired presence of prediction and preview in the altitude data. The larger display gain appears to account for no portion of the egocentric frame of reference benefit.
1
Table of Contents 1. Introduction…………………………………………………………………………………2 2. Background………………………………………………………………………………….2 2.1 Generic Perspective Displays……………………………………………………….2 2.2 A History of Guidance Displays…………………………………………………….3 2.3 The Tunnel-in-the-Sky………………………………………………………………6 2.3.1 Dimensionality…………………………………………………………….6 2.3.2 Integrated Information…………………………………………………….6 2.3.3 Symmetry………………………………………………………………….6 2.3.4 Preview…………………………………………………………………….9 2.3.5 Prediction…………………………………………………………………..9 2.3.6 Egocentric Viewpoint……………………………………………………...9 2.3.7 Display Gain……………………………………………………………….9 2.4 The Immersed Perspective Flight Path Display Benefit……………………………12 2.4.1 Manual Control………………………………………..…………………..12 2.4.2 Prediction and Preview …………………………………………………..16 2.4.2.1 Display configurations…………………………………….……18 2.4.2.2 Evidence for the benefits of preview………...…………………23 2.4.2.3 Evidence for the benefits of prediction…………………………25 2.4.3 Three-Dimensional Integration………………………………………...…26 2.4.4 Frame of Reference ………………………………………….……..…….28 2.4.5 Display Gain……………………………………………..….…….………31 2.4.6 Conclusions………………………………………………..……….….….32 3. Experimental Method……………………………………………………………………….34 3.1 Task………………………………………………………………………………….34 3.2 Subjects……………………………………………………………………………...34 3.3 Apparatus and Displays……………………………………………………………..34 3.3.1 Visual Displays……………………………………………………………35 3.3.2 Flight Paths………………………………………………………………..50 3.4 Design……………………………………………………………………………….52 3.5 Procedure……………………………………………………………………………52 3.6 Data Collection……………………………………………………………………...53 3.7 Data Analysis………………………………………………………………………..53 4. Hypotheses……………………...……………………………………………………………53 5. Results………………………………………………………………………………………..56 5.1 Sources of Benefit…………………………………………………………………...58 5.1.1 Altitude Deviations………………………………………………………..58 5.1.2 Lateral Deviations…………………………………………………………59 5.1.3 Mean Number of Resets…………………………………….……………..60 5.1.4 Control Inputs……………………………………………………………..61
5.2 Quickening…………………………………………………………………………..62 5.2.1 Altitude Deviations………………………………………………………..63 5.2.2 Lateral Deviations…………………………………………………………64 5.2.3 Mean Number of Resets…………………………………………………...65 5.2.4 Control Inputs……………………………………………………………..65 5.3 Reduced Gain………………………………………………………………………..66 5.3.1 Reduced Gain, Altitude……………………………………………………67 5.3.2 Reduced Gain, Lateral…………………………………………………….67 6. Discussion……………………………………………………………………………………67 6.1 Preview……………………………………………………………………………...67 6.2 Prediction……………………………………………………....……………………68 6.3 Frame of Reference and the Role of Ambiguity…………………………………….69 6.4 Prediction and Preview……………………………………………………………...70 6.5 Quickening…………………………………………………………………………..70 6.6 Reduced Gain………………………………………………………………………..70 6.7 Summary of the Current Findings…………………………………………………...72 6.8 Implications of the Current Findings………………………………………………..73 7. Acknowledgments………………………………………………………………………..….74 8. References…………………………………………………………………...……………….74 Appendix A: Experiment Protocols…………………………………………………………..78 Appendix A.1: Consent Form…………………………………………………………...78 Appendix A.2: Demographics Form……………………………………………..……...79 Appendix A.3: Pilot Instructions (Tunnel Form)……………………………………..…80 Appendix A.4: Pilot Instructions (Box Form)………………………………………..…86 Appendix A.5: Debriefing……………………………………………………………....91
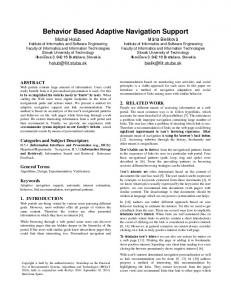
1. Introduction Control of an aircraft can be an arduous task. Pilots have at least four major tasks: flying the aircraft, communication, navigation and systems management (Billings, 1997). For each of these tasks, a large number of smaller tasks must be attended for the plane to remain functioning correctly. For example, to keep an aircraft level the pilot must be aware of changes in ailerons, pitch of the nose of the aircraft, dips in the wings and wind changes, to name a few. Thus it is in the interest of the psychological community to assist in coordinating these tasks for the benefit of the pilot. Toward this end, many cockpit electronic displays have been created to assist pilots in their control of the aircraft. One of these displays is known as the immersed perspective flight path, also called a “tunnel-in-the-sky” display. The immersed perspective flight path is a virtual corridor, tunnel or pathway that is presented to pilots to assist them in the maintenance of level control and navigation of the aircraft (see Figure 1). Some empirical support has been generated that demonstrates that the immersed perspective flight path does assist pilots in maintaining proper control (e.g., Jensen, 1981; Reising, Barthelemy & Hartsock, 1989; Haskell & Wickens, 1993; Regal & Whittington, 1995; Theunissen, 1995; Ververs, 1998). Yet specific explanations of how the immersed perspective flight path assists pilots has received little investigation. That is the issue to be addressed here. We begin with an overview of previous work done on the immersed perspective flight display. Following the overview, specific features of the display that may generate benefits for performance will be summarized. We then outline the research design used to investigate the relative contribution of these factors to the benefit for performance. A listing of the experiment results and a discussion of the results follow the research design. 2. Background 2.1 Generic Perspective Displays Perspective displays refer to a class of information displays that present a threedimensional representation on a two-dimensional surface. There has been an increase in proposals for perspective displays corresponding with the increase in technological ability. For example, these displays have been investigated in the domains of weather analysis (Wilhelmson, Jewett, Shaw, Wicker, Arrott, Bushell, Bajuk, & Yost, 1989), data visualization (Wickens, Merwin & Lin, 1994), and aviation. The focus of the present research is on the aviation domain and will start with some background on aviation displays.
2
Figure 1. An example of an immersed perspective flight path display. From Haskell & Wickens (1993). 2.2 A History of Guidance Displays In order to understand fully the current level of technology, we must comprehend where it comes from as many of the issues leading up to the current generation of the perspective flight display have emerged due to constraints from the past. Examples of advances in display technology are shown in Figure 2. Historically, early technology in the aircraft cockpit was limited by mechanical factors. The location and type of information displayed was constrained by where the mechanisms for those displays could be situated and produced. This level of technology has been referred to as “verite” (Cook, 1996). At this level of technology, information about the control of the aircraft was primarily in the form of an ADI (attitude directional indicator) (see Figure 2B) and a compass. The ADI includes a horizon line that indicates bank (tilt left or right) and pitch (tilt up or down) of the aircraft and is paired with a compass that points in the direction the aircraft is heading (the triangle in Figure 2B). This provides some information about direction of the current orientation, but little else.
3
Tunnel (Preview) ILS; ADI+compass
Predictor
Flight Director A
360
270
90
180
B
C
D
E
Figure 2. Advances in technology for aviation guidance. Figure A shows a top-down view of an aircraft and it’s flight path and what portion of the scene each level of technology provides. Figure B shows the view to a pilot with an ADI and compass system. Figure C shows the view to a pilot for an ILS system (the current position). Figure D shows the view to a pilot for a flight director (some position into the future, but no current position). Figure E shows the same view with a tunnel and predictor. 4
The next advance was the ILS (instrument landing system) that includes a mobile needle that shifts off the centerline of the display to indicate deviations from the path either vertically or horizontally (see Figure 2C). The position of the needle provides information to pilots about which direction they need to go to guide the aircraft to obtain the flight path. For example, if the required flight path was off to the right, the horizontal needle of the ILS would be to the right of the center of the display, informing the pilot of the need to go right. In Figure 2C, the aircraft is slightly left and below the center of the path. The ILS was an advance over the ADI as it provides information about the location of the desired path in relation to the aircraft, but still provides information only about the current position. Information about future position is not displayed. For example, the pilot would not have any indication in the display that the path will curve to the right as shown in Figure 2A. In addition, due to lags inherent in aircraft dynamics, feedback about corrections to the desired path are delayed to the pilot which make the ILS a difficult tool to use for primary guidance of an aircraft. The next advance was the flight director. Like the ILS, the flight director contains a horizontal and vertical bar, but includes information about future positions (see Figure 2D). The deviations of the horizontal and vertical bars in a flight director indicate if the aircraft is in position to intercept the flight path in the future. The bars deviate on the partial basis of the pilot’s error from the upcoming correct course. The error is added to the first and second derivatives of the error in a procedure called quickening. The first and second derivatives of the error increase the rate of change in displayed error, thereby allowing pilots to anticipate for errors and correct them before they occur thereby overcoming lags in the flight control system. In this sense, the flight director generates information about future position but does not display this information in a pictorially real fashion. In Figure 2D, the vertical bar is off to the right, indicating to the pilot that their aircraft is pointed off to the left of the flight path. This suggests to the pilot that he or she needs to point the nose of the aircraft to the right in order to intercept the flight path in the future. Notice that this representation is different from that of the ILS that only shows current position error. The flight director does not contain information about the current position, only the required control response to make to control future position. However, due to the presentation of future information and quickening, the lags in information are reduced to the pilot, making it an easier tool to use than the ILS for guidance. All three of these displays (ADI+compass, ILS, flight director) require other information (for example, speed and altitude) to be presented in other nearby displays. The pilot has to integrate the information from all of these displays in order to keep the aircraft level and on the correct course. These displays are also completely two-dimensional. There is no depth (and therefore no temporal) information provided regarding forward travel, only current deviations (for the ADI and ILS) or control requirements based on projected deviations (for the flight director) are displayed. Thus, the pilots are required to both integrate information and have some understanding of both their position and course to maintain level flight along the correct path. The immersed perspective flight display, or “tunnel-in-the-sky” (see Figure 2D), was created to overcome this lack of prediction and issues of integration.
5
2.3. The Tunnel-in-the-Sky Advances in computer technology and video routines have made the immersed perspective flight path display a possible facilitator in airline cockpits by displaying the pilot’s required future course in three dimensions. They come in many forms and include paths (e.g., Nataupsky & Crittenden, 1988; Reising et al., 1989; Reising, Liggett, Solz, & Hartsock, 1995), tunnels (e.g., Grunwald, Robertson, & Hatfield, 1981; Haskell & Wickens, 1993; Wickens & Prevett, 1995; Flohr & Huisman, 1997, Theunissen, 1995; Ververs, 1998) and corridors (e.g., Wilckens, 1973; Jensen, 1981; Lintern, Roscoe & Sivier, 1990; Fadden & Wickens, 1997). Figure 3 displays some typical examples. Before directly addressing the literature about the benefits of immersed perspective flight paths, however, some properties of a typical tunnel-inthe-sky display will be outlined. A typical tunnel-in-the-sky is depicted in Figure 1. A standard tunnel contains the properties of three-dimensions, prediction, preview, an egocentric viewpoint, symmetry, high display gain and integrated information. This is not an exhaustive list of tunnel properties, but contains most of the major identifying elements of an immersed perspective flight path display. Each of these tunnel properties will be described in turn. 2.3.1 Dimensionality. The definition of a perspective display is the presentation of a three-dimensional representation on a two-dimensional surface. The pilots perceive the tunnel as three-dimensional with the forward dimension representing position along the flight path. 2.3.2 Integrated Information. In an effect related to dimensionality, tunnel displays contain integrated information. Since the tunnel is depicted in three dimensions, the dimension of depth is integrated into the same display with all the other information to form a single object. To represent the same information in two-dimensions, two displays must be presented (i.e., a coplanar display). One display shows movement in two dimensions (typically the lateral and depth planes) and the second display shows movement in the third dimension (typically the vertical profile) that is coupled with the first two dimensions. Thus the three-dimensional single object representation of the flight path can be predicted to support the division of attention across the three axes, as predicted by object-based theories of attention (Kramer & Jacobson, 1991; Watson & Kramer, 1999; Haskell & Wickens, 1993). 2.3.3 Symmetry. Tunnels, by their nature, contain the property of symmetry. That is, when the pilot is lined up in the center of the tunnel, all segments of the tunnel further away are centered within the current segment. Theunissen (1995) demonstrates this effect via an analysis in which the symmetry of the tunnel may be described as a sum of errors from the flight path. These errors include the cross-track error (XTE: the lateral deviation from the center of the flight path), track-angle error (TAE: the deviation of lateral heading from the forward trajectory along the flight path), vertical-track error (VTE: the vertical deviation from the center of the flight path), and flight path angle error (FPAE: the deviation of vertical heading from the forward trajectory along the flight path) (see Figure 4). If the pilot is on the flight path and not deviating from it, all four errors will sum to zero. Deviations from the center will result in a corresponding change in some or all of the four errors and the symmetry of the tunnel will be lost. The symmetry may be thought of as a salient emergent feature that supports ideal performance (Vicente & Rasmussen, 1992, Sanderson, Flach, Buttigieg, & Casey, 1989) and that may be processed pre-attentively (Baylis & Driver, 1995).
6
A
B
C
Figure 3. Examples of immersed perspective flight path displays. A. Examples of corridor perspective flight path displays. B. Examples of tunnel perspective flight path displays. C. Examples of path perspective flight path displays.
7
Figure 4. An analysis of tunnel symmetry. Figure A shows changes in tunnel symmetry from changes in cross-track error (XTE) and track-angle error (TAE). Figure B shows changes in tunnel symmetry from changes in vertical-track error (VTE) and flight-path angle error (FPAE). From Theunissen (1995).
8
2.3.4 Preview. By definition, all tunnel-in-the-sky displays must contain preview (see Figures 2A and 2D). The property of preview involves having access to information about the future required status of a system or its future command input. For example, a driver has a preview of what is to come in the form of the road ahead. Unless it is extremely foggy, the driver can observe changes (curves) in the road prior to reaching those changes. In the case of immersed perspective flight displays, the display gives a preview of the upcoming path to the pilot by extending the flight path beyond the current position. 2.3.5 Prediction. Many tunnel displays also contain predictor symbols within the display (Figures 2A and 2D). Predictor symbols indicate the observer’s projected position at some future point. The predictor symbol frequently has the form of a small aircraft for aviation displays and is positioned at some constant distance or time from the observer’s aircraft. Thus the term, “prediction”, involves extrapolating the current trajectory of the aircraft to some future point and indicating where the pilot will be in the future given no action. Notice that prediction is not the same as preview. Prediction is the display of observer’s input to the current conditions (including outside disturbances) extrapolated to some future time. It is an inference based, in part, on the observer’s current and anticipated behavior (Wickens, Gempler, & Morphew, 2000). Preview is based upon conditions existing in the world. The amount of preview may depend on environmental or display conditions but is independent of the observer. 2.3.6 Egocentric Viewpoint. Egocentric and exocentric viewpoints refer to two endpoints of a continuum of possible viewpoint locations in a generic perspective display (see Figure 5; Wickens, 1999). Immersed viewpoints are typically termed “egocentric” and involve displays in which the viewpoint corresponds to the viewpoint of an observer if he or she were immersed in the scene. The tunnel display under investigation here is an egocentric display. If the viewpoint is pulled back from the observer, the viewpoint is no longer immersed and is considered “exocentric”. Once the viewpoint is no longer immersed, the viewpoint can be positioned outside or away from the observer, giving a range of possibilities for the viewpoint position. Typically, the viewpoint is placed somewhere above the observer such that the field of view includes the observer and the ground beyond and may be fixed in place or mobile. A special case of an exocentric viewpoint is called “tethered” in which the viewpoint is slaved to the observer in position and orientation (imagine the viewpoint being connected by a rod to the observer) such that the viewpoint moves exactly in the same fashion as the observer (see Figure 5B). The “tether length” refers to how far away from the observer the viewpoint is located. 2.3.7 Display Gain. Display gain refers to the ratio of change in the display to a given input by the user. Display gain is related to viewpoint location. This is because as the viewpoint is pulled back away from the tunnel (exocentric), the displayed movement decreases (see Figure 6). This results in smaller changes in the display of error for the same degree of movement as a close viewpoint (egocentric). Therefore, an exocentric viewpoint generates a naturally smaller display gain. Since the tunnel-in-the-sky display typically has an egocentric viewpoint, the display gain is greater than non-immersed viewpoints.
9
10 Tethered (B)
Exocentric (C)
Figure 5. Examples of the range of viewpoint locations, from egocentric to exocentric. The dashed lines refer to the visual field seen from the viewpoint. In segment A, the viewpoint is with the observer. In segment B, the viewpoint has been pulled back and is rigidly connected to the observer. In segment C, the viewpoint has been pulled back to include the observer and surrounding area.
Egocentric (A)
Output (Displayed movement)
Input (Aircraft movement) A
Displayed movement of an identical magnitude real movement.
Output
Input B Figure 6. Display gain as a function of viewpoint location. A. Egocentric viewpoint generates a large display change for a given input to the display (i.e., aircraft movement in real space). B. Exocentric viewpoint generates a smaller display change for the same given input.
11
Knowledge of these properties of the tunnel-in-the-sky will be necessary to explore the literature on the immersed perspective flight path display. This literature has demonstrated the robust benefit of the immersed perspective flight display relative to other types of displays, as described below. These other displays differ from the immersed perspective flight path display on various subsets of the seven properties described above, but a precise accounting of the relative benefit offered by these properties has not been carried out and will be the focus of this study. In the following pages, a review of this literature will help identify which of the properties of the display described appear to be most likely to account for this benefit, thereby providing a framework for the hypotheses examined in the proposed experiment. 2.4 The Immersed Perspective Flight Path Display Benefit An explanation for why each property would affect pilot performance or what the psychological processes involved with the pilot are for each of the properties has not yet been addressed. An examination of possible reasons for why each property might influence flight path tracking will help to further determine which properties should be pursued as independent variables in the current study. Symmetry will not be pursued further in this study. Lack of symmetry arises from errors in the flight path. To the extent that various aspects of the display influence errors in the flight path, these will also influence the symmetry. Hence this property is a necessary confound with other tunnel benefit explanations and will not be pursued further. A brief overview of the reasoning behind each remaining source of benefit will be covered followed by a summary of support for that property from the literature. In particular, the theoretical benefits and research findings underlying prediction and preview (2.4.2), threedimensionality (2.4.3), egocentric frame of reference (2.4.4) and display gain (2.4.5) will be reviewed. In order to fully describe this literature, however, a description of psychological processing in terms of manual control will be explored in section 2.4.1. 2.4.1 Manual Control. Manual control theory attempts to describe psychological processing through an analysis of the underlying dynamics of the control processes involved with performing a task (Wickens & Hollands, 2000; Poulton, 1974; Kelley, 1968). Manual control tasks are characterized by the reduction of error between desired and actual states of a system through an application of force through a control element. As will be shown below, manual control theory can be placed in the context of a more generic model of information processing such as that shown in Figure 7. The primary goal of system control by a user is to reduce error between a desired state of a system (driven by some goal state the operator is attempting to achieve) and the actual state of the system. For example, in an aircraft, the pilot desires to reduce the error between maintaining the center of his or her flight path (desired state) and the actual position of the aircraft (actual state). These goals may be nested. For example, trying to keep the aircraft in the center of the flight path is affected by sub-goals of maintaining appropriate vertical speed and correct heading of the aircraft.
12
13
STSS
Receptors
Feedback
Long-term memory
Perception
Memory
Working memory
Decision and response selection
Figure 7. A model of information-processing. Adapted from Wickens and Hollands (2000).
Stimuli Response execution
Responses
A manual control framework describes of the interactions between the operator, the system and outside forces. The operator inputs a control signal into a control device to effect a change in the system. For example, a pilot imposes force on the yoke of the aircraft. The resulting changes in the control device’s position affects, in turn, the portion of the system that effects the change. After the yoke (control device) is turned in the aircraft, the ailerons (control effector) move up or down in the indicated direction, changing the heading of the aircraft. The final outcome can also be affected by outside disturbance forces, such as wind blowing the aircraft off the flight path, which must be compensated for by the operator. This illustrates desired versus actual values. The pilot is always trying to reduce the error between the desired state (staying on the flight path) and the actual states (being blown off course by turbulence) to correctly track their flight path. Three issues can greatly affect the pilot’s ability to control a system. These three elements are the control order, lag, and gain of a system. Control order is the response of a system (like an aircraft) to a given input (see Figure 8). A zero order system gives a position change for a particular position change input. For example, turning the dial on a radio changes the radio tuner a given amount. Turning the dial twice as far results in the tuner going twice as far. In a first order system the system response to a given input position is velocity based. That is, a given input will result in a constant velocity. A constant bank in an aircraft will create a constant rate of turn. A second order system is an acceleration driven system in which a given input position will produce a standard acceleration. A constant stick deflection in an aircraft will produce a constant acceleration of heading. Most aircraft have third order systems of lateral position in that a constant lateral displacement of the yoke will move the ailerons (flaps) on the wings a given amount (zero order). The amount the ailerons move corresponds to the rate the aircraft banks (first order). The bank rate determines the heading acceleration (second order). Finally, the heading acceleration produces the rate of acceleration change for lateral deviations off a flight path (third order). So if a pilot wishes to maintain a given lateral flight path, he or she has to try to control a third order system from particular yoke inputs. Lag affects the control of a system by delaying the response of the system to a given input. For example, some older computers have an inherent lag in which the input from a mouse produces some output from the system that is delayed in being displayed. This delays feedback to the user about the output of their actions, making it difficult to anticipate (infer) corrections to the error between desired and actual states. This delay of action due to lag can be disastrous under time-critical situations when action is needed or can lead to an unstable control of the aircraft if the control inputs lag far enough behind the necessary control inputs. Lag must be anticipated by the human controller and is therefore a source of high cognitive load (Wickens et al., 2000). Control order is one important source of lag, as seen in Figure 8. Higher control order can introduce longer control lags than lower control order. For example, the response from a second order system takes longer than a first order system for the same control input position.
14
Zero Order (Position) (Input = Output)
Pure Gain
First Order (Velocity)
Second Order (Acceleration)
Pure Time Delay (Lag)
1st
2nd
Greater Lag from Higher Control Order Extra lag from higher order
Figure 8. Control dynamics for a step input. Dotted lines show the given input. Solid lines show the system output to the given input for the control dynamics.
15
Gain of a system refers to the amount of a response to a given input. This has been discussed earlier in terms of display gain. A high gain system will produce a large response to a small input. A low gain system will produce a small response to a large input. Too high of gain in an aircraft will create large changes to the system from the pilots’ input that are difficult for a pilot to control. This especially becomes a problem when coupled with long lags, which can lead to pilot induced oscillations where the pilot weaves around the desired flight path. Aircraft are notoriously difficult systems to control. The pilot needs to keep the aircraft in a narrow envelope of system states to keep the aircraft from stalling. Aircraft are high order (second and third) systems with long lags. This makes many aircraft sluggish or unstable. These are characteristics that pilots must overcome in controlling the aircraft to keep it in the air and remain on the correct flight path. It is clear that these three elements of system control can affect pilot performance, leading to decrements in performance. The manual control framework can help explain some of the effects of each variable under investigation. For example, as increases in system lag and control order occur, delays in information-processing and increases in workload occur in the cognitive stages, as shown in Figure 9. Figure 9 describes a model of information-processing that incorporates these manual control effects, the five variables of interest, and how each affects the various stages of processing. This model will be used in elaborating the theory and evidence behind each tunnel property. 2.4.2. Prediction and Preview. Preview and prediction may be understood within an information-processing and manual control framework by recognizing that each element reduces cognitive complexity and mental computation (inference). While preview helps the observer anticipate the required controls, display prediction shows the consequences of the observer’s current action projected into the future, thereby giving more immediate feedback about their actions. This allows the observer to more clearly anticipate the results of his or her actions. Thus both prediction and preview shifts processing from a cognitive stage of processing to a more perceptual stage of processing (see Figure 9). Preview indicates where the pilot should be, providing directly perceivable information about the future required status of a system or its future command input. While preview is directly observable and requires little cognitive effort in cases like driving (the road is present), in the aircraft preview is often less directly available except in certain cases (such as when the runway is visible on a straight-in final approach). Typically, information about the correct future pathway must be cognitively inferred from multiple sources (map, cockpit instruments, ATC instructions, filed flight plan). Preview may contribute to the benefit because it allows the traveler to plan ahead. For example, if a driver can see the road ahead, then he or she will be able to anticipate a turn around a cliff. Preview may contribute to the benefit because it allows the traveler to plan ahead. For example, a driver will be able to anticipate a turn around a cliff if he or she can see the turn. If, however, the turn is obscured by extremely thick fog, then this information will not be available. With preview, the driver will be able to enter the required input prior to reaching the turn. Without preview, errors of course deviations will increase (e.g., Wickens, Haskell & Harte, 1989). Preview is useful especially when the system under control has lags (such as an aircraft) since the explicit extension of command input provides advance information to the pilot that is not affected by lag.
16
17 Display Gain
Frame of Reference
Perception
Feedback
Experimental Variables
Prediction
Preview
Dimensionality
Decision and response selection
Control Order
Lag
System Gain
Manual Control
Response Selection
Figure 9. Manual control effects and experimental variables within an information-processing framework.
Stimuli
The benefits of preview can be seen in transcription tasks or process control (Wickens & Hollands, 2000). In transcription tasks, an operator must transfer information from one source (a sheet of paper) to another (a computer system via a keyboard). Yet some skilled transcription operators are able to transcribe faster than limitations of decision-making ability. Therefore, these operators must be taking advantage of information (preview) that is present ahead of their current information that is conveyed by their vocal or keyboard response (Salthouse, 1985; Shaffer & Hardwick, 1970). Preview also helps in process control where operators are given some indication (preview) of anticipated demands (Sanderson, 1989). The preview allows operators to anticipate upcoming demands on the system and prepare accordingly. Mental computation of future position or system output from current information is typically a difficult task (Wickens, 1986). The inclusion of prediction allows the pilot to directly view their effect on the system in the future. In other words, the pilot does not need to mentally extrapolate the current position into the future based on current information. The inclusion of prediction for systems of higher order allows the display to act like a lower order version of the higher order system (see Figure 9). Lower order system are easier to control, require less cognitive inference, and require less effort, leading to faster reaction times, more accurate flight path guidance, and reduced workload. In a series of studies in naval ship navigation by van Breda (1999), the general benefits of prediction have been shown. In his studies, the presence of prediction was compared to cases without prediction. Prediction is important for naval ship navigation because naval ships are extremely sluggish systems with high lag. An input placed into a large supertanker may take minutes before a response is seen. Therefore, having the current input extrapolated into the future helps reduce the costs of lag in these sluggish systems. Results from van Breda’s studies suggested that deviations in displays that contained prediction were smaller than deviations in displays that did not contain prediction. Similar results for the benefit of prediction can also be found in air traffic control conditions (Wickens, Mavor, & McGee, 1997). In a study that directly addresses the effects of prediction on processing, Morphew and Wickens examined mental workload measures as a function of prediction (Morphew & Wickens, 1998; Wickens, Gempler, & Morphew, 2000). Morphew and Wickens examined air traffic avoidance maneuvers with three types of traffic avoidance displays. The first display was a baseline display that contained the pilot’s aircraft and one intruding aircraft. A second display included a predictor for the intruder aircraft and the final display added a threat vector that displays the direction of contact with the intruder at the closest point from the pilot’s aircraft. Workload on a secondary task was measured with a NASA-TLX measurement scale, which is one standard measure for workload assessment. Results demonstrated that the intruder prediction display and the threat vector display had reduced workload in comparison to the baseline display. This suggests that the addition of prediction can help reduce workload. These studies demonstrate the importance of prediction and preview and suggest that both of these display augmentations are an important aspect of anticipating future events, improving performance as well as lowering the cognitive demands of that performance. 2.4.2.1 Display configurations. Most studies investigating the immersed perspective flight path display have included prediction in conjunction with preview (cf. Jensen, 1981;
18
Grunwald, Robertson & Hatfield, 1981; Haskell & Wickens, 1993; Regal & Whittington, 1995; Lintern, Roscoe & Sivier, 1990; Ververs, 1998; Wickens, Haskell & Harte,1989; Olmos, Wickens & Chudy, 2000; Wickens & Prevett, 1995; Nataupsky & Crittenden, 1988). However, the individual contributions of preview and prediction have not been explicitly examined. In order to explore the evidence for the independent benefits of prediction and preview, various combinations of prediction and preview in different display designs must be described. Figures 10, 11, and 12 represent schematics of different display configurations, possessing or lacking the features of prediction or preview. All schematics represent on the situation depicted in Figure 10A. In this case, the aircraft is on the flight path along the lateral axis, but is slightly below the flight path. In each, the element controlled by the pilot is the inverted “T” symbol. Figure 10 displays two conditions in which there is neither preview nor prediction in twodimensional, uniplanar (one-panel) displays. Figure 10B shows a uniplanar display that shows current position in relation to the flight path, represented by the crosshairs in the cell. The pilot can see that they are slightly below the pathway because the horizontal crosshair is above their current position (the inverted “T”). This cell contains neither prediction nor preview (similar to an ILS display). Figure 10C is an example of a display that displays error through quickening, like a flight director, but also does not contain either prediction or preview. The crosshairs in this cell represent what the pilot needs to do to regain the flight path. In this instance, the pilot needs to point the nose of the aircraft upward to regain the pathway. Figure 11 displays four conditions with different levels of preview and prediction for a two-dimensional, co-planar display. In each of the displays in Figure 11, the upper half of the display shows horizontal deviations and the lower half shows the vertical deviations. Figure 11A shows a two-dimensional co-planar display without prediction or preview. Figure 11B shows a two-dimensional co-planar display with prediction only. Figure 11B shows that the predictor is off to the right and below the current position, suggesting that the pilot will be right of the flight path in the future (top half) and far below the flight path (bottom half). Figure 11C shows a twodimensional co-planar display with preview only. In this case preview of the flight path is present, but there is no prediction. So the display shows that the path leads to the left (top half) and slopes downward (bottom half) from the current position. Figure 11D integrates both prediction and preview for the two-dimensional co-planar display. The top half of Figure 11D shows both the preview of the flight path (curving to the left) and the predictor (off to the right) for lateral deviations and the preview of the flight path (curving downward) and the predictor (below the current aircraft) for vertical deviations.
19
Desired Flight Path (Preview)
Predicted Flight Path A
Predictor
B
No
Quickening
Yes (Flight Director)
C
Figure 10. Prediction and Preview (Uniplanar). Panel A shows a top-down view of an aircraft, predictor symbol and flight path. The plane is currently slightly below the desired path (not depicted in Panel A). Panel B shows the same view from the pilot’s perspective without prediction or preview in a uniplanar 2D display. Panel C shows the scene in A via a flight director using quickening. The dark aircraft symbol is the current position in Panel B and the displayed error plus its derivatives in Panel C. The status depicted in Panel A is also used for Figure 11 and 12. 20
No
A
B
Preview
Yes
C
No
Prediction
D
Yes
Figure 11. Prediction and Preview (coplanar). Figures A-D depict the status from Figure 5A in a coplanar format. Panel A shows the pilot’s perspective without prediction or preview. Panel B shows the same view as panel A with prediction. Panel C shows the scene in panel A with preview but without prediction. Panel D shows the scene in panel A with preview and prediction. The dark aircraft symbol is the current position in each panel. The light aircraft symbols in panels B and D are the predictor symbol.
21
No
A
B
Preview
Yes
C
No
Prediction
D
Yes
Figure 12. Prediction and Preview (3D). Figures A-D depict the status from Figure 5A in a threedimensional format. Panel A shows the pilot’s perspective without prediction or preview. Panel B shows the same view as panel A with prediction. Panel C shows the scene in panel A with preview but without prediction. Panel D shows the scene in panel A with preview and prediction. The dark aircraft symbol is the current position in each panel. The light aircraft symbols in panels B and D are the predictor symbol.
22
Figure 12 shows the same information as Figure 11, but for three-dimensional displays rather than two-dimensional, co-planar displays. Figure 12A shows a three-dimensional display without prediction and preview. The single box represents one wicket of the tunnel that would slide along the flight path. Figure 12B shows a three-dimensional display that contains prediction without preview (demonstrating that the aircraft is currently below, but will be on the flight path in the future). Figure 12C shows a three-dimensional display that contains only preview, without prediction. In this case the tunnel is depicted, showing the preview of the flight path into the future. Figure 12D incorporates both prediction and preview in the same display. Both the preview of the tunnel is shown and the predictor, showing the aircraft’s position in the future within the tunnel. The displays shown in Figure 12 will be the focus of the current experiment. Comparisons between the various display schematics in Figures 10, 11 and 12 will help illustrate comparisons made in the literature. In the following, all references to “cells” are to specific display types shown in Figures 10, 11 or 12. 2.4.2.2 Evidence for the benefits of preview. One way to investigate the effects of preview is to compare a three-dimensional tunnel with some version of a two-dimensional planar representation as in Figure 10. Since planar representations do not contain depth, they cannot show preview inside the display and can therefore provide a contrast that gives some evidence for the role of preview. The largest class of studies with the tunnel has investigated this comparison. Wilckens (1973) carried out an early study that compared a tunnel display with both a flight director and ILS systems. Raw data from this study were not available, but results were reported that the tunnel display created equivalent tracking performance to the flight director. However, the tunnel display showed smoother control movements when compared to the flight director and ILS displays. Jensen (1981) compared a tunnel display without prediction (cell 12C) with a flight director (cell 10C) and a uniplanar display (cell 10B) in a landing task. He investigated display augmentations for a curved landing task. These augmentations included quickening and prediction enhancements. Results from these manipulations demonstrated that performance for flight path tracking was better in the tunnel display than the uniplanar display by 60% for lateral tracking error (120 meters error for the uniplanar display versus 50 meters error for the tunnel) and worse by 10% for vertical tracking error (110 meters error for the tunnel display and 95 meters error for the uniplanar display). Lateral tracking error was also reduced nearly 50% by the tunnel in comparison to the flight director (95 meters error in flight director versus 50 meters error for the tunnel). Vertical flight path tracking was equivalent. Grunwald, Robertson and Hatfield (1981) investigated the use of the immersed perspective flight path for helicopter landings. In this study, performance using a tunnel display without a predictor (cell 12C) was compared against the more traditional format of a twodimensional uniplanar format with simulated displays (cell 10B). In this case, the uniplanar format consisted of the earliest type of display guidance, the ADI and compass. Results suggested that the tunnel was far superior to the ADI and compass, giving an 85% reduction of lateral root mean squared error (578.6 meters squared for the tunnel, 3,663.8 meters squared for
23
the ADI + compass) and an 80% reduction of vertical error (205.8 meters squared for the tunnel, 1,089.8 meters squared for the ADI + compass). Wickens, Haskell and Harte (1989, experiment 2, sessions 1 and 2) compared an immersed perspective flight display with a predictor (cell 12D) with a uniplanar display (cell 10B). In their study, subjects performed a curved landing task with either a perspective flight display or a uniplanar display. Results suggested that tracking performance with the tunnel was better than with the uniplanar display for lateral control, reducing error by 50% (50 feet error for the uniplanar display, 25 feet error for the tunnel display). Airspeed control errors were also reduced by 40% (12 knots for the uniplanar, 7 knots for the tunnel) but equivalent for vertical errors. A study done by Regal and Whittington (1995) also demonstrates the benefits of the immersed perspective flight display. Regal and Whittington compared a two-dimensional flight director (cell 10C) with a tunnel display with a predictor (cell 12D) for landing with curved approaches in a simulator. Subjects performed landings using the flight director or tunnel on any specific trial. The trials were broken into different difficulty levels of “easy”, “medium”, and “hard”, which differed in the frequency of lateral and vertical flight path changes. The results of the experiment demonstrated that the tunnel contained a very high performance benefit over the flight director. This included a 79% reduction in overall flight path violations (84 for the flight director, 18 for the tunnel) and even fewer course violations in more difficult and complex landing maneuvers (61 for the flight director, 7 for the tunnel): an 89% reduction in violations. In addition, pilots indicated a much higher preference for the tunnel over the flight director when questioned. Analog measures of course deviations were not assessed in this study, nor were the violations partitioned separately into lateral and vertical components. Ververs (1998) compared an immersed three-dimensional flight path with prediction (a full tunnel, cell 12D) with an ILS two-dimensional system (cell 10B). Pilots made curved approaches and landings using the displays. Pilots using the three-dimensional flight display had better flight path tracking in terms of vertical and horizontal mean absolute error, than those subjects using the ILS guidance system, except for the last 200 feet before landing in which performance on both displays was similar, because the pilots were flying a straight final approach. Vertical error was reduced by 81% (80 feet vertical error for the ILS, 15 feet vertical error for the tunnel). Lateral error was reduced by 78% (90 feet horizontal error for the ILS, 20 feet horizontal error for the tunnel). The two displays were equivalent for airspeed errors. A study by Alter and Powell (1999) also addresses the benefit of preview through a comparison of a tunnel without prediction (12C) against a two-dimensional HSI (similar to an ILS) (10B) system for straight landing approaches. Results indicated that performance with the tunnel was better than performance in the uniplanar condition. Lateral error was reduced approximately 66% by the tunnel (45 feet for the HIS, 15 for the tunnel) and vertical error was reduced approximately 40% (25 feet for the HIS, 15 feet for the pathway in the sky). Preview can also be investigated by comparing the presence of the tunnel with the complete absence of the tunnel. This was done in a study by Lintern, Roscoe, and Sivier (1990) (cells 12A versus 12C in Figure 12). In this display, novices were given guidance poles or “Fbars” to guide pilots to down the glideslope (landing path). These guidance poles generated a
24
flight path by providing a corridor for novices to follow between the horizontal bars of the guidance. Results examining solely the effects of the tunnel (cells 12A versus 12C) demonstrated that the inclusion of the tunnel did not make a difference in performance for lateral error, but did benefit vertical tracking performance by a 50% reduction in vertical error. Therefore, the preview offered by the addition of the tunnel must enhance performance when the tunnel is included within the display. It should be noted that, in contrast to many of the other studies, the flight path flown was straight. Taken together, past research suggests that preview provides a significant benefit to performance. While the study by Lintern et al. (1990) did not find a benefit for preview, other studies found a benefit for lateral tracking ranging from 44% (Haskell & Wickens, 1993) to 85% (Grunwald et al., 1981). In addition, the absence of lateral tracking benefit in the Lintern et al. study may be explained by noticing that their task was a straight-in landing task. In this case, there are no lateral changes for the pilot to anticipate and so there was little information to be previewed. Vertical tracking is also affected by preview, though typically less than lateral tracking. The benefit for vertical tracking ranges from 20% (Wickens & Prevett, 1995) up to 80% (Grunwald et al., 1981) but may even show a small reversal or no effect as in Jensen (1981). This experimental evidence suggests that the inclusion of preview might be a necessary component for the benefit (especially in the higher order lateral dimension) and therefore a useful variable for investigation in the current experiment. 2.4.2.3 Evidence for prediction. Theunissen (1995) provides some evidence for the role of prediction. An immersed perspective flight path display was investigated both with a predictor (cell 12D) and without (cell 12C) on different tunnel sizes. Results demonstrated that pilot’s flight control actions were more variable without the predictor, suggesting that the predictor can benefit pilot performance. Overall, the inclusion of the predictor led to a 30% reduction in lateral error and a 30% reduction in vertical error for curved segments. Lateral error and vertical error values for the straight segments were not reported. In addition, performance on flight control when the predictor was present was relatively constant as different tunnel sizes and curvatures were used, suggesting that the pilots were “flying the predictor” and using the information from the predictor, rather than the tunnel itself. Grunwald, Robertson and Hatfield (1981) included conditions in their curved landing experiment conditions that shed light on the unique contributions of prediction apart from preview. In one display, a tunnel with prediction was used (cell 12D) and in another a tunnel without prediction was used (cell 12C). Results suggested that the lateral deviation from the flight path with a predictor was 80% smaller than the conditions without the predictor (578.6 meters squared without prediction, 107.3 meters squared with prediction). Vertical deviation was around 70% smaller with the predictor than without (205.8 meters squared without prediction, 59.2 meters squared with prediction). However, these data were reported only from one subject. Nevertheless, the results give some evidence that prediction is a powerful element of the tunnel display, independent of the tunnel itself. Jensen’s 1981 study also contains conditions from which an assessment of the benefits of prediction may be made. The study included conditions of a tunnel without prediction (cell 12C) and a tunnel with prediction (12D). The data suggested no difference between the two displays
25
for lateral tracking but a 30% reduction in vertical root mean square error when prediction was included. Lintern, Roscoe and Sivier (1990) also examined separately the effects of prediction in their experiment. Their landing study included a comparison between a non-tunnel display without prediction (12A) with a non-tunnel display with prediction (cell 12B). The comparison of prediction alone, when the tunnel was absent, demonstrated a benefit for both lateral (50% reduction) and vertical tracking (45%), relative to no prediction. It should be noted that this study did not contain a condition with both preview and prediction. A study by Beringer (1999) also examined the effects of prediction. In this study pilots were asked to fly a flight path with one of two displays. The first display was an egocentric display that contained a “follow-me-aircraft” that depicted the pilot’s flight path preview by having an aircraft fly ahead of the pilot along the flight path. Pilots also had a velocity vector that provided prediction to pilots by extrapolating the aircraft position on the basis of its current velocity (12D). The second display was a standard tunnel-in-the-sky without prediction (12C). Results averaged across the flight suggested that the follow-me-aircraft with prediction produced better flight path tracking than the tunnel display without prediction. This benefit was approximately 75% laterally (211 feet for the tunnel, 55 feet for the follow-me-aircraft with prediction) and 65% vertically (144 feet for the tunnel, 42 feet with the follow-me-aircraft) with prediction. Results clearly demonstrate that the property of prediction is an important component of the tunnel benefit. It appears, however, that the benefit of prediction is not as great as the benefit of preview. Unlike preview, where benefit was greatest for lateral tracking, prediction benefits appear to be either equivalent or greater for vertical tracking. Yet prediction and preview have not been explicitly contrasted to investigate their benefits relative to each other in a fully factorial design. The current study will attempt to tease apart these two factors that are typically confounded with one another to investigate this relationship between prediction and preview further. 2.4.3 Three-Dimensional Integration. Perspective displays, such as the flight path tunnel, are three-dimensional, mapping three-dimensions onto a two-dimensional image surface. Different explanations for the benefit of three-dimensional displays may be offered depending on whether the three-dimensional display is compared with a planar or coplanar display. In the contrast with planar displays, the most typical explanation proposed to account for the effect is that the three-dimensional displays contain depth information that the two-dimensional displays do not (Wickens, Haskell & Harte, 1989). For the tunnel display, the depth information (missing in the planar display) provides depth or distance information along the flight path. That is, the prediction and preview, whose benefits were described in the previous section. In the case of coplanar displays, a common explanation to account for the benefit of the tunnel display is the Proximity Compatibility Principle (PCP) (Wickens & Carswell, 1995). The Proximity Compatibility Principle states that tasks requiring the integration of information receive more benefit from integrated displays, while tasks requiring the focus of attention receive more benefit from separated displays. Aircraft guidance is an integrated task in that a pilot must control the aircraft in (integrated) three-dimensions. Therefore, for aircraft guidance, the depth
26
information is integrated in the tunnel rather than displayed separately in the coplanar displays. This helps reduce cognitive inference of current position by relieving the pilot of having to integrate information across spatially separated displays (see Figure 9). The benefit of three-dimensional displays over two-dimensional displays is a robust finding within the tunnel literature (e.g., Grunwald, Robertson & Hatfield, 1981; Wickens & Prevett, 1995; Olmos, Wickens, & Chudy, 2000; Regal & Whittington, 1995; Reising, Barthelemy & Hartsock, 1989; Ververs, 1998; Haskell & Wickens, 1993). This was seen extensively in Section 2.4.2.2 under the comparison between the three-dimensional tunnel and the two-dimensional planar format in the context of preview. However, it may be argued that only when equivalent depth information is contrasted between two-dimensional and three-dimensional renderings may the true effects of dimensionality be seen. That is, the tunnel display advantages might not result from its threedimensional perspective characteristics, but rather from the absence of information about the third dimension in the uniplanar displays with which it was compared. To address this possibility, three studies have compared tunnel displays with coplanar displays that present an explicit representation of longitudinal future flight path (with preview or prediction or both), but not in an integrated three-dimensional picture. A study by Haskell and Wickens (1993) compared a two-dimensional display and an immersed perspective flight path display (cell 12D). A two-dimensional coplanar representation was created that contained a lateral prediction display, a vertical prediction display and a twodimensional aircraft attitude representation (cell 11D, plus an two-dimensional flight path display). These three two-dimensional displays were located near one another but were separate from one another, unlike the immersed three-dimensional flight path display that was integrated. Results suggested that the immersed perspective flight path display helped pilot performance over the suite of 2D displays for lateral and vertical error. Lateral error was reduced by 44% and vertical error was reduced by 25%. Airspeed tracking performance was better in the coplanar display. Airspeed errors were increased by 25% with the tunnel compared to the coplanar display. Wickens and Prevett (1995) also compared a two-dimensional coplanar display (cell 11D) with an immersed perspective flight path display (cell 12D) in a replication of Haskell and Wickens’ (1993) study. Results showed that performance on the tunnel display was better than the coplanar display for lateral mean absolute error, reducing the error by 70% (130 feet for the coplanar display, 40 feet for the tunnel display). Vertical mean absolute error was also reduced by 20% for the tunnel over the coplanar displays (25 feet for the coplanar display, 20 feet for the tunnel display). Olmos, Wickens, and Chudy (2000) contrasted a two-dimensional coplanar display (cell 11D) with a modified immersed perspective flight path display (cell 12D). The tunnel display was also augmented with a wide-angle view placed underneath the tunnel display. Subjects were asked to fly a series of flight legs of varying heading and vertical speed. The dependent measure was the time to traverse a flight path. Results indicated that the performance on the modified tunnel display demonstrated a speed benefit of 5% faster completion relative to the coplanar display (112 seconds for the coplanar, 106 for the tunnel display).
27
Both the studies of Haskell and Wickens (1993) and Wickens and Prevett (1995) clearly demonstrated the advantage of the three-dimensional tunnel over the two-dimensional coplanar displays when all other characteristics were held constant, thus providing support for the integration benefit explanation. Therefore, the benefit of three-dimensionality has been well established and will not be examined in this study. 2.4.4 Frame of Reference. In addition to portraying the future (prediction and preview) and being integrated (three-dimensional), tunnel displays also have the property that they present the pilot’s information from an immersed viewpoint. This section details the extent to which the benefit of the tunnel display on flight path guidance tasks is a property of this immersed (egocentric) viewpoint location in comparison to more exocentric frames of reference (see Figure 5). Two issues between egocentric and exocentric frames of reference help explain the tunnel benefit. These two accounts include immersion effects and display ambiguities from perceptual linking. One possible explanation for the perspective flight display benefit may that the egocentric viewpoint in the perspective display is more consistent with our natural viewpoint than a nonimmersed viewpoint (Wickens, Todd & Siedler, 1989; Yeh & Silverstein, 1992, Wickens, 1999). This leads to a consistency in representation between what the observer typically views when navigating as opposed to a viewpoint that may be unexpected or novel. This also means that an egocentric frame of reference generates compatibility between the axis of display rotation and the axis of control. A second explanation for the tunnel benefit from frame of reference effects relates to the display ambiguity in an exocentric display resulting from viewpoint position (Boyer & Wickens, 1994; Haskell & Wickens, 1993). In an egocentric display (such as the tunnel), the viewpoint is positioned directly and closely behind the element being controlled (see Figure 5). When the viewpoint is in this position, the display produces line-of-sight ambiguity along the axis of flight where the depth plane is compressed onto the two-dimensional viewing surface. However, the viewpoint at this location (behind the controlled element) preserves the lateral and vertical dimensions (no compression) in the display (McGreevy & Ellis, 1986). In an exocentric viewpoint, the viewpoint is no longer positioned directly behind the controlled element but is traditionally rotated upward and sometimes laterally (e.g., Ellis, McGreevy, & Hitchcock, 1987, Wickens & Prevett, 1995). This allows the viewer to see in depth or distance along the flight path to a greater degree because the depth dimension is no longer completely collapsed, but the lateral and vertical dimensions are no longer unambiguously preserved and can become distorted. The amount of distortion is affected by the degree of offset of the exocentric viewpoint. Displacement of the viewpoint upward will distort the display in the vertical dimension while displacements of the viewpoint laterally will distort the lateral axis. As a viewpoint increases in vertical angle from directly behind the flight path, the position of the current aircraft location (and predictor) along the flight path becomes more ambiguous. In the current experiment, the exocentric viewpoint remains centered laterally with the controlled element, but is offset vertically by 10 degrees. Therefore, the lateral axis remains undistorted, but judgments along the vertical axis become ambiguous. This may create problems of “position linking” along the flight path (see Figure 13) in which it is unclear where the viewer anchors the current aircraft location along the tunnel. For example, as shown in the figure, an aircraft currently positioned above the first tunnel box may be seen either here or midway in the second
28
29
Side View of Exocentric (Tethered) Display
?
Actual current aircraft position
Front view
Figure 13. An example of ambiguity of position due to exocentric viewpoint. With this view it is unclear to the pilot exactly the position of the aircraft along the pathway (front view). The current position could be seen as either high in the first segment or positioned within the second segment. Prediction and preview can help resolve the ambiguity. Preview can reduce the ambiguity by providing a representation of the future flight path. Prediction helps by showing where the pilot will be given his or her input now. Together, prediction and preview help indicate that the vertical position is in the second segment, rather than high on the first.
Up
Ambiguously perceived position
box. This ambiguity of position along the flight path is a direct consequence of the location of the viewpoint. The ambiguity then may make it difficult to “link” the corresponding position of the aircraft and the tunnel boxes. When this link is uncertain, the vertical deviations of the plane from the center of the tunnel will increase. The frame of reference effects reported here affect the early stages of the informationprocessing model, shown in Figure 7. These effects are perceptual in nature and relate directly to ambiguity of the visual information contained in the display. The correction for ambiguity in an exocentric frame of reference, however, is cognitive in nature. For example, to compensate for problems with perceptual linking, pilots may attempt to mentally rotate the image to resolve the ambiguity (Barfield, Hendrix, & Bjorneseth, 1995). This will increase cognitive workload and mental processing, affecting cognitive processes at later stages of the information-processing framework. As with the other variables, frame of reference effects are well documented for display performance. For local guidance tasks, an egocentric frame of reference generally produces the best performance (Peruch, Vercher, & Gauthier, 1995). Olmos, Wickens, and Chudy (2000) compared an exocentric display with a tunnel display in a non-landing task. The task was to fly a series of missions from which the time to complete the mission was recorded. Results indicated that the performance using the egocentric display was faster than with the exocentric display, providing a 7% reduction in completion time (114 seconds for the exocentric display, 106 seconds for the egocentric display). Wickens and Prevett (1995) also compared egocentric and exocentric displays. This study used four displays that included a fully egocentric display and three exocentric displays at different tether lengths. Results from this cruise and landing task demonstrated that the egocentric display was superior to all the exocentric displays for both vertical and horizontal mean average error. The egocentric display led to a minimum of 70% and a maximum of 80% reduction in lateral tracking error across all the tether lengths. Vertical tracking error was also reduced in the egocentric condition by a minimum of 30% and a maximum of 70% across all of the exocentric tether lengths. Notice that in this study the exocentric viewpoint was offset both in the lateral and vertical dimensions, which led to a decrement in performance in both dimensions with the exocentric viewpoint. This fact will be important in interpreting the results of the current study. In a study on interactive data visualization, McCormick, Wickens, Banks and Yeh (1998), asked subjects to “pilot” from one data point to another in one of four display conditions. The conditions included an egocentric display and a tethered exocentric display. Data from this study suggested that performance in traveling from one data point to another was no different for the egocentric display in relation to the tethered exocentric display for travel time between points. However, this study did not include preview or prediction in the display. A study by Barfield, Rosenberg, and Furness (1995) also compared frames of reference for local guidance (flight) and situation awareness (understanding of the surrounding area) tasks. Non-pilot subjects were asked to fly an aircraft through a virtual world to sequentially appearing poles, using the egocentric and exocentric displays. At the end of each trial, subjects were asked
30
to reconstruct the environment and the path flown to assess situation awareness. Results indicated that flight path deviations were smaller for the egocentric display (3600 feet) than the exocentric display (4500 feet). However, these data were not analyzed in terms of lateral and vertical error, but in total error. Situation awareness was supported best by an exocentric frame of reference. In summary, egocentric displays show a clear benefit over exocentric displays. A 7% reduction in trial completion time was found for the egocentric display in the Olmos, Wickens and Chudy (2000) experiment. Wickens and Prevett (1995) show reductions in error for both lateral and vertical flight path tracking when an egocentric display is compared against exocentric displays. Barfield, Rosenberg and Furness (1995) also showed a benefit for the egocentric display over the exocentric display. However, the McCormick et al. (1998) study suggests that, at least in some cases, egocentric displays are equivalent to tethered exocentric displays for completion time. This difference is likely due to the absence of preview and prediction. This experiment will manipulate preview and viewpoint location independently to help identify the relative benefit of viewpoint location on the tunnel benefit apart from effects of preview. 2.4.5 Display Gain. Display gain refers to the ratio of change in a display to the user’s input (e.g., Wickens & Hollands, 2000). Higher gain is a large change in the display to a small user input while lower gain is a small change in the display to a large user input. For the perspective flight display, the egocentric frame of reference generates a greater display gain of the system than an exocentric frame of reference because the viewpoint is in the tunnel (at the first segment), rather than farther behind it. Higher gain leads to an increase in displayed error that may lead to more aggressive correction than for small displayed errors (McRuer & Krendel, 1959). This could lead to lower control error (improved flight path tracking) and will lead to higher control activity. Thus the use of the immersed perspective flight path increases gain that may well be the source of benefit to performance. However, these display gain effects are confounded with the frame of reference and have not yet been effectively teased apart. Just as frame of reference effects alter perceptual processing due to direct changes to visual information, display gain also affects the perceptual stage of the information-processing model (see Figure 9). Larger error deviations due to high gain result in corresponding changes in visual information in the display. More aggressive control (and smaller flight path deviations) in a high gain display may be due to the perceptual information in the display. Therefore, better tracking performance from a high gain display may be due to perceptual processing rather than the amount of cognitive inference required to correct the error in comparison to a low gain display (exocentric viewpoint). The fact that moderate levels of gain benefit tracking performance is a well-known effect (e.g., Wickens & Hollands, 2000; Wickens, 1986) but the extent to which the egocentric frame of reference benefit can be accounted for by higher gain has not been directly investigated. However, Haskell and Wickens (1995) performed a post-hoc analysis of gain in their study. They compared the ratio of size of the boxes between the tunnel display and the coplanar display. Then ratios of tracking errors both laterally and vertically were calculated and compared against
31
the size ratio. The tracking error ratios were greater than the size of the box ratios, suggesting that the benefit to performance of the three-dimensional, immersed, display was not completely due to its higher display gain, but also something else. The results from the Haskell and Wickens’ post-hoc analysis suggest that the integration of information (dimensionality) can account for some, but far from all, of the tunnel benefit over a co-planar displays. In a corresponding fashion this study will examine the extent to which differences in display gain can account for the anticipated advantages of the immersed display over the exocentric display. This study will include an egocentric condition in which the gain is lowered to an equivalent value of gain in the exocentric display to address this question. 2.4.6 Conclusions. Most of the past research on the immersed perspective flight path display has concentrated on the use of the immersed perspective flight path with little attention paid to the causes behind the advantage of the flight path. Positive effects of dimensionality reduce cognitive inference of current position through a presentation (planar) or integration (coplanar) of depth information. An egocentric frame of reference and high display gain shift information-processing effects toward the perceptual side of the information-processing cycle by inducing larger changes directly to the visual display. Prediction and preview help reduce cognitive inference by making explicit the desired state of the system (preview) and the actual state of the system in the future (prediction). In essence, each of these display augmentations helps shift processing toward the perceptual stage. This shift is consistent with a recent approach to display design, ecological interface design (EID), which advocates directly perceivable displays in which knowledge in the world (display) replaces knowledge and computation in the brain (Vicente & Rasmussen, 1992, Sanderson, Flach, Buttigieg, & Casey, 1989). While the current experiment does not address the amount of cognitive processing that occurs during flight path tracking, it will provide an indication of the relative benefits of each variable, providing some insight into the placement of these elements along the information-processing cycle. A summary of these benefits revealed in the literature is provided in Figure 14. The figure shows a schematic of the relative benefits in flight path tracking, completion time and error violation found in the literature for the variables of dimension, prediction, preview, and viewpoint location. It is clear from this figure that the relative benefits of each factor on performance with the tunnel appear to be roughly equivalent, though a tentative ranking of the variables appears to be, in diminishing order of effect size: preview, prediction, viewpoint location, and dimensionality. A trend for prediction and preview to affect the lateral axis more than the vertical axis can also be seen. This would be expected, since the lateral axis is higher order in an aircraft (3rd order) than the vertical axis (2nd order) and therefore the lateral axis would benefit more from prediction and preview than the vertical axis. It may be anticipated that a corresponding asymmetry of prediction and preview may appear in this experiment. However, it should be noted that one study (Jensen, 1981) demonstrated a reversal in this asymmetry by finding that vertical error was reduced more than lateral error for prediction.
32
33
Control axis Comparison Feature
-10%
0%
10%
20%
30%
40%
Lateral 3D
Vertical 3D
= Mean Value
= Completion Time
Vertical Prediction
Tunnel Element
Lateral Prediction
Lateral Preview
Vertical Preview
Lateral Egocentric
Vertical Egocentric
Figure 14. A plot of relative benefits for tunnel elements. Benefits are plotted in reference to an three-dimensional egocentric tunnel with prediction and preview. A positive benefit means error is reduced with the tunnel present in comparison to the alternate condition. Display gain lacks information about lateral or vertical benefits and is not shown. Squares are for completion time rather than lateral or vertical deviations. The filled circles are the approximate mean value of the benefit for each variable.
% Benefit
50%
60%
70%
80%
90%
= Tracking Error
When these variables of dimensionality, frame of reference, prediction, preview, and gain have been manipulated in past research using a tunnel display, they have not generally been manipulated independently or factorially in such a way that the relative strengths of different factors, nor the interactions between them, can be directly assessed. In particular, the absence of any study which has factorially manipulated the presence of both prediction and preview prevents any assessment of the interaction between the two. Five explanations have been offered as possible reasons behind the power of perspective flight paths. Four will be pursued further. The role of display dimensionality will not be addressed in this experiment because this variable has been extensively studied in other experiments. The variables of viewpoint location, preview, prediction and display gain will be manipulated independently to directly investigate the relative contribution of each factor in the benefit for the immersed perspective flight path. While the studies above have investigated some of these factors, no study has manipulated more than two of these factors at the same time or has tried to systematically extract the relative contributions of each factor. That is the purpose of this experiment. 3. Experimental Method 3.1 Task The task used involved an aircraft non-landing flight path tracking task. A flight path tracking task was of interest for this investigation as it provided a task that included large changes in path headings which was useful for gaining information about the variables of interest. This also allowed this study to be consistent with many other studies that have used a non-landing flight path tracking task previously (e.g., Adams, 1982; Fadden & Wickens, 1997; Nataupsky & Crittenden, 1988; Olmos, Wickens & Chudy, 2000; Reising, Barthelemy & Hartsock, 1989). Pilots were required to maintain the center of the flight path as much as possible. 3.2 Subjects Subjects for the experiment included pilots from the training program at Willard Airport. During each semester, a pool of students that have familiarity with aircraft is available and the experiment subjects were taken from these students. Pilots were screened for corrected to normal vision (due to the visual nature of the display). Pilots were also screened for number of flight hours. These pilots were required to have amassed at least 100 hours of flight time in real aircraft, to have prior experience with flight dynamics. Pilots had an average of 153 hours of flight time (ranging from 110-225 hours). Twenty-four subjects (three women and twenty-one men) participated in the study. Pilots were used for ease of generalization to prior experimental results. Two subjects had to be replaced with additional subjects. One subject took an hour longer to complete each session than any other subject due to an orientation issue present in the no tunnel display and a second subject did not complete the entire experiment. 3.3 Apparatus and Displays A Silicon Graphics IRIS Elan computer controlled the simulation. The IRIS Elan generated the visual displays and projected the designed flight paths. Flight dynamics and data collection were also generated by the IRIS Elan system. The display was refreshed at 21 frames
34
per second. An IBM PC AT system was connected to the Elan through an analog input, serial connection. The IBM PC controlled the joystick input. The joystick input was limited to a 90degree bank to either the left or right to eliminate upside-down flying within the simulator. 3.3.1 Visual Displays. Eleven different displays are characterized in Figure 15 and mimic displays already described in Figures 10, 11, and 12. Figure 15 portrays a 3 (prediction) X 2 (preview) X 2 (viewpoint location) partially crossed factorial design such that one level of the prediction variable is not defined at the exocentric location. An added low gain condition is also provided. Each cell in Figure 15 corresponds to a display example with the matching letter label in Figure 16. For example, the conditions in cell 15A match the display shown in Figure 16A. The predictor is the inverted “T” in the display and the boresight (or current ship status) is the “W” in the displays. The display corresponding to cell 15A also matches the conditions in cell 9D against which most of the comparisons in the literature review in section 2.4 were made. In this display the tunnel was presented with the current aircraft symbol, a predictor symbol and an immersed (egocentric) viewpoint, similar to the display shown in Figure 16A. All tunnel segments (when displayed) were 200 feet wide, 75 feet high, and 1000 feet long. The display for cell 15D was the same display as the display for cell 15A but with the viewpoint extracted from the aircraft for an exocentric viewpoint, as shown in Figure 16D. The viewpoint is increased 5 degrees of vertical angle and 600 feet further back than the egocentric viewpoint from the boresight (10 degrees vertical angle, 2000 feet total). When the viewpoint is pulled back from the aircraft, the viewpoint includes both the aircraft and the flight path and a movement will generate a display change in both the aircraft and the flight path. To augment the sense of exocentricity, or world referencing, pursuit movement was used for all exocentric displays in which both the boresight and tunnel moved so that the pilot could distinguish bends in the tunnel (command input) from deviations of the aircraft (disturbances or pilot control). In addition, the exocentric displays contained a set of two green bars on the bottom of the tunnel that were yoked to the position of the boresight along the pathway. This was done to resolve some of the depth ambiguity between the boresight and the tunnel, explicitly informing the pilot’s point in depth along the tunnel. For example, it may be difficult for pilots to distinguish between a high altitude on a close tunnel segment, or centered within the tunnel on a near tunnel segment. The two green bars are intended to help subjects help resolve this ambiguity and were present in all conditions displaying the tunnel to equate for the presence of this symbology. The display for Cell 15B was similar to the display for cell 7C from the literature review. It is a flight director display that uses quickening to show the error plus its derivatives to the pilot, thereby generating a predicted (quickened) error display rather than the status display. In this condition the prediction symbol was removed and replaced by the current status symbol (the boresight). Thus the pilot was controlling the predictor. Since the normal predictor is extrapolated position (via error and derivatives) from current input, the pilot viewed quickened information. However, this condition was different from cell 7C in that the tunnel also was visible.
35
Egocentric Full Prediction Preview Reduced Gain K
Egocentric Viewpoint
Prediction
Egocentric Quickening Preview B
Egocentric Full Prediction Preview A
Egocentric No Prediction Preview C Present (Tunnel)
Exocentric Viewpoint
Viewpoint Location
Egocentric Viewpoint
Exocentric Full Prediction Preview D
Exocentric No Prediction Preview E
Full Prediction
Quickening
No Prediction Preview
Egocentric Full Prediction No Preview F
Egocentric Quickening No Preview G
Egocentric No Prediction No Preview H Absent
Exocentric Viewpoint
Exocentric Full Prediction No Preview I
Exocentric No Prediction No Preview J
Full Prediction
Quickening
No Prediction
Figure 15. Experimental Design. Viewpoint location (egocentric and exocentric) and Prediction (full, quickening, no) are within-subject variables. Preview (present and absent) is a betweensubjects variable. Display gain is manipulated in Condition K. Letters A-K refer to explanations in the text.
36
37
Figure 16A. A sample experiment display: Egocentric viewpoint location, preview present, and full prediction condition.
38
Figure 16B. A sample experiment display: Egocentric viewpoint location, preview present, and quickening condition.
39
Figure 16C. A sample experiment display: Egocentric viewpoint location, preview present, and no prediction condition.
40
Figure 16D. A sample experiment display: Exocentric viewpoint location, preview present, and full prediction condition.
41
Figure 16E. A sample experiment display: Exocentric viewpoint location, preview present, and no prediction condition.
42
Figure 16F. A sample experiment display: Egocentric viewpoint location, no preview present, and full prediction condition.
43
Figure 16G. A sample experiment display: Egocentric viewpoint location, no preview present, and quickening condition.
44
Figure 16H. A sample experiment display: Egocentric viewpoint location, no preview present, and no prediction condition.
45
Figure 16I. A sample experiment display: Exocentric viewpoint location, no preview present, and full prediction condition.
46
Figure 16J. A sample experiment display: Exocentric viewpoint location, no preview present, and no prediction condition.
47
Figure 16K. A sample experiment display: Egocentric viewpoint location, preview present, full prediction, and reduced gain condition.
The display for cell 15C was the same as the display for cell 9C in the literature review. In this condition, a display was shown with preview and an egocentric viewpoint, but without prediction, as shown in Figure 16C. The display for cell 15E was the same display as the display for cell 15C but with the viewpoint pulled back from the aircraft as shown in Figure 16E. The six cells at the bottom of the design in Figure 15 are identical to the six at the top, except that the preview (tunnel) was removed. The display for cell 15F was similar to the display for cell 9B in the literature review. In this condition, an egocentric display was shown with prediction, but no preview. Since the tunnel is removed in this condition, the current commanded flight path location is represented by a single box as shown in Figure 16F. This box is larger than that depicted for cell 15A because it represents the nearest point on the flight path just before it would disappear off the screen which is consistent with an egocentric frame of reference without preview. Cell 15I is similar to the display in cell 15F but had the viewpoint pulled back from the aircraft as shown in Figure 16I. Removing the tunnel from the exocentric display, however, can lead to some ambiguity in the display. For example, in Figure 17A, if the tunnel were removed (Figure 17B), the predictor symbol would (falsely) be perceived as being above the aircraft, in the absence of the salient three-dimensional depth cues provided by the tunnel. In order to compensate for this ambiguity, the predictor was connected to the boresight by a bar. This bar was green when the angle between the predictor and boresight was parallel to the tunnel (equivalent to the angle of the flight path) and red all other times. This augmentation was included in all conditions that contained a predictor to equate for this extra symbology across prediction displays. The display for cell 15G was the same as cell 15B except that the tunnel was removed and replaced with the flight path box as shown in Figure 16G. The conditions with quickening (15B and 15G) are between the levels of full prediction and no prediction because quickening provides some information about the control inputs needed to be made to control the future position of the aircraft, which is more information beyond the current state of the aircraft, but less than the full future state of the aircraft provided through prediction. The display for cell 15H was similar to the display for cell 9A in the literature review. In this condition, an egocentric display was shown without prediction and without preview as shown in Figure 16H. The display for cell 15J was the same as the display for cell 15H, except that the viewpoint was pulled back away from the aircraft as shown in Figure 16J.
48
49 B
C
Figure 17. Exocentric-prediction ambiguity. A. An tunnel display with an exocentric viewpoint and prediction. B. The same view as in Panel A but with the tunnel removed. It is unclear in this case if the predictor is above the boresight or in front of it. C. The display augmentation that helps resolve ambiguity of vertical location of the predictor relative to the boresight, by changing color (shown as dashed here) when the predictor and boresight are parallel to the specified flight path.
A
Finally, the display for cell 15K involved a reduction in display gain in comparison to the control condition display (cell 15A). This display does not have a counterpart in Figures 10, 11 or 12. This condition contained a display that is egocentric, but smaller in comparison to cell 15A, so the information on the display was equivalent to Cell 15A, but the amount of change in the display (gain) was reduced, as shown in Figure 16K. The reduction of the size of the display was equated to the ratio of difference in size between the egocentric and exocentric displays. Recall that one explanation offered for the tunnel benefit was that the difference in display gain between egocentric and exocentric displays might play a role in the tunnel benefit. If the display gain in the egocentric display of 15K is equated to the level of gain in the exocentric display (by placing the egocentric display at the same size ratio as the exocentric display), then the relative benefit contributions of reduced gain and exocentric location can be independently established. So the size of the display for condition 15K was based on the ratio of size between the displays of condition 15A and 15D, which differ from each other only in terms of viewpoint location. In all displays containing a predictor symbol (15A, 15D, 15F, 15I, 15K) the predictor symbol was presented three seconds into the future. In the displays without prediction (15C, 15E, 15H, 15J), the predictor symbol was completely removed. These eleven conditions outline the different displays used in the current experiment. 3.3.2 Flight Paths. Eighty-four flight paths were used in the experiment. They were constructed from a set of twelve flight paths (see Figure 18). These twelve pathways had nine to fourteen legs each. Each leg was either 2000 or 3000 feet in length. These path segments were kept short to reduce the amount of time in straight and level flight, yet long enough to avoid the necessity of constant corrections by the pilot. At the end of each leg, a left or right turn was required, up to 20 degrees deflection from the current heading. In addition, the pathway would remain level, climb, or descend over the course of the new leg. If the pathway changed altitude from the previous leg, the amount increased or decreased 50, 100, 150 or 200 feet over that leg. The other 72 pathways (six groups of twelve) were constructed by modifying the original twelve in order that each path’s course was somewhat unpredictable. The first new set of twelve had pilots fly the original twelve pathways in reverse. The second new set of twelve reversed the altitude changes in the pathways. For example, if a leg in one of the original pathways went upward for 100 feet, the same leg in the corresponding new pathway would go down 100 feet. The third new set of twelve was a mirror image of the original set such that left and right turns were reversed. For example, if a leg turned 15 degrees right in the original pathway, the same leg in the corresponding new pathway turned left 15 degrees. The final three sets of pathways were combinations of the other revisions. The fourth new set of pathways was a combination of both reverse and up-down combinations. The fifth new set of pathways was a combination of reverse flying and mirror turns. The final new set of pathways was a combination of reverse flying, updown changes and mirrored pathways. These six sets of pathways, when combined with the original twelve, provided a total of 84 different pathways.
50
Figure 18. Examples of the baseline pathways used in the experiment. The black circles indicate the starting position along the pathway. The top of the page equals north in the coordinates within the simulation.
51
3.4 Design An overview of the experimental design is provided by the structure of Figure 15. The design contained three independent variables crossed in a 3x2x2-2 partially crossed factorial design: prediction, preview and viewpoint location. Two cells are removed because a flight director does not represent status information, and therefore changing viewpoint location is impossible. This is because pulling back the viewpoint location does not affect the amount of projected error between the flight path and the aircraft. Therefore, the display of that error will also be unaffected. A fourth variable, display gain, contained only two conditions. Conditions AK are labels for the individual combinations of the design. The first variable, viewpoint location, contained two levels: egocentric and tethered/exocentric. The second variable, prediction, contained three levels: prediction, quickening and no prediction. The third variable, preview, contained two levels: present (tunnel) and absent (no tunnel). The final independent variable, display gain, contained two levels, full gain and reduced gain. The variables of frame of reference, prediction and display gain were manipulated as within-subjects variables as each subject saw all levels of each variable. Viewpoint location was a between-subjects variable to reduce the number of trials each subject had to perform. The control condition (cell 15A) was the condition with an immersed viewpoint, prediction, and preview, as this is the standard for current immersed perspective flight displays (e.g., Ververs, 1998). The dependent measures included root mean square errors for both lateral and vertical deviations, mean number of resets (how often the pilot was out of the tunnel for more than 15 seconds), and mean number of control inputs. 3.5 Procedure Student pilots obtained from the training pool were randomly assigned to one of two groups. One group was assigned to the Preview group that viewed conditions A-E of Figure 15 and the other group was assigned to the No Preview group that viewed conditions F-J of Figure 15. Subjects were balanced between groups for number of flight hours. The Preview group had an average of 148 flight hours and the No Preview group had an average of 159 flight hours. Subjects were asked to complete some paperwork including a consent form and a demographics form (see Appendix A). Subjects were instructed on the purpose of the task and familiarized with the simulator. The purpose of the task was outlined in a standardized written protocol (see Appendix A) that was presented to the subject. Familiarization with the simulator came in the form of twelve practice trials with the simulator. The subject’s task was to fly a series of twisting corridors in space through the virtual environment that was terminated once a goal position is reached. If subjects lost the flight path (tunnel or box) off the screen for more than 15 seconds, the subjects were reset at the start of the next pathway segment and given the word “RESET” in the upper left corner of the display. Pilots were propelled along the pathway at a constant airspeed of 140 knots (approximately 120 miles per hour) for all trials.
52
Each pilot flew eighty-four flight paths (seven blocks of twelve paths) over two sessions. The first session consisted of a block of twelve practice trials followed by two sets of experimental blocks. The second session completed the other four experimental blocks. In the first session, the subject was given a block of twelve trials for familiarization with the cruise task. The practice consisted of two trials of the reduced gain condition followed by two trials each of the five conditions in their group (15A-15F or 15F-15J). Experimental trials then proceeded, with each subject viewing the other 72 trials, in 6 blocks of 12 trials over the two sessions. Each block contained trials of the same condition and paths from one set of flight paths. Each flight path was used once in each block. The blocks of experimental conditions and sets of pathways were counterbalanced across conditions. However, the reduced gain block of trials always came for all subjects on the first block on the second session. This was to help reduce training effects for the no tunnel group, where the reduced gain condition (which contained a tunnel) might have increased later performance in the no tunnel condition. Each flight path lasted approximately four minutes. The first session lasted approximately two and a half hours and the second session two hours. At the end of the experiment, subjects were given a standardized debriefing form (see Appendix A). Subjects were paid $6 per hour for their participation and had been offered prize money for top performance. Following the completion of data collection for the experiment, the top and second place performers (in terms of smallest number of lateral and vertical deviations) in both the tunnel and no tunnel group were recalled and awarded prize money. 3.6 Data Collection Data were sampled approximately every 2 seconds and summed to provide the dependent measures of altitude root mean square error, lateral root mean square error, mean number of resets (number of times the pilot lost the pathway or box off the screen for 15 seconds), and mean number of control inputs. Error values for when the pathway was lost (completely off the screen) were not included in the deviation measures. 3.7 Data Analysis Analysis of the data was by an analysis of variance (ANOVA) upon the dependent measures. The differences between means for each variable provide an indication of the relative benefit for each variable to the tunnel benefit. Two pathways had to be removed during the course of the experiment due to a programming error. At the end of these two pathways, the final leg turned ninety degrees left or right. These two pathways were caught early in the experiment and replaced with a duplicate of another pathway from within the same set for remaining subjects. This error led to a loss of four trials in total. 4. Hypotheses For the four factors outlined above, viewpoint location, prediction, preview, and display gain, a number of hypotheses may be proposed apriori (see Figure 19). Main effects for each of the variables are expected, as each of the properties of the tunnel under investigation are assumed to contribute in some way to the tunnel benefit, as described in the Introduction.
53
High
With preview
Deviation
Without preview
Low
Egocentric
Exocentric
A High
With prediction
Deviation
Reduced prediction Without prediction
Low
Egocentric
Exocentric
B
High
With prediction
Deviation
Reduced prediction Low
Without prediction With Preview
Without Preview
C Figure 19. Graphs of experiment hypotheses. Panel A shows the graph for the prediction of viewpoint location with preview. Panel B shows the graph for the prediction of viewpoint location with prediction. Panel C shows the graph for the interaction of preview with prediction in which performance with both preview and prediction is better than each individually.
54
More importantly, as summarized at the end of section 2.4, the relative contribution between the properties appears to be, in diminishing order: preview, viewpoint location, prediction, and dimensionality. The effect of display gain has not been directly investigated and so it’s placement in the ordering cannot be determined and the current experiment did not examine the effects of dimensionality. Finally, based on the general patterns of benefits between the lateral and vertical axis, and the fact that the lateral axis is of higher order (with longer lag), it is anticipated that prediction and preview benefits will be greater for the lateral axis than the vertical axis. While the main effects of the variables and the ordering of the relative benefits of the variables may be ascertained, less certain are the existence of possible interactions between properties. The data cited in section 2.4 lacks any orthogonal or factorial comparisons between viewpoint location, prediction and preview within a single experiment. Therefore, the lack of data suggesting whether preview mediates the benefit of the egocentric display over the exocentric display leads to an assumption of no interaction. Assuming no interaction between the variables for the tunnel display, the combination of main effects may be additive in nature (see Figure 19A). Thus the conditions of egocentric/with preview (15A, 15B, 15C) should yield best performance, with egocentric/no preview (15F, 15G, 15H) and exocentric/preview (15D and 15E) roughly equal and exocentric/no preview worst (15I and 15J). Similarly, there are no data that deals directly with the interaction between viewpoint location and prediction for the tunnel benefit. In this case, assumption of no interaction appears again (see Figure 19B). An additive model may again be adopted with the egocentric/full prediction (15A and 15F) at the top, exocentric/full prediction (15D and 15I) and egocentric/quickening (15B and 15G) approximately equal, and egocentric/no prediction (15C and 15H) further below and exocentric/no prediction (15E and 15J) at the bottom. Again, there are no data for the tunnel benefit that compares this benefit with and without prediction directly. While there are a number of studies that include prediction and preview (e.g., Jensen, 1981; Grunwald et al., 1981; Theunissen, 1995; Lintern et al., 1990), none report data from a condition of both prediction and preview versus a condition both without prediction and without preview. While it appears that Lintern et al. (1990) did include such conditions in a 2X2 factorial design (prediction X preview), they did not separately report the data from all four cells of this design in such a way that the existence of an interaction could be determined. However, it may be hypothesized that there is an interaction of prediction with preview such that the benefits of one may be amplified by the presence of the other (see Figure 19C). A pilot may have increased performance when knowledge about what should be done (preview) is paired with the extrapolation of what the pilot is doing (prediction). A comparison of conditions 15K (reduced gain) with 15A and 15D will provide a tentative first step in understanding the effects of display gain. If 15K and 15D are equivalent, then the cost of an exocentric viewpoint can be assumed to be entirely due to its reduced gain. However, if 15K is better than 15D (but worse than 15A) then lower gain impairs performance compared to higher gain display, but there is an added cost to having an exocentric viewpoint. Finally, if 15K is equal to 15A then gain has little or no influence on tunnel performance by itself.
55
5. Results The data were screened for outliers. Trials in which the data were greater than three standard deviations from the group mean were removed and replaced with group means (McClelland, 2000; Judd & McClelland, 1989). Out of 6896 total trials used (1724 trials for each of four variables), 80 trials (1.16%) were replaced. Table 1 displays the means and standard deviations for all conditions in the experiment. Table 1. Means and standard deviations for all conditions in the experiment. Condition labels correspond to those outlined in Figure 15. Condition A
B
C
D
E
H
I
J
K
59.85 49.95
81.74 74.67
47.92 107.91
92.96 209.28
29.73 15.27
87.53 135.06
63.59 36.44
11.94 8.51
1.63 0.38
1.74 0.42
1.50 0.29
1.66 0.36
1.40 0.32
1.78 0.32
1.72 0.30
1.01 0.28
39.11 30.98
48.31 40.80
89.22 12.91
86.00 18.82
89.70 14.49
157.38 42.42
168.74 50.60
22.74 10.47
Mean Number of Resets Means and STDs Mean 0.00 0.00 0.00 0.00 STD 0.00 0.00 0.00 0.00
0.00 0.00
1.39 1.19
1.31 1.04
1.33 1.24
0.36 0.60
0.53 0.90
0.00 0.00
Mean Number of Control Inputs Means and STDs Mean 1.86 1.85 2.47 3.74 4.59 STD 0.50 0.56 0.78 1.41 1.69
3.86 0.82
3.99 0.96
4.28 1.18
5.27 1.33
5.70 1.55
2.20 0.59
RMS Altitude Means and STDs Mean 9.87 8.73 10.02 STD 7.07 9.39 7.79 RMS Log10 Altitude Means and STDs Mean 0.86 0.73 0.85 STD 0.42 0.50 0.46 RMS Lateral Means and STDs Mean 29.64 24.10 34.71 STD 15.93 11.89 14.43
F
G
Two analyses of variance (ANOVA) were performed on four variables of interest [altitude root mean square error (AltRMS), lateral root mean square error (LatRMS), mean number of resets, and control inputs]. Table 2 shows the effects for each ANOVA. The first ANOVA examined the relationship between the three primary variables of interest: frame of reference, preview, and prediction. Since quickened prediction is not defined at the exocentric frame of reference, the quickening data were dropped from this analysis, making it a 2 (preview) x 2 (frame of reference) x 2 (prediction) ANOVA. The reduced gain condition was also not included. Due to a high degree of skew in the altitude data (sk = 7.29), a log transformation of the altitude data was performed (sk = -0.79 after transformation). The lateral data did not show this skew and therefore were not transformed.
56
Table 2. Main effects and interactions for two ANOVAs reported on eight variables. Significant effects are highlighted in bold font. Borderline significant effects are highlighted in italics. See the main text for an explanation of the effects. ANOVA 1: 2 (frame of reference) x 2 (preview) x 2 (prediction) df
FOR Preview Prediction FOR x Preview FOR x Prediction Preview x Prediction FOR x Prediction x Preview
1, 22 1, 22 1, 22 1, 22 1, 22 1, 22 1, 22
Log10 Altitude RMS F 108.36 13.04 0.13 23.29 1.15 1.54 0.35
df
FOR Preview Prediction FOR x Preview FOR x Prediction Preview x Prediction FOR x Prediction x Preview
Mean # Resets F 19.96 18.20 0.08 19.96 0.08 2.00 2.00
1, 22 1, 22 1, 22 1, 22 1, 22 1, 22 1, 22
p 0.0001 0.0015 0.7239 0.0001 0.2962 0.2270 0.5621
Lateral RMS F 77.99 137.63 7.54 41.14 2.13 0.07 0.39
p 0.0001 0.0001 0.0118 0.0001 0.1584 0.7940 0.5385
p 0.0002 0.0003 0.7802 0.0002 0.7802 0.1715 0.1715
Control Inputs F 30.35 2.27 0.54 1.84 0.65 5.61 1.87
p 0.0001 0.1461 0.4694 0.1882 0.4294 0.0271 0.1847
p 0.0001 0.6715 0.0809
Lateral RMS F 209.79 8.98 2.13
p 0.0001 0.0005 0.1309
p 0.0001 0.9291 0.9291
Control Inputs F 43.18 5.21 5.68
p 0.0001 0.0093 0.0064
ANOVA 2: 3 (prediction) x 2 (preview) df
Preview Prediction Preview x Prediction
1, 22 2, 44 2, 44 df
Preview Prediction Preview x Prediction
1, 22 2, 44 2, 44
Log10 Altitude RMS F 83.28 0.40 2.66 Mean # Resets F 25.34 0.07 0.07
57
The second analysis examined the effects of quickening. A 3 (prediction) x 2 (preview) ANOVA was run using only data from egocentric conditions. The reduced gain condition was also omitted. A high degree of skew was also found in these altitude data (sk = 8.36) and therefore a log transformation of these altitude data was performed (sk = -0.50 following transformation). The lateral data did not show this skew and were not transformed. Two t-tests were performed on both the lateral and vertical root mean squared error to investigate the effects of display gain. In the first t-test, the reduced gain condition was contrasted with the condition containing an egocentric frame of reference with full prediction and full preview. This was to investigate the relative effect of reduced gain in comparison to a condition that contained higher gain. The second t-test contrasted the reduced gain condition against the condition containing an exocentric frame of reference with full prediction and full preview. This was done to investigate the effect of frame of reference, unconfounded by gain, since these two conditions were equated in terms of gain. 5.1 Sources of Benefit This analysis investigated a 2 (preview) x 2 (frame of reference) x 2 (prediction) ANOVA for the log transformed root mean square altitude deviations, root mean square lateral deviations, mean number of resets, and control inputs. This analysis did not include data from the quickening or reduced gain conditions for any of the four dependent variables. 5.1.1 Altitude Deviations. Figure 20 depicts the log transformed root mean square deviations in the altitude axis. Figure 20 shows an egocentric frame of reference benefit [F (1,22) = 108.36, p