Recording network logs to monitor, what has been going on is one form of defense ..... 101304-Ping%20Flood(ICMP%20Echo)%20Detection.pdf. [7] Floyd.
IJCSI International Journal of Computer Science Issues, Vol. 9, Issue 2, No 3, March 2012 ISSN (Online): 1694-0814 www.IJCSI.org
515
Network Anomalies Detection Using Statistical Technique : A Chi- Square approach Rahul Rastogi1 Zubair Khan2 M. H. Khan3 1,2
Department of CSE, Invertis University Bsareilly India 3
Department of CSE, IET, UPTU Lucknow, India
Abstract Intrusion Detection System is used to detect suspicious activities is one form of defense. However, the sheer size of the network logs makes human log analysis intractable. Furthermore, traditional intrusion detection methods based on pattern matching techniques cannot cope with the need for faster speed to manually update those patterns. Anomaly detection is used as a part of the intrusion detection system, which in turn use certain data mining techniques. Data mining techniques can be applied to the network data to detect possible intrusions. The foremost step in application of data mining techniques is the selection of appropriate features from the data. This paper aims to build an Intrusion Detection System that can detect known and unknown intrusion automatically. Under a data mining framework, the IDS are trained with statistical algorithm, named Chi-Square statistics. This study shows the plan, implementation and the analyze of these threats by using a Chi-Square statistic technique, in order to prevent these attacks and to make a Network Intrusion detection system (NIDS). This proposed model is used to detect anomaly-based network to see how effective this statistical technique in detecting intrusions. Keywords: Intrusion Detection System,Anomaly , ChiSquare Statistics,Denial of Service.
1. Introduction Due to the fast development in Information Technology, it is cheaper and easier to develop and deploy computer networks of all shapes and sizes. By virtue, it is also cheaper and easier to probe and attack our networks. Then though with the rapid growth of computer networks make life faster and easier, while on the other side it makes life insecure as well. Internet banking, on line buying, selling, on internet, is now part of our daily life, along with that, if we look at growing incidents of cyber attacks, security become a problem of great significance. Therefore keeping our networks secure becomes vitally important. Data is very vital to an organization. Organizations usually wish to preserve
the confidentiality of their data. With the widespread use of the Internet, it has become a key challenge to maintain the secrecy and integrity of organization's vital data. Conventional techniques for network security include security mechanisms like user authentication, cryptography and intrusion prevention systems like firewalls. Intrusion Detection Systems (IDS) address problems that are not solved by these techniques. For instance, firewalls simply act as a fence around a network. It is incapable of recognizing attacks against a network. An IDS [3] is capable of recognizing this attack which firewalls is not able to prevent. Also, newer attacks are being developed that are able to penetrate through firewalls. We need newer approaches to defend against these newer kinds of attacks. IDS provide a solution to this problem. The threats that network systems are confronting come from failures of hardware or software, tentative probing and malicious attacks from local or remote hackers. Recording network logs to monitor, what has been going on is one form of defense against system failures and human attacks. Traditionally, most Intrusion Detection Systems on the market are based on pattern matching techniques. They compare the log entries to sets of pre-defined patterns. These sets of pre-defined patterns have to be manually updated frequently by security experts to handle all kinds of attacks they know so far. Apparently, those emerging attacks could easily out-pace the updating speed for those patterns. From this point of view, current IDS are far from intelligent in that they solely rely on human intervention to operate effectively. Therefore, a more advanced log analysis tool is highly desired, which should be capable of detecting known and unknown intrusions intelligently and automatically, distinguishing normal network activities from those abnormal (very possibly malicious) ones with minimum human inputs.
Copyright (c) 2012 International Journal of Computer Science Issues. All Rights Reserved.
IJCSI International Journal of Computer Science Issues, Vol. 9, Issue 2, No 3, March 2012 ISSN (Online): 1694-0814 www.IJCSI.org
1.1 IDS can be classified in two broad categories: (a) Misuse Detection [1,3]: The system learns patterns from already known attacks. These learned patterns are searched through the incoming data to find intrusions of the already known types. This method is not capable in detecting new attacks that do not follow pre-defined patterns. Consider a security guard present at an entrance who is responsible for allowing only valid persons to pass through the gate. One approach that the guard may follow would be to maintain a database of photographs of well-known culprits who should not be allowed entry. The guard can then check each incoming person with the database and find out if the person is one of those culprits. If so, the guard prevents the culprit from passing through the entrance. The problem here is that a culprit whose photograph is not in the database entrance. The problem here is that a culprit whose photograph is not in the database will be allowed entry. This approach corresponds to the Misuse Detection technique.
(b) Anomaly Detection [1,3]: Here patterns are learned from normal data. The unseen data is checked and searched to find deviations from these learned patterns. These deviations are 'anomalies' or possible intrusions. This method is not capable of identifying the type of attack. In this approach the guard may follow is to maintain a database of photographs of all the valid persons to be allowed entry. The guard allows entry to the incoming person, only if his photograph is found in the database. This way, all persons whose photographs are not found in the database are identified as culprits and not allowed entry. This approach corresponds to the Anomaly Detection technique. To get the advantages of both the approaches, an IDS [3]. system should combine anomaly detection and misuse detection techniques. Data mining from intrusion detection point of view is the search of malicious (in case of misuse detection) activity patterns or normal activity patterns (in the case of anomaly detection) from the large amount of data traveling through the network or stored in system logs. In the case of anomaly detection, the data on which data mining is trained should have all possible cases of normal data. The data should be rich enough so that no normal data is miss-interpreted as an anomaly.
516
One of the important steps in the data mining is to describe the data by summarizing its statistical attributes. The selection of the useful attributes holds the key to the success of the data mining system. This selection is done at the pre-processing stage of any data mining process. This step is an important step and consumes most of the time of the process. The use of extra features or using fewer features may drive the data mining system to a wrong way. From the intrusion detection point of view the step of attribute selection is even more important. As wrong prediction of the data mining system for the unseen data may prove hazardous to the important and confidential data of the organization.
2. BACKGROUND Designing an intelligent network Intrusion Detection System involves with a broad range of knowledge, namely network security, data mining learning algorithms and some novelty detection approaches.
2.1 Network security Issues There are many issued involved in the network security but the following are the most common. Known vulnerabilities are too many and new vulnerabilities are being discovered every day. In denial of service attack when the malicious user, attack on the resources of the remote server, so there is no typical way to distinguish bad and good requests. Vulnerability in TCP/IP protocols.
2.2 Denial of service Attacks A denial of service attacks or distributed denial of service attack is an attempt to make computer resources exhausts or disable or unavailable to its legitimate users. These resources may be network bandwidth, computing power, computer services, or operating system data structure. When this attack is launched from a single machine, or network node then it is called denial of service attack. But now days in the computer wild the most serious threat is distributed denial of service attack [4]. In distributed denial of service attack, the attacker first gain access to the number of host throughout the internet, then the attacker uses these victims as launch pad simultaneously or in a coordinated fashion to launch the attack upon the targets. There are two basic classes of DoS attacks: logic attacks and resource attacks. “Ping-of-Death”, exploits current software flaws to degrade or crash the remote server is an example of the logic attacks.
Copyright (c) 2012 International Journal of Computer Science Issues. All Rights Reserved.
IJCSI International Journal of Computer Science Issues, Vol. 9, Issue 2, No 3, March 2012 ISSN (Online): 1694-0814 www.IJCSI.org
While on the other hand in resource attacks, the victim’s CPU, memory, or network resources are overwhelmed by sending large amount of wrong requests. Because the remote server, does not differentiate the bad and good request, so to defend attack on resources is not possible. Various denials of service attacks have some special characteristics Oleksii ignatenko explain the characteristics of the denial of service attacks as in the figure 1.
3.
517
Attempt to prevent a specific user from accessing a service
The “flood” method can be deployed in many ways but the following are well known in the wild of networks system. 1. TCP-SYN Flood [5]. 2. ICMP Flood [6]. 3. RST attack [7].
2.4 Data Mining [8]
Fig 1: Denial of service attack characteristics
1.
2. 3.
4.
Attack type: a denial of service can be a distributed (when it comes from many sources) or non-distributed (when it comes from only one source). Attack Direction: attack direction may be network or system resources. Attack Scheme: Attack Scheme can be direct from malicious user’s source or it can be reflections form other victim’s systems, or it can be hidden. Attack Method: Method means that vulnerability that allows attack. Targeted attack utilizes vulnerability in protocols, software and services, while consumption method consumes all possible resources. Exploitive attacks take advantages of defects in operating system. operating system
2.3 Methods for Implementing Denial of Service Attacks A denial of service attack can be implemented in many ways; the following are the most common implantation techniques 1. Attempt to “flood” a network, thereby stopping legitimate network traffic 2. Attempt to interrupt connections between two systems, thereby preclude access to a service
Data mining in database systems refers to automatically extracting the predictive information that is not apparently visible. In large organizations voluminous amount of data is collected from the daily routine transactions and operations. The data mining process, drills through such huge volume of data, to discover the hidden key facts, to provide help in the decision making process. In other words, data mining discovers patterns of data from the database. Usually, this entails huge computations, and therefore, the process must be automated.
Fig 2: Data Mining Process[8]
2.5 Chi-Square Goodness-Of-Fit Distribution The chi- square test is used to test if a sample of data came from a population with a specific distribution. An attractive feature of the chi-square goodness-offit test is that it can be applied to any univariate distribution for which you can calculate the cumulative distribution function. The chi-square goodness-of-fit test is applied to binned data (i.e., data put into classes)[9]. This is actually not restriction since for non-binned data you can simply calculate a histogram or a frequency table before generating the chi-square test. The chi-square test is defined for the hypothesis: H0: The data follow a specified distribution. Ha: The data do not follow the specified distribution. Test Statistic: For the chi-square goodness-of-fit computation, the data are divided into k bins and the test statistic
Copyright (c) 2012 International Journal of Computer Science Issues. All Rights Reserved.
IJCSI International Journal of Computer Science Issues, Vol. 9, Issue 2, No 3, March 2012 ISSN (Online): 1694-0814 www.IJCSI.org
is defined as
where
is the observed frequency for bin i and is the expected frequency for bin i. The expected frequency is calculated by
where F is the cumulative Distribution function for the distribution being tested, Yu is the upper limit for class i, Yl is the lower limit for class i, and N is the sample size.
2.6 Related Work 2.6.1 Traditional log analyzers one of the most famous log analyzer snort[10] is a successful light-weight, open-source network intrusion detector with log analyzer. With a huge rule set maintained by diligent experts, it could detect almost all the known attacks by a large rule set that is programmed within. General and Systematic methods for intrusion detection A paper [11] was published in the Proceedings of the 7th USENIX Security Symposium San Antonio, Texas, January 26-29, 1998 regarding some general and systematic methods for intrusion detection. The Smart Sifter [12] is an outlier detection system based on unsupervised learning of the underlying mechanism for data generation. The mechanism is based on a probabilistic model which uses a finite mixture model. Denning was amongst the first persons to think in the area of application of data mining to network security. He has given a model of a real-time intrusion-detection expert system [13]. Lee and Stoflo have done a lot of work in the area of applying data mining techniques to intrusion detection. [14,15] The data mining techniques they used for their system are classification learning, association rule learning and frequent episodes learning. For classification, they have used RIPPER rule learning algorithm designed by Cohen [16].
2.6.2 Review of Existing Statistical Techniques for Anomaly Detection In the HIDES/NIDES systems [12,13,15,17], a statistical based anomaly detection technique is used to depict the expected norm behavior of a subject [18]. The statistical based anomaly detection
518
techniques solve the problem with string based, logic based, and rule based anomaly detection. However, the current statistic in HIDES/NIDES are univariate technique, means that it is applied to only one behavior measure, while many intrusions contains multiple subject and more events having effect on multiple behaviour measures. Thus, a multivariate anomaly detection technique is required for intrusion detection. So for this purpose, there are many multivariate techniques are used to examine and detect anomaly in manufacturing systems [12]. Some of them are Hotelling T², multivariate cumulative sum (MCUSUM), and multivariate exponentially weighted moving average (MEWMA) [12]. Theoretically these multivariate statistical methods can be applied to intrusion detection for examining and detecting anomaly of a subject in the wild of information science. Practically it is not possible because of the computationally intensive procedures of these statistical techniques cannot meet the requirements of intrusion detection systems for several reasons. First, intrusion detection systems deal with huge amount of high-dimensional process data because of large number of behaviors and a high frequency of subject’s events occurrence [12]. Second, intrusion detection systems demand a minimum delay of processing of each event in computer systems to make sure an early detection and signals of intrusions. Therefore, a multivariate. anomaly detection technique with low computation cost is Chi-Square statistic, which is good candidate for intrusion detection. Chi square work as multivariate but it has property of robustness, so therefore overcomes on the above problems. 3. The Proposed Model: Here we are proposing the Intrusion detection Model. First of all, for this model to work the backscatter-2008 data set is analyzed. The backscatter-2008 data set contains three hours huge PCAP file format round about 5 GB, so it is not possible for any tool to analyze the whole backscatter-2008 data set at a time. Therefore we divide it into smaller duration into three minutes of PCAP format. Then through Wire-shark utility, all worthless data is eradicated and only useful (TCP flags information) features are extracted from PCAP three minutes into CSV format. Then the CSV
Copyright (c) 2012 International Journal of Computer Science Issues. All Rights Reserved.
IJCSI International Journal of Computer Science Issues, Vol. 9, Issue 2, No 3, March 2012 ISSN (Online): 1694-0814 www.IJCSI.org
format is manipulated through Java Programming. A distribution is made for the whole data. This distribution is also called population distribution. This distribution includes two columns; the first column contains categories such as RTS, SYN-ACK, ICMP, OTHER and the second contains average number of packets per second. This distribution is stored in Data Store.The proposed model for the intrusion detection is depicted in the following flow diagram in figure 5.2. The network data i.e Backscatter 2008 dataset contains three hours continuous network traffic provided by CDIDA. This captured traffic goes as input to the system. Next phase in the model is pre-processing and distribution. Since the data is very huge so it is not possible to analyze whole data at a time so data packets are distributed into small three minutes data files by wire shark tool. These files are used as input to the next phase. In this phase TCP packets are analyzed. Only TCP flags information are processed in the packet and all other information from the packet are removed. The same procedure is followed which previously followed in the backscatter-2008 distribution. After pre-processing and feature extraction, data is passed to the next stage that is called data distribution. In this stage, first all the TCP packets are categorized in four categories (RST, SYN-ACK, ICMP, Other). Then the average packets per second are calculated for each category. A distribution is made, but this time the distribution is called sample distribution. This sample distribution is also called observed data entries in chi-square statistics.
calculation is performed on the sample distribution against the population distribution. A chi- square value is calculated. This chi-square value is passed to the decision and Conclusion phase. In decision phase the chi-square calculated value is compared with chi-square tabulated value, which is also called critical value [10]. If the chi-square calculated value is greater than critical value then it means that intrusion is occurred.
4. Chi-Square Calculation
Test
Table 1:Time Distribution of Backscatter-2008 Data Set Time Slot No
Categories and No. of Packets Average Per Seconds SYNOTHER RST ACK ICMP Packets
Total
T1
992.23334
107.68
19.68333
0.144444
1119.74
T2
913.4667
255.91
19.38333
0.022222
1188.78
T3
941.4
286.91
20.15
0.0388889
1248.5
T4
948.11664
132.67
19.85
0.0888889
1100.73
T5
923
125.33
20
0.0722222
1068.41
T6
956.6
251.92
20.1
0.0833333
1228.71
T7
1001.6334
264.47
20.28333
0.0666667
1286.46
T8
974.5833
258.78
19.83333
0.116667
1253.32
T9
930.88336
249.94
19.08333
0.044444
1199.95
T10
958.3
295.86
21.41667
0.133333
1275.71
T11
977.7
298.88
20.3
0.133333
1297.01
T12
914.8
234.38
59.55
0.127778
1208.86
T13
900.76666
243.64
70.08334
0.0611111
1214.55
:
:
:
:
:
:
:
:
:
:
:
:
T31
965.85
594.19
19.91667
0.188889
1580.15
T32
927.05
557.68
20.08333
0.0444444
1504.86
T33
941.85
542.58
20.81667
0.0166667
1505.27
T34
919.9667
616.45
21.75
0.144444
1558.31
:
Once a sample distribution is made for the captured traffic, this sample distribution has passed to chisquare statistic for testing. In this testing chi-square
Goodness-of-Fit
In this study, I have the three hour Backscatter-2008 data set, table 1 shows this data set in 60 time slots, each with 3 minute time slot. Table 1 also depicts the number of packets average per seconds, its categories based on TCP flags set and ICMP packet.
:
Fig 3: Proposed System Model
519
: :
:
:
:
:
:
T55
906.4667
1005.7
19.76667
0.194444
1932.13
T56
931.1
1322.1
19.91667
0.0333333
2273.19
T57
877.8
1406.4
19.61667
0.0722222
2303.86
T58
925.2
1398.6
20.33333
0.105556
2344.26
T59
903.3
1407.9
19.86667
0.0555556
2331.15
T60
778.644
1406.2
20.0833
0.116667
2205.08
Copyright (c) 2012 International Journal of Computer Science Issues. All Rights Reserved.
:
: :
IJCSI International Journal of Computer Science Issues, Vol. 9, Issue 2, No 3, March 2012 ISSN (Online): 1694-0814 www.IJCSI.org
For Chi-Square test calculation, first I am going to make a distribution for the whole three hours data based on the TCP flag bit set packet and the ICMP packet. After running the code in appendix A, I found out the following categories of average packets per second in table 6.2 as well as relative frequencies or ratios or of the distribution, which I need in the calculation. The relative frequencies can be easily calculated as dividing the number of category by the total numbers of categories. Table 2: Packets Wise Distribution and Relative frequencies of the Backscatter-2008 data set No. Of Average packets per second
Categories
RST
932.280179
RST
0.644528105
SYN-ACK
491.08
SYN-ACK
0.339506158
ICMP
22.99638832
ICMP
0.015898459
Other Packets
0.097314817
Other Packets
6.73E-05
Total
1446.453882
Total
1
Categories
Relative Frequencies
Now I am going to check anomaly in the three minute data for any time duration. Let I decide to check anomaly in the time slot number 13 means that T13. So we derive the following hypothesis for the this test as; H0: The T51 has the specified distribution or there is no intrusion in T51, and H1: The T51 does not have specified distribution means there is an intrusion. The observed values for T13 I have from the table 1 as: Table 3: Categories and No. of Packets Average per Seconds Time Slot No
RST
SYNACK
ICMP
T13
900.766 7
243.639
70.0833 36
OTHE R Packets 0.06111 11
Total 1214.55
The χ² test calculation for the T13 is defined in table4 :
520
Table 4: Computation of Chi-Square Test Statistic for the Test of T13 Cate gori es
RST SYN AC K ICM P OT HE R Pack ets Tota l
Rela tive Freq uenc ies (f) 0.64 4528 11 0.33 9506 16 0.01 5898 46 6.73 E-05
1
Observ ed Freque ncies (O)
Expecte d Freque ncies (E = n*f)
(O - E)
(O – E)²
(O -E)²/E
900.766 66
782.811 6789
1391 3.38
17.77359
243.639
412.347 2405
2846 2.47
69.02549
70.0833 36
19.3094 7508
2577 .985
133.5088
0.06111 11
0.08171 2745
117 .95 5 168 .70 8 50. 773 86 0.0 206
0.00 0424
0.005194
n=1214. 550107
220.3131
From table 4, I calculate the χ² goodness-of-test statistic to be χ² = Σ( O – E)²/E = 220.3131 Let the hypothesis test is performed at 5% significance level so (α=0.05). There are 4 types of categories in the test so k= 4 and the degree of freedom becomes as df= 4 -1 =3, so checking the chi square table in appendices III, with α=0.05 and df=3, I get the chi square tabulated value as: Chi-square tabulated value= χ²₀.₀₅ = 7.82 (Appendix I), while Chi-square Calculated Value= χ² =220.3131 Hence the chi-square calculated value is greater than chi-square tabulated value, so I reject the null hypothesis H₀ and accept the H₁ means that there is an intrusion or anomaly in the network traffic at time slot T13. In others words we can also say that there is denial-of-service attack. It also means this that the observed entry is different from the expected entry [12]. According to the Nong Ye and Qiang Chen “the large difference between the observed and expected frequencies is an intrusion” [12]. The difference between observed and expected frequencies for the T13 can also be seen in the bar chart.
Copyright (c) 2012 International Journal of Computer Science Issues. All Rights Reserved.
IJCSI International Journal of Computer Science Issues, Vol. 9, Issue 2, No 3, March 2012 ISSN (Online): 1694-0814 www.IJCSI.org
521
Chi-square Calculated Value= χ²= 6.826104 Hence the chi-square calculated is less than the critical value so we cannot reject the null hypothesis H₀ and therefore accept it. The acceptance of the null hypothesis means that there is no intrusive traffic in backscatter-2008 data at the time slot T32. And it also means that there is no large difference between the observed and expected values, so there is no intrusion at the T32 time slot [10]. The analysis of the T32 time slot’s expected and observed frequencies is shown in the figure 5. Table.6: Computation of Chi-Square Test Statistic For The Test of T51
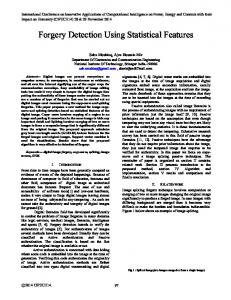
Fig 4: Pie Chart for T13
In the chart shown figure 4 X-axis is the name of categories, while on the Y-axis is the number of observed and expected frequencies. The graph clearly shows the there is large difference between observed and expected frequencies of the RST. The graph also depicts the difference in SYN-ACK observed and expected frequencies. As we can also see that there is no large difference in ICMP and Other packets. As in the graph observed frequencies bar of SYN-ACK is greater than expected frequencies bar of the SYN-ACK bar, so we conclude that there is an SYN flood attack in the time slot T13. The above T13 test was for anomaly or intrusion events in backscatter-2008 data set now I am going to check the backscatter-2008 data set for nonintrusive events. For this purpose I select another time slot T32 and I repeat the above whole calculation again. So the observed values for time slots T42, I have from table 1 as; The χ² test calculation for the T32 is defined in table5: Table 5: Categories and No. of Packets Average Per Seconds Time Slot No T32
RST
SYNACK
ICMP
OTHER Packets
Total
927.05
557.683
20.083334
0.0444444
1504.86
From table 6, I calculate the χ² goodness-of-test statistic to be χ² = Σ( O – E)²/E = 6.826104 Let again the hypothesis test is performed at 5% significance level so (α=0.05). and the number of categories are the same so k= 4, and the degree of freedom becomes the same as well df= 4 -1 =3, so checking the chi square table in appendix B, with α=0.05 and df=3, I get the chi square tabulated value as: Chi-square tabulated value= χ²₀.₀₅ = 7.82 (Appendices III) , while
Expected Frequenc ies (E = n*f)
(O E)
(O – E)²
(O – E)²/E
0.6445 2811
Obse rved Freq uenci es (O) 927.0 5
969.9250 655
1838. 271
1.89527 1
SY NAC K ICM P
0.3395 0616
557.6 83
510.9095 011
42.875 1 46.773 5
2187. 76
4.28208 9
0.0158 9846
20.08 3334
23.92496 738
14.75 815
0.61685 1
OT HE R Pac kets Tota l
6.73E05
0.044 4444
0.101277 13
3.8416 3 0.0568 3
0.003 23
0.03189 2
1
n=15 04.86 0778
Cat egor ies
Relati ve Frequ encies (f)
RST
6.82610 4
In the chart X-axis is the name of categories, while on the Y-axis is the number of observed and expected frequencies. As the graph shows that there is no large difference between the expected and observed frequencies, so there is less chi-square calculated value than tabulated value. Less chi-square value than tabulated value means no intrusion.
Figure 5: Pie Chart for T32
Copyright (c) 2012 International Journal of Computer Science Issues. All Rights Reserved.
IJCSI International Journal of Computer Science Issues, Vol. 9, Issue 2, No 3, March 2012 ISSN (Online): 1694-0814 www.IJCSI.org
Figure 6 shows the chi-square calculated values for the whole backscatter-2008 data set from time slot T1 to T60 and also draw the following bar diagram for the whole data.In the figure 6.3, on Y-axis is the number of chi square calculated values of the backscatter-2008 data set. There are some values greater than 250 but for bar simplicity purpose, I have rounded the value to 250 maximum. While on the Y-axis shows the number of time slots form T1 to T60 of the backscatter-2008 data set. There is red color red horizontal line on diagram which intersects the Y-axis on 7.82 which shows the tabulated value or critical value or threshold for the chi-square. Means that the bar of the calculated chi square values of T’s time slots greater than this red line have an anomaly.
522
[7] Floyd. S.,” Inappropriate TCP Resets Considered Harmful”, http://tools.ietf.org/pdf/rfc3360.pdf [8] Jiawei Han, Micheline Kamber,” Data Mining: Concepts and Techniques”, Multiscience Press,2006 [9]Chi-Square Goodness-of-Fit Test, http://www.itl.nist.gov/div898/handbook/eda/section3/eda3 5f.htm [10] Snort. An open source network intrusion detection system. http://www.snort.org/. [11] Wenke Lee and Salvatore Stolfo , 1998. Data mining approaches for Intrusion detection. In Proceeding of the 7th USENIX Security Symposium, San Antonio, TX. [12] Richard Jenson. A rough set aided system for sorting www bookmarks. [13] Pavel Berkhin , 2002. Survey of clustering data mining techniques.Technical report, Accrue Software, San Jose, CA,. [14] M. Markou and S. Singh. Novelty detection: A review, part i: Statistical approaches. [15] Wei Fan, Matthew Miller, Salvatore J. Stolfo, Wenke Lee, and Philip K. Chan.Using artificial anomalies to detect unknown and known network intrusions. [16] P. S. Mann, 2004. Introduction to Statistics. 5th Edition. Printed in the United States of America. Johan Wiley & Sons. Inc [17] W. R. Stevens (1993) The Protocols. Boston, MA.TCP/IP illustrated (Vol.1). Addison-Wesley Longman Publishing Co., Inc 1993. [18] CERT Coordination Center (CERT/CC). CERT/CC Statistics, 1988-2003.http://www.cert.org/stats/.
Figure 6: The Bar diagram of the Chi-square values for Backscatter-2008 Data Set
Reference [1] Ozgur Depren, Murat Topallar, Emin Anarim, M. Kemal Ciliz “An intelligent intrusion detection system (IDS) for anomaly and misuse detection in computer networks”, Elsevier, Volume 29, Issue 4, November 2005, Pages 713–722 [2] Wenke Lee; Dong Xiang; “Information-theoretic measures for anomaly detection”. [3] Manion, A. Pesnate L. Weaver G. Managing the Threat of Denial-of- Service Attacks. CERT Coordination Center. V10 , (October 2001) [4] W. Stalling, 2006. Cryptography and Network Security. Upper Saddle River, NJ 07458. Prentice Hall. [5] Eddy, W., "TCP SYN Flooding Attacks and Common Mitigations,"Internet-Draft, draft-ietf-tcpm-syn-flood-00, July 2006. [6] Ping Flood (ICMP Echo) Detection, http://daxnetworks.com/Technology/TechDost/TD101304-Ping%20Flood(ICMP%20Echo)%20Detection.pdf
Copyright (c) 2012 International Journal of Computer Science Issues. All Rights Reserved.