The Journal of Neuroscience, January 30, 2013 • 33(5):2137–2146 • 2137
Behavioral/Cognitive
Neural Correlates of Reinforcement Learning and Social Preferences in Competitive Bidding Wouter van den Bos, Arjun Talwar, and Samuel M. McClure Department of Psychology, Stanford University, Stanford, California 94305
In competitive social environments, people often deviate from what rational choice theory prescribes, resulting in losses or suboptimal monetary gains. We investigate how competition affects learning and decision-making in a common value auction task. During the experiment, groups of five human participants were simultaneously scanned using MRI while playing the auction task. We first demonstrate that bidding is well characterized by reinforcement learning with biased reward representations dependent on social preferences. Indicative of reinforcement learning, we found that estimated trial-by-trial prediction errors correlated with activity in the striatum and ventromedial prefrontal cortex. Additionally, we found that individual differences in social preferences were related to activity in the temporal-parietal junction and anterior insula. Connectivity analyses suggest that monetary and social value signals are integrated in the ventromedial prefrontal cortex and striatum. Based on these results, we argue for a novel mechanistic account for the integration of reinforcement history and social preferences in competitive decision-making.
Introduction Recent work in decision neuroscience has investigated cooperative and strategic behaviors in multiplayer economic games (for review see Rilling and Sanfey, 2011). The bulk of these paradigms have posed the dilemma to cooperate (e.g., trust, reciprocate) or compete (e.g., not trust, defect). In contrast, purely competitive behavior, defined as the pursuit of assets perceived to be scarce and contested, has received far less attention. Competitive motivations are fundamental to social interactions but can have negative consequences not only for one’s competitors, but for oneself (Malhotra, 2010). For example, the desire to beat rival bidders can lead auction participants to pay more than an item is worth, leading to monetary losses and opportunity costs (Ku et al., 2005). We hypothesize that in competitive decisions, social preferences interact with monetary outcomes to guide strategy learning. We used a five-player auction task (Fig. 1) in conjunction with fMRI. In this task, the market value of the goods is the same to everyone, but participants have only approximate estimates of this true market value. Experiments using similar tasks have shown that, although the losses of naive bidders decline over time, even very experienced and professional auction participants persist in overbidding (Dyer et al., 1989; Garvin and Kagel, 1994), even if they know the optimal bidding strategy (van den Bos et al., 2008). Inspired by learning models from psychology (Rescorla and Wagner, 1972), neuroscience (Montague et al., 1996), and economic Received June 29, 2012; revised Dec. 6, 2012; accepted Dec. 8, 2012. Author contributions: W.v.d.B. and S.M.M. designed research; S.M.M. performed research; W.v.d.B. and A.T. analyzed data; W.v.d.B. and S.M.M. wrote the paper. This work was supported by Netherlands Organization for Scientific Research (NWO) Rubicon Postdoctoral Fellowship 446-11-012 (W.v.d.B.). We thank David Effelsberg and Philipp Golka for their help with the data collection. The authors declare no competing financial interests. Correspondence should be addressed to Wouter van den Bos, Department of Psychology, Stanford University, Jordan Hall, 450 Serra Mall, Stanford, CA 94305. E-mail:
[email protected]. DOI:10.1523/JNEUROSCI.3095-12.2013 Copyright © 2013 the authors 0270-6474/13/332137-10$15.00/0
exchange games (Camerer and Ho, 1998; Zhu et al., 2012), we investigated behavior in this task using a reinforcement learning (RL) model (Sutton and Barto, 1998; McClure and van den Bos, 2011) that captures the dynamics of bidding strategies over time. The basic assumption underlying the model is that participants select bids based on the outcome expected by following a specific strategy. Recent developments in behavioral game theory (Fehr and Schmidt, 1999; Camerer, 2003) and decision neuroscience (Rilling and Sanfey, 2011) have shown that behavior and neural activity are not only driven by preferences over monetary outcomes but also by social preferences. Consistent with social preference models, we argue that people derive utility from winning and disutility from losing an auction, independent of monetary outcome. Importantly, this hypothesis is supported by recent auction experiments indicating that the joy of winning or the pain of losing increases when the social aspects of the auction environment are emphasized (Delgado et al., 2008), and that overbidding virtually disappears when participants play with computer opponents instead of people (van den Bos et al., 2008). Our RL model incorporates this thesis into an extended value function used in learning bidding strategies. First, we show that RL accounts for several aspects of behavior and that reward prediction errors estimated from our model correlate with activity in the striatum (Str) and ventromedial prefrontal cortex (VMPFC). Second, we find that behavioral biases associated with winning or losing auctions are predicted by activity in the temporoparietal junction (TPJ) and anterior insula (AI). Together, these findings support a novel brain-based account of behavioral biases in competitive environments.
Materials and Methods Participants The studies were conducted at Baylor College of Medicine in Houston, Texas, where 25 volunteers participated in the experiments. The average age of the group was 28.56 years (SD, 7.28 years), and consisted of 13
van den Bos et al. • Competition, Learning, and Social Preferences
2138 • J. Neurosci., January 30, 2013 • 33(5):2137–2146
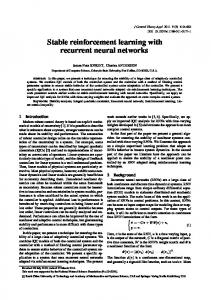
Figure 1. Common value auction experiment design. On each round, a new object (flower) was presented with a personal estimation of the value and error term indicating how much estimates may differ from the true value. Participants placed bids by adjusting digits beginning from a random initial value. After all bids were submitted, the outcome was shown at a variable delay of 4 to 12 s. Finally, a 6 s display showed either the winner of the auction or the amount of revenue gained or lost if the participant was the winner. The next round started after an intertrial interval (ITI) of 12 s. The revenue on the right side of the screen represents the total sum of money the participant had earned at that point in the task. MUs we displayed as dollar amounts.
male and 12 female participants. In accordance with the Institutional Review Boards of Baylor College of Medicine and Stanford University, written informed consent was obtained and it was emphasized that participants could withdraw from the study at any time. For three participants, the scanner failed to start in sync with the other participants in the auction; therefore, only 22 of the 25 fMRI datasets were usable for imaging analyses (11 male, 11 female). All 25 subjects were included in behavioral analyses. We tested for possible gender differences in all analyses, but none was significant for behavioral measures or brain activity. There also were no consistent general trends across gender analyses.
Experimental procedures At the start of the experiment, each group of five participants received a 15 min long instruction session on the common value sealed bid auction task procedures using a standardized PowerPoint presentation (van den Bos et al., 2008). During the introductory presentation, the following points were explained: the structure of a first price sealed bid common value auction, how to operate the computer to place bids, and the exchange rate between monetary units (MUs) in the game and pay-off in real dollars at the end of the experiment. All participants received $50 dollars for participating in the MRI experiment and received an additional 30 MU endowment to use for bidding in the task. For every 2 MUs won or lost, $1 was added or subtracted from the base pay, respectively. To ensure comprehension of the task, all participants completed the questionnaire (reproduced below in Single-player auction experiment) before continuing on to the experiment. At the beginning of the experiment, all participants were endowed with 30 MUs, with which they could bid in the auctions. In each auction round, participants were given independent estimates of the value of the item under auction (xi) and were provided with the error term () for that round. They were instructed that estimates were drawn from a uniform distribution with maximum error around the true, but unknown, common value x0. During the instructions, we carefully explained that, given the nature of the uniform distribution, value estimates were equally likely to be underestimates or overestimates of the true value. The error term was the same for all participants in each round, but changed between rounds ( ⬃{4,5,6,8}). Before the start of the experiment, participants were additionally instructed that x0 was randomly drawn from uniform distribution with lower and upper bounds of xL ⫽ 10 MUs and xU ⫽ 55 MUs. After all players submitted their bid, the largest bid was determined and the winning participant’s picture was shown to all players (for a detailed timeline and example stimuli, see Fig. 1). Only the winner gained information about the true value of the object and the revenue made in that round (revenue was determined by x0 ⫺ bi and was negative when the winning bid was larger than true value x0). The experiment consisted of 40 consecutive sealed bid auctions and took, on average, ⬃30 min to complete. In each round there was a new object for auction, represented by a novel picture of a flower, to discourage participants from using
previous trials to estimate true values x0. The number of rounds was unknown to the participants to prevent end-game effects. The participant with the highest (stochastic) estimate of value is likely to be the highest bidder in the auction. Furthermore, since estimates were uniformly distributed around the true value, this highest estimate is also likely to be an overestimate of the true market value. Therefore, if participants do not bid sufficiently less than their estimated value, they are likely to win the auction but lose money in the transaction. Such overpayments are known as the winner’s curse (Kagel et al., 1989; Thaler, 1994). The winners’ curse was first identified in auctions for oil drilling rights in the Gulf of Mexico (Capen et al., 1971), and has since been reported in baseball free agency (Blecherman and Camerer, 1998), book publishing (Dessauer, 1981), construction (Dyer and Kagel, 1996), corporate takeovers (Roll, 1986), and 3G spectrum auctions (Binmore and Klemperer, 2002). Laboratory studies have shown that, although the losses of naive bidders decline over time, the winner’s curse nonetheless persists even for very experienced or professional auction participants (Dyer et al., 1989; Garvin and Kagel, 1994). Given the persistent and stable biases evident in these experiments, common value auction tasks provide an ideal setting to study biases evident in decision-making in a competitive environment.
Behavioral analyses
We analyzed behavior in terms of “bid factor,” , given by the following:
i ⫽
bi ⫺ 共 xi ⫺ 兲 .
(1)
A bid factor of 1 implies that participants bid their signal (bi ⫽ xi; i.e., they do not shade their bid). As described above, such bids are likely to produce losses when the auction is won. A bid factor of 0 is optimal (Kagel and Levin, 2002). In particular, based on the signal (xi) and the error (), the (optimal) risk-neutral Nash equilibrium (RNNE) bidding strategy can be determined for each round and each participant. The solution is given by the following:
b i ⫽ x i ⫺ ⫹ Y i,
(2)
where
Yi ⫽
冉
冊
2 2 关x ⫺ 共 xL ⫹ 兲兴 , exp n⫹1 2 i
(3)
n is the number of bidders, and i indexes participants (Kagel and Levin, 2002). Following the methods of our previous study (van den Bos et al., 2008), the participants only received signals from a range where the term Y from Equation 2 is almost zero (Y ⬍ 0.001 MU) and can thus be ignored (Lind and Plott, 1991). As a result, the optimal bidding strategy is given by
van den Bos et al. • Competition, Learning, and Social Preferences
RNNEi ⫽ xi ⫺ .
J. Neurosci., January 30, 2013 • 33(5):2137–2146 • 2139
(4)
Thus, as indicated above, in terms of bid factor (), the optimal strategy is to bid with ⫽ 0. As has shown previously, participants learn to bid less than their value estimate (i.e., ⬍ 1) but generally overbid relative to the optimum (i.e., ⬎ 0) (van den Bos et al., 2008).
Reinforcement learning model In developing a learning algorithm, we made several adjustments specifically tailored to the auction environment (McClure and van den Bos, 2011) that are listed below. Assumption 1: intrinsic utility of winning and losing. First, we hypothesized that social factors create value for winning and losing that is independent of the monetary outcomes of the task. As a result, winning becomes more valuable by some factor, which we call win, and not winning the auction becomes aversive by some value loss:
再
x 0 ⫺ b i ⫹ win Ui ⫽ ⫺ loss
if the i-th subject is the winner otherwise, (5)
where x0 ⫺ bi is the amount won (or lost) by the winning bidder. Next, following the logic of classic reinforcement learning model, we expect that, at the end of every round, participants compute a prediction error based on the difference between the actual outcome ( U) and the expected outcome ( V) related to their bid factor:
␦共兲 ⫽ U共兲 ⫺ V共兲.
(6)
Note that, for simplicity, we have omitted the index i from Ui, Vi, i, and ␦i in Equation 6. We continue to do so for these and other subject-specific quantities in the equations below when no confusion is expected. Because is a finely discretized variable, the number of states over which it is necessary to learn state-action values is very large (for modeling purposes, we restrict predicted behavior to the approximate range of bid factors submitted by participants in the experiment: ⫺1 to 2, discretized in steps of 0.01). To converge to a stable strategy in 40 trials, as is observed behaviorally, learning must generalize across unsampled bid factors. This leads to two additional assumptions. Assumption 2: when losing an auction, participants assume that all bids less than what they submitted would have also lost. The monetary outcome when losing an auction is zero. If V() is the predicted value of bidding , then a reward prediction error signal for all states is produced according to
␦共⬘兲 ⫽
再U共⬘兲 ⫺0 V共⬘兲
for ⬘ ⱕ for ⬘ ⬎ ,
(7)
following a loss. denotes the actual bid factor submitted in a single round of the experiment, and ⬘ is used to indicate a range of bid factors. Thus, ⬘ ⱕ indicates all bid factors smaller than that submitted are assigned a nonzero prediction error. Assumption 3: when winning an auction, participants assume that larger bids would have also won the auction. Since auction winners are informed of the true value (x0) of the item, then the outcome that would have been obtained for larger bids is also known. Thus, the potential outcomes for higher bids can be known and compared with expectation, giving reward prediction errors according to:
再
0, ␦ 共 ⬘ 兲 ⫽ U共⬘兲 ⫺ V共⬘兲,
for ⬘ ⱕ for ⬘ ⬎ .
(8)
Learning based on reward prediction errors is modeled as in most RL methods, with a learning rate ␣ determining the influence of ␦ on new values of V(⬘):
V 共 ⬘ 兲 4 V 共 ⬘ 兲 ⫹ ␣ ⬘␦ 共 ⬘ 兲 .
(9)
In the current model, we scaled learning rate so that updating only occurs within a limited range of the bid factor used on any trial to account for the fact that the probability of winning with a given bid factor changes over
Table 1. Bayesian model comparisons Model
AIC
BIC
Full model No win No loss No win or loss
5181.0 5531.1 7560.9 7917.9
5185.4 5534.5 7564.1 7920.0
AIC, Akaike information criterion; BIC, Bayesian information criterion.
time. This was implemented by creating an effective learning rate that decreases inversely with distance from :
a ⬘ ⫽
␣ . 1 ⫹ ⬘ ⫺
(10)
Decisions were then generated by the model using a soft-max decision function, with a parameter m that modifies the likelihood of selecting suboptimal bids:
P共兲 ⫽
exp共mV共兲兲
冘
⬘
.
exp(mV共⬘兲)
(11)
The value function, V, was initialized to zero for all values of . The denominator sums over all possible values of (indexed by ⬘ ⑀ [⫺1,2], as discussed in Assumption 1, above). We also experimented with randomized initial values of V(), which is commonly used in RL algorithms to encourage initial exploration of strategies. Randomizing initial values did not affect the performance of the model in any notable way. All model-related results are reported for fits conducted with V initialized to zero. We estimated the parameters (win, loss, ␣, and m) of the RL model using a simplex optimization algorithm in Matlab. The model simulated the performance of five bidders with average bid factors calculated for each round of 40 consecutive auctions in 10,000 runs of the model. A similar round-by-round average bid factor was also calculated for the bids submitted by the 25 participants in the study. Best-fitting model parameters were determined at the group level so as to minimize the sum-squared error between average model performance and the average subject performance. The best fitting model parameters were win ⫽ 2.40, loss ⫽ 0.49, ␣ ⫽ 0.138, and m ⫽ 10. Group-based estimates of ␣ and m were subsequently used in a second model fitting procedure that was aimed at estimating the individual differences in win and loss for the 22 subjects that had usable data in the imaging experiment. Finally, we compared the performance of the current model with several alternative models using Bayesian model comparisons. To test the null hypothesis that there are no social preferences, we compared the full model to one in which the win and loss parameters were both removed. To further explore the role of win and loss, we also included the RL models with either win or loss removed from the model. These model comparisons indicate that the full model provides the best fit to the data (Fig. 1; Table 1).
Sequential analyses and social utility For behavioral analyses, we defined two dependent variables to investigate the relation between model parameters and choice behavior: [⌬ 兩 win] and [⌬ 兩 not win]. These two measures of sequential changes in bid factor () were computed by calculating the average change in (t⫹1 ⫺ t) following either winning or not winning a round in the auction. To test whether the individually estimated parameters for win and loss predict different aspects of participants’ behavior, both estimates were simultaneously regressed against [⌬ 兩 win] and [⌬ 兩 not win] using multiple regression.
Single-player auction experiment
We hypothesized that the win and loss parameters reflect individual social preferences. To further support this hypothesis, we performed an additional behavioral experiment on an independent subject group in which we separately measured model parameters and participants’ social and monetary motivations in the task. In this task, participants played an online five-player common value auction. Unbeknownst to participants,
2140 • J. Neurosci., January 30, 2013 • 33(5):2137–2146
the other players were simulated (van den Bos et al., 2008). In particular, competing bids were based on the bid factors, , generated by the reinforcement model detailed above, with model parameters that produced the best fit to the behavioral data in the imaging study (win ⫽ 2.40, loss ⫽ 0.49, ␣ ⫽ 0.138, and m ⫽ 10). Before participating in the study, subjects were sent an e-mail emphasizing the importance of arriving on time due to the multiplayer nature of the experiment. Upon arrival, subjects were told the other participants of the online auction were seated in different parts of the building. After obtaining written consent, participants were given the explanation of experimental procedures described above and were given a short questionnaire to ensure comprehension. All participants passed this test without error. Participants were instructed that their payoff would be generated according to their revenue. Participants were endowed with 75 MUs and $1 in payoff was added/subtracted from an endowment of $20 for every 5 MU profit/loss in game money. The experiment ended after 70 rounds of auctions and the participants were debriefed. The study was conducted at Stanford University, where 47 volunteers participated in the experiment. The average age of the group was 23.4 years (SD, 7.28 years) and consisted of only male participants. Seven participants were excluded from the data analysis because during the debriefing they indicated that they did not believe they were playing against real peoples. At the end of the auction, participants were given a 10-item questionnaire to assess feelings associated with participating in the experiment. For all items, responses were given on a 5-point Likert scale with 1 labeled “very positive” and 5 labeled “very negative.” 1. 2. 3. 4. 5. 6. 7. 8. 9. 10.
Being the winner of an auction made me feel. . . Not winning the auction made me feel. . . Losing money in the auction made me feel. . . Winning money made me feel. . . Realizing that another player wins a lot of auctions made me feel. . . Realizing that other players win more auctions than I do made me feel. . . Not winning an auction over a long period of time made me feel. . . Winning an auction without making a profit or a loss made me feel. . . The possibility that other players could make more money than I do made me feel. . . The possibility that other players could make less money than I do made me feel. . .
All significantly correlated items were combined, yielding two factors. The first factor concerned monetary outcomes and consisted of questions 3 and 4 (reversed). The second factor concerned the other players winning auctions and money and included questions 5, 6, 7, 9, and 10 (reversed). The nonweighted mean scores of the monetary and social factor were used as predictors for individual differences in win and loss. Responses related to monetary and social motivations were correlated within category across subjects (Cronbach’s ␣ ⫽ 0.66 and 0.79, respectively). Summary monetary and social motivations were uncorrelated across subjects (Spearman’s ⫽ ⫺0.08, p ⫽ 0.65).
fMRI data acquisition and analyses Imaging was performed on 3.0 tesla Siemens scanners. High-resolution T1-weighted scans were acquired using an MP-RAGE sequence. Functional run details were as follows: echo-planar imaging, gradient recalled echo; TR ⫽ 2000 ms; TE ⫽ 40 ms; flip angle ⫽ 90°; 64 ⫻ 64 matrix; 26 4 mm axial slices; yielding voxels with dimension 3.3 ⫻ 3.3 ⫻ 4.0 mm. Functional data were analyzed using SPM5 (Wellcome Department of Cognitive Neurology, London, UK). First, slice-timing correction was applied to all images. Next, motion correction to the first functional scan was performed using a six-parameter rigid-body transformation. The motion-corrected images was coregistered to each individual’s structural MRI using a 12-parameter affine transformation. Images were then resampled into 3 ⫻ 3 ⫻ 3 mm voxels and spatially normalized to the MNI template by applying a 12-parameter affine transformation. Images
van den Bos et al. • Competition, Learning, and Social Preferences
were then smoothed with an 8 mm isotropic Gaussian kernel and adjusted for global signal variation using a voxel-level linear model of the global signal. For each experiment, all five participants were scanned simultaneously and stimulus presentation and the timing of all stimuli and response events were acquired using NEMO software (http://www.hnl.bcm.tmc.edu/nemo/index.html), which is specifically designed for multisubject experiments and network-initiated scanning. Head motion was restricted with a pillow and foam inserts that surrounded the head. Statistical analyses were performed on individual participants’ data using the general linear model in SPM5. The fMRI time series data were modeled by a series of events convolved with a canonical hemodynamic response function (HRF). To investigate the neural correlates of different aspects of the outcome phase of the auction, we set up a general linear model (GLM) with regressors for the individual trail-by-trial estimated prediction errors (scaled and signed), win/non-win trials, and revenue change. As is necessarily true, prediction error and revenue change were partially correlated, with an average r 2 of 0.04 across our subjects. Similarly, the revenue change and win/non-win trial regressors were also partially correlated with an average r 2 of 0.04. However, neither correlations reached significance nor influenced the estimability of the design matrices. Additionally, we used a single regressor for the decision phase because the procedures during this phase—which involved viewing private estimates and error information and deciding on and submitting bids— occurred in rapid succession, too fast to be distinguished temporally. In contrast to the default procedure in SPM, we entered all regressors independently (without serial orthogonalization) into the design matrix. The regressors of interest were those of the outcome phase: the prediction error regressor and the regressors for winning and not winning the auction. Both the decision and the outcome phase regressors were modeled as events of 0 s duration. Additional analyses where the decision phase was modeled by reaction time did not yield qualitatively different results; the results in this paper are based on the null duration model. All regressors were convolved with the canonical HRF and regressed against the BOLD signal. Thresholds were set to p ⬍ 0.05 FWE with an extent threshold of 10 continuous voxels for the whole-group analyses. Functional connectivity analyses. To explore the interplay between the VMPFC, striatum, and other regions associated with winning and not winning auctions, we assessed functional connectivity using psychophysiological interaction (PPI) analysis (Friston, 1994). The VMPFC and striatum regions were taken from a whole-brain analysis in which BOLD activity was regressed against reward prediction errors for the whole group. Significant voxels within the VMPFC and striatum were used as volumes of interest (VOI). The method used here relies on correlations in the observed BOLD time series data and makes no assumptions about the nature of the neural events that contributed to the BOLD signal. For each participant, the entire time series over the experiment was extracted from the VOIs. Regressors were then created by multiplying the normalized (z-transformed) raw time series with two condition vectors that contained ones for the six TRs following either winning or not winning the auction, and zeros otherwise (Cohen et al., 2005; Kahnt et al., 2009). This produced the two condition vectors for winning and not winning (containing ones and zeros) that were multiplied with the time series of each VOI to produce the interaction terms used as covariates in a whole-brain regression analysis. Additional regressors for the condition (psychological) and time series (physiological) were included as additional covariates of no interest. Individual contrast images for winning and not winning were computed and entered into second-level one-sample t tests. To find related differences in functional connectivity with the VMPFC/Str and the TPJ/ AI, we performed follow-up region of interest (ROI) analyses. ROI analyses. We used the Marsbar toolbox for use with SPM5 to perform ROI analyses to further characterize patterns of activation and estimate individual differences in connectivity with the VMPFC and striatum seed regions. Individual connectivity coefficients for winning and not winning were extracted for the target regions of interest (TPJ and AI). Paired-sample, two-tailed t tests were used to test whether the psychophysiological interactions were stronger between winning and not
van den Bos et al. • Competition, Learning, and Social Preferences
J. Neurosci., January 30, 2013 • 33(5):2137–2146 • 2141
optimal Nash equilibrium ( ⬇ 0.4; at Nash equilibrium ⫽ 0; Fig. 2 B). Finally, we found that the mean bid factor increases sharply in the first several rounds of the experiment. Our learning model captured all of the observed aspects of bidding throughtime,includingtheinitialriseinmean bids as well as the gradual reduction toward Nash equilibrium (Fig. 2B). We estimated model parameters using maximum likelihood procedures. The model included two parameters to estimate the utility of winning or losing independent of monetary outcome: win and loss. Best fitting estimates of win and loss were significantly greater than zero across subjects (win: mean ⫽ 2.40, SE ⫽ 0.35, p ⬍ 0.001; loss: mean ⫽ 0.49, SE ⫽ 0.11, p ⬍ 0.01). Moreover, win and loss were positively correlated with average bid factor during the course of the experiment across subjects (r ⫽ 0.71, p ⬍ 0.001 and r ⫽ 0.53, p ⬍ 0.01, respectively). As will be relevant for interpreting fMRI results below, we found no relationship between win and loss across subjects (r ⫽ 0.07, Figure 2. Bidding behavior in common value auctions. A, Participants adjusted their bids based on the amount of money earned or lost an each round of the experiment. Changes in bidding were analyzed in terms of bid factors (, see Materials and Methods) p ⫽ 0.8), win was not correlated with the and were directly related to money won or lost. ⌬ is the change in bid factor between auction rounds. Green dots represent prediction error in win trials (r ⫽ ⫺0.11, rounds that are won and red dots the rounds that were not won (revenue change always 0). B, With repeated play, bidding p ⫽ 0.27), loss was not correlated with the approaches an asymptote above Nash equilibrium. Simulation of the reinforcement model with and without the win and loss prediction error in non-win trials (r ⫽ parameters. The results present the average data of 10,000 simulations; for demonstrative purposes, we have simulated auctions ⫺0.05, p ⫽ 0.48). Finally, a likelihood rawith a total of 50 rounds using the best fitting parameters for each model. These simulations demonstrate that the initial rise in bid tio test indicated that our reinforcement factors is governed by loss and the positive asymptote depends on both win and loss. Bayesian model comparison indicates that learning model captured behavior well the full model has the best fit to the behavioral data (Table 1). C, D, Robust regression of win with [⌬ 兩 win] (r ⫽ 0.41, p ⬍ 0.01; compared with a null hypothesis of ranC), and the robust regression of loss with[⌬ 兩 not win] (r ⫽ 0.36, p ⬍ 0.03; D). dom responses within our modeled range of bid factors (D4 ⱖ 189.4; p ⬇ 0 for all subjects). winning. Individual connectivity regression coefficients were also used for subsequent correlation analyses with the win and loss model paramAnalyses of trial-to-trial changes in behavior further validated eters. For the ROI analyses, we performed additional robust regression our estimates of win and loss. Since reward (Eq. 2) is dependent analyses with the Huber weighting function (using the robustfit algoon both win and loss, changes in bidding across rounds (sumrithm in Matlab) to account for possible effects driven by outliers. Given marized at ⌬) should depend on win and loss following wins that these analyses did not change the results (all ps ⬍ 0.01), we have and losses, respectively. To confirm this, we compared trial-todecided to report the results of our linear correlation analyses. Effects trial changes in bid factors by regressing win and loss against [⌬ were considered significant at an ␣ of 0.0125, based on Bonferroni cor兩 win] and [⌬ 兩 not win]. A robust multiple regression of both rection for multiple comparisons (i.e., p ⫽ 0.05/4 ROIs), unless reported win and loss on [⌬ 兩 win] fitted significantly (r ⫽ 0.50, F(2,18) ⫽ otherwise. 4.01, p ⬍ 0.03), but only win (b ⫽ 0.43, t(18) ⫽ 2.44, p ⬍ 0.02) and Results not loss (b ⫽ ⫺0.13, t(18) ⫽ ⫺0.52, p ⫽ 0.53) contributed signifComputational model of bidding behavior icantly to the regression. In contrast, in the regression against [⌬ 兩 not win] (r ⫽ 0.34, F(2,18) ⫽ 4.85, p ⬍ 0.02), loss contributed Participants completed 40 rounds of a multiplayer auction task significantly (b ⫽ 0.32, t(18) ⫽ 2.55, p ⬍ 0.01), but not win (b ⫽ while undergoing functional brain imaging. As expected, trial⫺0.14, t(18) ⫽ ⫺0.68, p ⫽ 0.50) (Fig. 2 B, C). These analyses conby-trial analyses revealed that monetary wins and losses were firm that win and loss capture expected, independent, dynamics correlated with increases and decreases in bid factors, indicating of participants’ behavior. In addition, we found that changes in that subjects adjusted their bids based on reinforcement (r ⫽ bidding across rounds (⌬) was correlated with the magnitude 0.46; p ⬍ 0.01; Fig. 2 A). However, these analyses also suggested of monetary gains or losses (r ⫽ 0.52, p ⬍ 0.001). Together, that there is some equilibrium point where people lose money, these results support our hypothesis that participants use both but winning the auction perfectly offsets the loss and results in no monetary and non-monetary outcomes to adjust their bidding change in bidding. In particular, Figure 2 A indicates that subjects strategy. tended to maintain their bidding strategy when incurring small Based on previous studies (Fehr and Camerer, 2007; Delgado losses (i.e., ⌬ ⫽ 0 when outcome is negative). Furthermore, consistent with numerous previous studies, we found that particet al., 2008; van den Bos et al., 2008), we hypothesized that the win and loss parameters reflect social preferences related to winipants’ bids during the task were initially much higher than optining or losing to other participants. To further support this hymal ( ⬎ 0 on first round; t(21) ⫽ 3.90, p ⬍ 0.001) but with repeated play bid factors declined to an asymptote above the pothesis, we performed an adjunct behavioral experiment on an
van den Bos et al. • Competition, Learning, and Social Preferences
2142 • J. Neurosci., January 30, 2013 • 33(5):2137–2146
independent subject group in which we separately measured model parameters and participants’ social and monetary motivations in the task. As in the main study, participants consistently bid significantly higher than optimal (i.e., above Nash equilibrium; mean ⫽ 0.49, SD ⫽ 0.22, t(39) ⫽ 14.3, p ⬍ 0.001) and overall incurred a net loss of ⫺22.70 MUs (SD ⫽ 22.30) over the course of the experiment. Additionally, the model fit of the participants’ behavior in this experiment yielded very similar estimates (win ⫽ 0.94, loss ⫽ 0.59, ␣ ⫽ 0.178, and m ⫽ 9.5) as in the imaging experiment. We measured attitudes using a novel questionnaire in which people rated from “very negative” to “very positive” assertions related to monetary motivations (e.g., “Winning money made me feel. . . ”) and social motivations (e.g., “Realizing that other players win more auctions than I do made me feel. . . ”). Next, we performed correlation analyses on the individual estimates of the win and loss parameters with the monetary and social construct of the questionnaire. Supporting our hypothesis, the results of these analyses showed that individual differences in both win and loss are correlated with self-reported feelings associated with the social impact of winning or losing an auction (Spearman’s ⫽ 0.37, p ⬍ 0.02 and Spearman’s ⫽ ⫺0.46, p ⬍ 0.003, respectively). In contrast, win and loss were not related to preferences over monetary gains and losses (Spearman’s ⫽ ⫺0.18, p ⫽ 0.26 and Spearman’s ⫽ ⫺0.26, p ⫽ 0.08, respectively). Importantly, post hoc comparison of correlation coefficients also revealed that the correlations of win and loss with the social factor was significantly larger than with the money factor, and vice versa (z ⫽ 2.88, p ⬍ 0.001 and z ⫽ 3.11, p ⬍ 0.001, respectively). Neural correlates of prediction errors To further investigate the origins of bidding behavior, we performed whole-brain analyses on fMRI data collected as participants performed in the experiment. Given the strength of our reinforcement learning model in capturing behavior, our first interest was the neural basis of this learning process. Following others (Montague et al., 1996; O’Doherty et al., 2003; Li et al., 2006), we identified brain regions related to valuation by identifying areas that correlated with the prediction errors that underlie learning (Eqs. 6 –9). We used best-fitting model parameters to generate estimated trial-wise prediction errors and correlated this signal with BOLD responses in a whole-brain analysis. We found significant correlated responses bilaterally in the Str [more specifically, caudate; Montreal Neurological Institute (MNI): ⫺6, 3, 0] as well as the VMPFC (MNI: ⫺3, 54, ⫺12) (Fig. 3, Table 2). These areas have been associated with reward prediction errors in reinforcement learning numerously (for review, see Cohen, 2008). Neural correlates of win and loss Our second major claim is that the winner’s curse persists due to biases in net reward that reflect social preferences. We captured this bias in our model parameters win and loss. Here, we demonstrate that these signals arose separately from the right TPJ and AI and affected value through (direct or indirect) connections with the VMPFC and Str. First, we identified brain regions associated with win and loss by contrasting brain activity related to winning or not winning the auction. Our regression model controlled for responses related to other aspects of reward, including monetary wins/losses and reward prediction error (for details of the GLM, see Materials and Methods). The contrast [win ⬎ not win] revealed an area in the right TPJ (Fig. 4 A, Table 1), whereas the opposite contrast
Figure 3. Neural correlates of reinforcement learning in common value auctions. Individual trial-by-trial estimates of reward prediction errors correlate with activity in the striatum and VMPFC ( p ⬍ 0.05, FWE; k ⬎ 10). Table 2. Brain regions revealed by whole brain contrasts MNI coordinates Anatomical region Prediction error VMPFC Ventral striatum (caudate head) Outcome (win ⬎ not win) Right TPJ Posterior cingulate cortex Outcome (not win ⬎ win) Anterior insula Left Right dACC Postcentral gyrus
L/R
BA
Z
x
y
z
L/R L/R
11 —
6.37 6.45
⫺3 ⫺6
54 3
⫺12 0
R L/R
40 7
5.05 5.18
54 4
⫺57 ⫺60
33 35
L R L/R R
— — 32 2
5.74 5.78 5.95 5.66
⫺30 45 3 59
27 18 18 ⫺24
0 ⫺9 48 44
MNI coordinates, peak voxels reported. L, Left; R, right.
[not win ⬎ win] was associated with activity in the dorsal anterior cingulate cortex/pre-supplementary motor area (dACC/preSMA) and the bilateral AI (Fig. 4 B, Table 1). To explore how the TPJ, dACC/pre-SMA, and AI are related to bidding behavior, we explored the relationship between brain activity, win, loss, and bidding behavior in subsequent ROI analyses. A robust multiple regression of both win and loss on parameter estimate (P.E.) [win] in the TPJ fitted significantly (r ⫽ 0.59, F(2,19) ⫽ 4.31, p ⬍ 0.03), but only win (b ⫽ 0.55, t(19) ⫽ 3.94, p ⬍ 0.002) and not loss (b ⫽ 0.13, t(19) ⫽ 0.09, p ⫽ 0.94) contributed significantly to the regression. This indicates that those participants that attributed relatively more utility to winning (regardless of monetary gain or loss) showed more activity in the right TPJ when they won the auction (Fig. 4C). In contrast, a robust multiple regression of both win and loss on P.E. [not win] in the AI fitted significantly (r ⫽ 0.56, F(2,18) ⫽ 3.92, p ⬍ 0.03), but only loss (b ⫽ 0.52, t(18) ⫽ 2.83, p ⬍ 0.01) and not win (b ⫽ 0.14, t(18) ⫽ 0.66, p ⫽ 0.52) contributed significantly to the regression. Given that the time series between the left and right hemispheres for anterior insula were highly correlated (r ⫽ 0.88), parameter estimates of left and right structures were collapsed by averaging time series in subsequent analyses. The results for each AI analyzed separately yielded qualitatively similar results. The robust multiple regression of both win and loss on [P.E. not win] in the
van den Bos et al. • Competition, Learning, and Social Preferences
J. Neurosci., January 30, 2013 • 33(5):2137–2146 • 2143
Figure 4. Neural correlates of winning and not winning the auction. A, Results of the whole-brain contrast of [win ⬎ not win] selectively identified a regions of the right TPJ ( p ⬍ 0.05; FWE, k ⬎ 10). B, In contrast, losing auctions (contrast of [not win ⬎ win]) is related to activity in the dACC and bilateral anterior insula ( p ⬍ 0.05; FWE, k ⬎ 10). These responses were related to social preferences. C, D, The value of winning (win) correlated with TPJ activity (parameter estimate of [win]; C), and the disutility of losing (loss) predicted the size of the responses in the anterior insula (parameter estimate [not win]; not significant for dACC; D).
dACC did not show significant fit (r ⫽ 0.22, F(2,18) ⫽ 0.89, p ⫽ 0.56). These analyses showed that those participants that attributed relatively more negative utility to not winning the auction also showed more activity in the AI when they did not win. In sum, these results indicate that activity in the TPJ and AI is related to how much utility participants attribute to winning or not winning the auction. Interaction between neural systems Above, we identified the striatum and VMPFC as regions associated with updating values that govern bidding behavior. Since win and loss are assumed to affect learning, we next aimed to determine whether the TPJ and AI showed functional coupling with the VMPFC and Str during the outcome phase of the experiment. We did so through a set of PPI analyses, using the ROIs from the previously reported whole-brain analyses. First, we contrasted the level of functional connectivity during the outcome phase of winning and not winning trials. The analyses showed that there was significantly increased TPJ-VMPFC functional connectivity after winning versus not winning an auction (t(21) ⫽ 3.11, p ⬍ 0.01). In contrast, there was greater AI-VMPFC connectivity after not winning versus winning (t(21) ⫽ ⫺2.94, p ⬍ 0.01; Fig. 5A). Connectivity analyses of the Str with TPJ and AI showed the same pattern of changed connectivity strength related to winning or not winning (t(21) ⫽ 2.83, p ⬍ 0.02 and t(21) ⫽ 2.744, p ⬍ 0.03, respectively; Fig. 5A). However, we found no differences in VMPFC-Str connectivity strength for winning or not winning (t(21) ⫽ 0.77, p ⫽ 0.45, Fig. 5A). This was true even though VMPFC and Str are significantly functionally
connected during the outcome phase ( p ⬍ 0.001 following both wins and losses). Second, because of our previous results showing that the level of activity in the TPJ and bilateral AI was dependent on outcome and individual differences in social values (win and loss), we hypothesized that connectivity strength between these regions and the VMPFC and Str would also be related to win and loss. We specifically hypothesized that the connectivity strength of TPJVMPFC/Str after winning, and the insula-VMPFC/Str after not winning, would be related to win and loss. As predicted, our results indicated that TPJ-VMPFC connectivity strength after winning was correlated with win across subjects (r ⫽ 0.61, p ⬍ 0.003), and that AI-VMPFC connectivity strength after not winning was correlated with loss (r ⫽ 0.45, p ⬍ 0.008; Fig. 5B). Similarly, TPJ-Str connectivity strength after winning was correlated with win (r ⫽ 0.60, p ⬍ 0.003), and AI-Str connectivity strength after not winning was correlated with loss (r ⫽ 0.44, p ⬍ 0.01; Fig. 5B). Finally, we hypothesized that connectivity strength between the TPJ/AI and VMPFC/Str would also be related to overbidding (i.e., ). We found that trial-by-trial changes in bidding behavior (⌬) are related to connectivity strength with the TPJ and AI. More importantly, we also found that connectivity strength predicted individual differences in overbidding: TPJ-VMPFC connectivity strength after winning and AI-VMPFC connectivity strength after not winning were both correlated with overbidding (mean ; r ⫽ 0.59, p ⬍ 0.005 and r ⫽ 0.51, p ⬍ 0.01, respectively; Fig. 6). Again, the Str showed the same pattern: correlated with TPJ-Str connectivity strength after winning (r ⫽ 0.55, p ⬍ 0.01)
2144 • J. Neurosci., January 30, 2013 • 33(5):2137–2146
van den Bos et al. • Competition, Learning, and Social Preferences
Figure 5. Functional connectivity of the VMPFC and striatum. A, Differences in VMPFC and Str task-related connectivity during winning or not winning the auction. Bars represent mean and SEM of the PPI coefficients. B, There is a significant relationship between individual win estimates and TPJ-VMPFC/Str connectivity strength after winning, and a significant relationship between the individual loss estimates and AI-VMPFC/Str connectivity strength after not winning the auction. For all plots, significance is indicated as *p ⬍ 0.01 and **p ⬍ 0.005.
Figure 6. Functional connectivity of striatum and VMPFC. TPJ-VMPFC/Str connectivity strength after winning and AI-VMPFC/Str connectivity strength after not winning predicted the individual differences in the size of the winner’s curse. In the plots, significance is indicated as *p ⬍ 0.01 and **p ⬍ 0.005.
and with AI-Str connectivity strength after not winning (r ⫽ 0.51, p ⬍ 0.01; Fig. 6). Together, the PPI analyses indicate a direct relationship between brain areas that represent value as people develop bidding strategies (VMPFC and Str) and regions commonly implicated in social cognition and emotion (AI and TPJ). Furthermore, the strength of connectivity between these networks predicted individual estimates of social preferences (win and loss parameters) and, crucially, overbidding. These findings suggest a mechanism for how social preferences may bias bidding behavior toward financially risky choices in competitive environments.
Discussion Auctions provide an ideal environment to study systematic biases in decision making that arise in competitive environments. We hypothesized that people develop bid strategies essentially by trial-and-error through a process of reinforcement learning. The brain areas we found to be associated with this process, the striatum and VMPFC, have been consistently implicated in this type of learning process. Moreover, reinforcement learning is gener-
ally thought to be relatively automatic in nature, underlying basic associative learning processes. Based on this, we propose that competitive strategies do not result from deliberate reasoning alone. Instead, behavior is driven by an adaptive process, which converges on what seems to produce the best results. Reinforcement learning models are designed to learn which behavior maximizes expected reward (Sutton and Barto, 1998). Relying on associative learning mechanisms to develop a bid strategy therefore does not explain why the suboptimal bidding strategies are so persistent. Recent developments in behavioral game theory (Fehr and Schmidt, 1999; Camerer, 2003) and decision neuroscience (Fehr and Camerer, 2007) have shown that behavior and neural activity are driven in part by social preferences. That is, people not only derive utility from their own monetary outcomes but also from their performance relative to others (Fehr and Schmidt, 1999), from giving to worthy causes (Andreoni, 1990), and from maintaining a positive social image (Benabou and Tirole, 2006). Consistent with social preference models, we assumed that reward is biased by events related to
van den Bos et al. • Competition, Learning, and Social Preferences
social factors. Namely, we assume that winning and losing per se have value (win and lose, respectively). We support this assumption in several ways. First, these values predict various aspects of behavior, both aspects of the evolution of bids across time, and individual differences in trial-by-trial changes in bidding. Second, we have shown that individual differences in both win and loss are correlated with self-reported measures of feelings about the social, but not monetary, impacts of winning or losing auctions. Third, we identify brain areas associated with these values in the TPJ and anterior insula. The TPJ is a structure that has often been associated with social cognitive processes such as taking the perspective of others (Saxe and Kanwisher, 2003; Hampton et al., 2008) and processing changes of your position within a social hierarchy (Zink et al., 2008; Chiao et al., 2009). Of course, TPJ activity is more generally associated with the reorientation of attention to salient stimuli (Corbetta et al., 2008). Concluding that responses in TPJ are related to some aspect of social cognition is therefore problematic (Mitchell, 2007). Nonetheless, taking all of the data together supports the hypothesis that winning and losing are socially salient events, particularly for those participants who reported being highly socially motivated. As for the neural structures associated with losing, the anterior insulae have been associated with negative outcomes in social interactions, such as unfair offers in the Ultimatum Game (Sanfey et al., 2003) and betrayal in the Trust Game (King-Casas et al., 2005). Our findings may therefore reflect the negative affect associated with seeing another person win the auction. However, a recent study aimed at understanding the more fine-grained functional parcellation of the insula suggested that there is a functional difference between dorsal and ventral regions within in the anterior insula (Chang et al., 2012). Whereas the dorso-anterior insula was found to be more consistently involved in higher cognitive processing such as task switching (Dosenbach et al., 2006), the ventro-anterior region associated more often with socioemotional processing. Our anterior insula regions overlap with both dorso-anterior and ventro-anterior regions, potentially indicating that our observed anterior insular activity reflects not only the socio-emotional processing of the outcome of the auctions but may also be involved in signaling the need for change of the current behavioral strategy. Interestingly, a recent paper has shown that the right TPJ and bilateral insula are more strongly functionally connected with the VMPFC during charitable donation decisions compared with food purchasing decisions, supporting the idea that social context may modulate the information exchange between these networks (Hare et al., 2010). This idea is further supported by a recent study with macaques that showed that single cells in the VMPFC tracked both magnitude of future rewards and the motivational value of rewards obtained in a social context. More specifically, these neurons were found to track momentary social preferences and social rank of other monkeys (Azzi et al., 2012). Our connectivity analyses suggest a mechanistic account for how such a social modulation of value may occur. First, consistent with several recent studies, our results suggest that activity in TPJ and AI are involved in processing social aspects of outcomes in multiplayer interactions (Rilling and Sanfey, 2011). Second, we show that these areas interact with the Str and VMPFC. Finally, the strength of this interaction was correlated with individual differences in overbidding. Together, these results suggest a novel mechanism for the influence of social and affective processes on competitive behavior. Our results have implications for psychological and economic models of competitive behavior. One prominent account for
J. Neurosci., January 30, 2013 • 33(5):2137–2146 • 2145
competitive behavior states that individuals are (exclusively) driven by the motivation to maximize differences in pay-offs between themselves and their competitors (Messick and McClintock, 1968; Loewenstein et al., 1989). That there are competitive environments in which individuals fail to maximize these differences is often explained in terms of bounded rationality (Eyster and Rabin, 2005). However, the results presented in this paper suggest that in competitive situations, individuals may hold preferences for winning (and avoiding losing), regardless of the (monetary) costs. Based on these results, we hypothesize that the nature and salience of the social context (e.g., the number and identity of the other bidders in the auction) may mediate the interaction between socio-emotional and reward areas to bias competitive decisions. For instance, if the other players are members of a salient outgroup, competitive motivations may increase, whereas if the other players are anonymous others, competitiveness may decrease (van den Bos et al., 2008). Another way of manipulating competitive motivations suggested by the current model would be to temporarily inhibit or excite the TPJ with techniques like transcranial magnetic stimulation. Recently, a series of neuroimaging studies of social interactions have used depth of social reasoning (theory of mind) to describe individual differences in strategic behavior (Hampton et al., 2008; Coricelli and Nagel, 2009; Yoshida et al., 2010). In contrast to our study, these experiments have revealed an important role for the dorsal medial prefrontal cortex in social reasoning. Although it is unlikely that individual differences in depth of processing underlie individual differences in bidding strategies in first price common value auctions (Gneezy, 2005), they do play a role in different types of auctions. An interesting avenue for future research would be the development of experiments and computational models that could investigate the putative roles of both social preferences and depth of processing in strategic behavior. Of course, we have only begun to understand what is bound to be a number of complex factors that determine the impact of social values on competitive economic decisions (Seo and Lee, 2012). Nonetheless, functional neuroimaging seems to be a powerful tool, enabling quantification of these factors through measures of the brain systems we have identified.
References Andreoni J (1990) Impure altruism and donations to public goods: a theory of warm glow giving. Econ J 100:464 – 477. CrossRef Azzi JoCB, Sirigu A, Duhamel JR (2012) Modulation of value representation by social context in the primate orbitofrontal cortex. Proc Natl Acad Sci U S A 109:2126 –2131. CrossRef Medline Benabou R, Tirole J (2006) Incentives and prosocial behavior. Am Econ Rev 96:1652–1678. CrossRef Binmore K, Klemperer P (2002) The biggest auction ever: the sale of the British 3g telecom licenses. Econ J 112:74 –96. CrossRef Blecherman B, Camerer CF (1998) Is there a winner’s curse in the market for baseball players? New York: Brooklyn Polytechnic University. Camerer CF (2003) Behavioral game theory. Princeton, NJ: Princeton UP. Camerer CF, Ho TH (1998) Experience-weighted attraction learning in coordination games: probability rules, heterogeneity, and time-variation. J Math Psychol 42:305–326. CrossRef Capen EC, Clapp RV, Campbell WM (1971) Competitive bidding in high risk situations. J Petr Tech 2:641– 653. Chang LJ, Yarkoni T, Khaw MW, Sanfey AG (2012) Decoding the role of the insula in human cognition: functional parcellation and large-scale reverse inference. Cereb Cortex. Advance online publication. Retrieved March 20, 2012. doi:10.1093/cercor/bhs065. CrossRef Medline Chiao JY, Harada T, Oby ER, Li Z, Parrish T, Bridge DJ (2009) Neural representations of social status hierarchy in human inferior parietal cortex. Neuropsychologia 47:354 –363. CrossRef Medline
2146 • J. Neurosci., January 30, 2013 • 33(5):2137–2146 Cohen MX (2008) Neurocomputational mechanisms of reinforcementguided learning in humans: a review. Cogn Affect Behav Neurosci 8:113– 125. Medline Cohen MX, Heller AS, Ranganath C (2005) Functional connectivity with anterior cingulate and orbitofrontal cortices during decision-making. Brain Res Cogn Brain Res 23:61–70. CrossRef Medline Corbetta M, Patel G, Shulman GL (2008) The reorienting system of the human brain: from environment to theory of mind. Neuron 58:306 –324. CrossRef Medline Coricelli G, Nagel R (2009) Neural correlates of depth of strategic reasoning in medial prefrontal cortex. Proc Natl Acad Sci U S A 106:9163–9168. CrossRef Medline Delgado MR, Schotter A, Ozbay EY, Phelps EA (2008) Understanding overbidding: using the neural circuitry of reward to design economic auctions. Science 321:1849 –1852. CrossRef Medline Dessauer JP (1981) Book publishing. New York: Bowker. Dosenbach NU, Visscher KM, Palmer ED, Miezin FM, Wenger KK, Kang HC, Burgund ED, Grimes AL, Schlaggar BL, Petersen SE (2006) A core system for the implementation of task sets. Neuron 50:799 – 812. CrossRef Medline Dyer D, Kagel JH (1996) Bidding in common value auctions: how the commercial construction industry corrects for the winner’s curse. Man Sci 42:1463–1475. CrossRef Dyer D, Kagel JH, Levin D (1989) A comparison of naive and experienced bidders in common value offer auctions: a laboratory analysis. Econ J 99:108 –115. CrossRef Eyster E, Rabin M (2005) Cursed equilibrium. Econometrica 73:1623–1672. CrossRef Fehr E, Camerer CF (2007) Social neuroeconomics, the neural circuitry of social preferences. Trends Cogn Sci 11:419 – 427. CrossRef Medline Fehr E, Schmidt KM (1999) A theory of fairness, competition, and cooperation. Quart J Econ 114:817– 868. CrossRef Friston K (1994) Functional and effective connectivity in neuroimaging: a synthesis. Hum Brain Mapp 2:56 –78. CrossRef Garvin S, Kagel JH (1994) Learning in common value auctions: some initial observations. J Econ Behav Organ 25:351–372. CrossRef Gneezy U (2005) Step-level reasoning and bidding in auctions. Management Sci 51:1633–1642. CrossRef Hampton AN, Bossaerts P, O’Doherty JP (2008) Neural correlates of mentalizing-related computations during strategic interactions in humans. Proc Natl Acad Sci U S A 105:6741– 6746. CrossRef Medline Hare TA, Camerer CF, Knoepfle DT, O’Doherty JP, Rangel A (2010) Value computations in ventral medial prefrontal cortex during charitable decision making incorporate input from regions involved in social cognition. J Neurosci 30:583–590. CrossRef Medline Kagel JH, Levin D (2002) Common value auctions and the winner’s curse. Princeton, NJ: Princeton UP. Kagel JH, Levin D, Battalio RC, Meyer DJ (1989) First-price common value auctions: bidder behavior and the “winner’s curse”. Econ Inquiry 27:241– 258. CrossRef Kahnt T, Park SQ, Cohen MX, Beck A, Heinz A, Wrase J (2009) Dorsal striatal-midbrain connectivity in humans predicts how reinforcements are used to guide decisions. J Cogn Neurosci 21:1332–1345. CrossRef Medline King-Casas B, Tomlin D, Anen C, Camerer CF, Quartz SR, Montague PR. (2005) Getting to know you: reputation and trust in a two-person economic exchange. Science 308:78 – 83. CrossRef Medline
van den Bos et al. • Competition, Learning, and Social Preferences Ku G, Malhotra D, Murnighan JK (2005) Towards a competitive arousal model of decision-making: a study of auction fever in live and internet auctions. Organ Behav Hum Decis Proc 96:89 –103. CrossRef Li J, McClure SM, King-Casas B, Montague PR (2006) Policy adjustment in a dynamic economic game. PLoS One 1:e103. CrossRef Medline Lind B, Plott CR (1991) The winner’s curse: experiments with buyers and with sellers. Am Econ Rev 81:335–346. Loewenstein GF, Thompson L, Bazerman MH (1989) Social utility and decision making in interpersonal contexts. J Pers Soc Psych 57:426 – 432. CrossRef Malhotra D (2010) The desire to win: the effects of competitive arousal on motivation and behavior. Organ Behav Hum Decis Proc 111:139 –146. CrossRef McClure SM, van den Bos W (2011) The psychology of common value auctions. In: Attention and performance XXIII: decision making (Phelps E, Robbins T, Delgado M, eds.). Oxford: Oxford UP. Messick DM, McClintock CG (1968) Motivational basis of choice in experimental games. J Exp Soc Psych 4:1–25. CrossRef Mitchell JP (2007) Activity in right temporo-parietal junction is not selective for theory-of-mind. Cereb Cortex 18:262–271. CrossRef Medline Montague PR, Dayan P, Sejnowski TJ (1996) A framework for mesencephalic dopamine systems based on predictive Hebbian learning. J Neurosci 16:1936 –1947. Medline O’Doherty JP, Dayan P, Friston K, Critchley H, Dolan RJ (2003) Temporal difference models and reward-related learning in the human brain. Neuron 38:329 –337. CrossRef Medline Rescorla RA, Wagner AR (1972) A theory of Pavlovian conditioning: variations in the effectiveness of reinforcement and nonreinforcement. In: Classical conditioning II (Black AH, Prokasy WF, eds) pp 64 –99. New York: Appleton-Century-Crofts. Rilling JK, Sanfey AG (2011) The neuroscience of social decision-making. Annu Rev Psychol 62:23– 48. CrossRef Medline Roll R (1986) The hubris hypothesis of corporate takeovers. J Busin 59:197– 216. CrossRef Sanfey AG, Rilling JK, Aronson JA, Nystrom LE, Cohen JD (2003) The neural basis of economic decision-making in the ultimatum game. Science 300:1755–1758. CrossRef Medline Saxe R, Kanwisher N (2003) People thinking about thinking people: the role of the temporo-parietal junction in “theory of mind”. Neuroimage 19: 1835–1842. CrossRef Medline Seo H, Lee D (2012) Neural basis of learning and preference during social decision-making. Curr Op Neurobio 22:1– 6. CrossRef Sutton RS, Barto AG (1998) Reinforcement learning. Cambridge, MA: MIT. Thaler RH (1994) The winner’s curse: paradoxes and anomalies of economic life. Princeton, NJ: Princeton UP. van den Bos W, Li J, Lau T, Maskin E, Cohen JD, McClure SM (2008) The value of victory, social origins of the winner’s curse in common value auctions. Judg Decis Making 3:483– 492. Yoshida W, Seymour B, Friston KJ, Dolan RJ (2010) Neural mechanisms of belief inference during cooperative games. J Neurosci 30:10744 –10751. CrossRef Medline Zhu L, Mathewson KE, Hsu M (2012) Dissociable neural representations of reinforcement and belief prediction errors underlie strategic learning. Proc Natl Acad Sci U S A 109:1419 –1424. CrossRef Medline Zink CF, Tong Y, Chen Q, Bassett DS, Stein JL, Meyer-Lindenberg A (2008) Know your place: neural processing of social hierarchy in humans. Neuron 58:273–283. CrossRef Medline