Agnes Schumann .... Walter de. Gruyter, Berlin - New York, 1984. 3. Vapnik, V. N. - âEstimation of Dependences Based On Empirical Dataâ. Springer-. Verlag ...
NEURAL NETWORKS VERSUS STATISTICS: A COMPARING STUDY OF THEIR CLASSIFICATION PERFORMANCE ON WELL LOG DATA
Agnes Schumann Free University of Berlin, Geoinformatics Germany, 12249 Berlin, Malteserstr. 74-100
ABSTRACT Recently, Neural Networks became a popular method in geosciences in the context of pattern recognition problems. They can be used for classification of well logs, for image processing, for anomaly detection and similar problems. In the past, such problems were mainly solved by statistical approaches. However parametric statistical classification methods suffer from strong assumptions and nonparametric one’s are unsuitable for small data sets. The hypothesis is, that Neural Networks can provide a useful technique, if statistic classification methods fail. Some theoretical considerations can support this suggestion. A standard layered Neural Network type with a linear accumulation and a sigmoid transfer function has been used to classify geophysical well logs into lithological sections. The selected data set consists of four geophysical logs (gamma ray, electrical resistivity, density, neutron neutron) and the known lithology of the wells. The available data has been divided into a training and a test data set. On the basis of the training data the networks have built an universal classification rule. The performance has been evaluated on the test data and compared versus a number of statistical classification methods: Linear and Quadratic Discriminant Analysis, Discriminant Analysis with nonparametric density estimators and knearest-neighbour classification algorithms. An account is given of the comparison results.
1. INTRODUCTION Geophysical measurements of boreholes provide important additional information about the drilled formation. With some experience human experts are able to interpret the curves and the amplitudes of the measured geophysical logs. Up to now the automatic interpretation of the logs has remained an investigated issue. This is caused by the complex physical and chemical processes generating the measurements. The methods, considered in the actual paper, ignore in some sense these difficulties and treat the task as a learning problem. They try to infer from a given training sample the relevant features for the actual interpretation task. This paper is dedicated to the problem of inferring the lithology from geophysical measurements in boreholes. It is intuitive plausible to take for each given geophysical measurement vector the most probable lithology at the corresponding section of the borehole. That means, we assume that there is an inherent stochastic relationship between the measurement vector x and the classification assignment k, which can be characterised by a probability measure P(x,k). A classification system, which takes for each vector x the class k
with maximal a posteriori probability P(k|x) minimises the overall probability to make an erroneous decision. This minimal probability, which we try to achieve, is called Bayes Error. Usually learning systems are determined by a class of available classification rules, a selection criterion and a selection mechanism to pick the best possible classification rule among all. The whole problem lies in the fact, that the probability measure P(x,k) is unknown and in reality their existence is merely a model assumption. We dispose of a sample of the underlying distribution; a set of measurement vectors and their corresponding lithology assignment. This causes that the Bayes Error can not serve directly as a selection criterion and must be replaced by a closely related quantity. In the following we will consider a special Neural Network type in comparison with statistical discrimination techniques. Both are learning systems working in the above described way, providing linear and non-linear classification rules and it is not evident which method is superior.
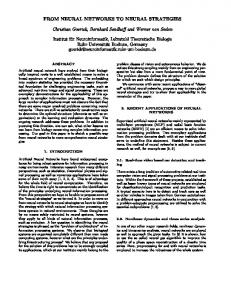
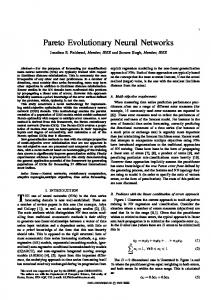
Figure 1. Various partions of the input space generated by different classification systems (LDA-Linear Discriminant Analysis, QDA-Quadratic Discriminant Analysis, NN- Neural Network ). Points of different classes are labeled by different symbols.
2. STATISTICAL CLASSIFICATION WITH DISCRIMINANT ANALYSIS Discriminant Analysis Methods solve the problem of finding an optimal classification rule by minimising an estimated error quantity E*, obtained by replacing P(x,k) with an estimated probability function P*(x,k). This is justified by the central limit theorem of statistic, which ensures the convergence of P* to P with increasing sample size and therefore the convergence
of E* to the theoretical error rate EBAYES. This property of a learning system is called consistency. But we will be dealing with a sample of fix sample size and it is well known that the estimation of a distribution function can be improved if suitable additional assumptions about the form of the unknown probability distribution were made. That means, taking into consideration the lack of information and therefore reducing the problem of estimating a whole function to the problem of estimating some parameters can effectively influence the results. In figure 1 the results of the Linear and Quadratic Discriminant Analysis are given for a simulated two-dimensional sample. The sample is drawn randomly from normal distributions with different mean vectors and different covariance matrices for the two classes. The Linear Discriminant Analysis (LDA) is designed for the case where the two classes are normally distributed with different mean vectors but equal covariance matrices. The second assumption is violated and therefore the generated discriminating hyperplane is not optimal. The Quadratic Discriminant Analysis (QDA) obviously fits better by taking into account different covariance matrices. It should be noticed that the QDA reserves only a small area for the less dispersed class. The area on the left of this class is a direct consequence of the model assumptions although there is not located any point. 3. NEURAL NETWORKS The employed Neural Network type is a standard layered Neural Network type with a linear accumulation and a sigmoid transfer function, sometimes called multi-layer perceptron. Usually the network consists of an input layer, receiving the measurement vector x, a hidden layer and an output layer of units (neurons). In this configuration each unit of the hidden layer realises a hyperplane dividing the input space into two semispaces. By combining such semispaces the units of the output layer are able to construct any polygonal partition of the input space. For that reason it is theoretically possible to design for each (consistent) fixed sample a correct Neural Network classifier by constructing a sufficiently fine partition of the input space. This may necessitate a large number of neurons in the hidden layer. The model parameter consist of the weights connecting two units of successive layers. In the training phase the sample is used to evaluate an error measure and a gradient descent algorithm can be employed to minimise this net error. The problem of getting stuck in local minima is called training problem. In figure 1 two partitions of the input space generated by two different Neural Networks are given. The networks were trained with the simulated sample. The discriminating hyperplane, generated by the linear Neural Network is better than the hyperplane generated by the Linear Discriminant Analysis. The non-linear Neural Network is able to discriminate between points of different classes still better. Since we know the probability distribution from which the simulated sample is drawn, we can decide that the generated partition of the input space is far from the optimal one. In practice the available sample must be divided into a subset used for training and a subset used to evaluate the classification performance. In a basic work Vapnik and Chervonenkis [4] found that a selection criterion on the basis of the model error can be useful if the model selection takes place in a limited model class. They established a confidence interval bounding the deviation of the mean model error to the optimal one in the model class. The deviation depends on a quantity measuring the complexity of the model class in which the optimisation takes place. For a fix sample size a smaller deviation can be guaranteed in a less complex model class. With increasing sample size this deviation decreases. That means, by adding new neurons to the Neural Network the
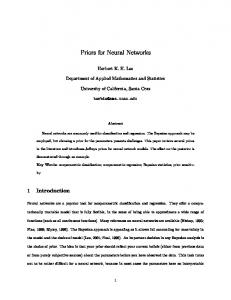
ability to adapt the form of the classes increases in principle. But taking into account the limited available information (fixed sample size) the problem of estimating a good model in a more complex model class becomes more difficult. The success of Neural Networks lies in the possibility to balance these opposite objectives. 4. A TEST EXAMPLE For evaluation of the classification performance a data set from eight wells near Berlin (Germany) with final depths between 60 and 140 metres has been used. A classification according to the grain size taking into account the rock composition is available. The employed drilling method with core extraction ensures a good recognition of the stratification. The wells were logged with some geophysical methods: gamma ray log, neutron-neutron-log, density log and resistivity log. These logs are indicators of rock properties containing discriminating information, such as shale content, porosity and density. In the following we will refer to a classification into the classes: marl or not marl. It has been found convenient to reduce a classification problem for more than one classes to several classification tasks for one class only (classification into member or not member). On one side this is due to the training problem of Neural Networks, in particular if class occurrences vary very much. To the other side this approach has some advantages, including the possibility of constructing several steps of refined classifiers and of using the appropriate classification methods for the differentiated tasks. The results of some statistical classification methods in comparison with the results of some Neural Networks are given in table 1.
class: not marl class: marl
parametric Discriminant Analysis
parametric Discriminant Analysis
nonparametric Discriminant Analysis
LDA
QDA
POT
nonparametric Discriminant Analysis kNN
linear Neural Network
non-linear Neural Network
5,2
4,9
1,5
2,9
3,9
5,4
27,6
34,5
27,6
23,0
31,0
17,7
Table 1. Classification error of different classification methods for the test sample.
We decided to accept only classifiers with less than or about 5% error for non-marl-layers. In this way we can be confident with high probability that, if the classifier recognises a marllayer then there will be in fact such a layer. The probability to overlook a marl-layer is correspondingly higher. For comparison of different classifiers we look at the error for marllayers. Approximately 70% were recognised by all classifiers. The best statistical method is the k-Nearest-Neighbour-classifier (kNN), followed by Discriminant Analysis with potentialfunction density estimation (POT). These nonparametric statistical methods exhibit an enormous adaptability but have the chief disadvantages that all training samples have to be stored and that they work very slowly. In some cases this may be acceptable. The Linear Discriminant Analysis (LDA) and the linear Neural Network give comparable worse results suggesting that a linear discrimination of the input space is not sufficient. Quadratic Discriminant Analysis (QDA) does not benefit effectively from their greater possibilities. It was possible to train a non-linear Neural Network reaching the classification performance of the nonparametric distribution-independent statistical methods but providing a much faster classification algorithm. 5. CONCLUDING REMARKS
The considered Neural Network type and Discriminant Analysis Methods can be viewed as learning systems attempting to reach the Bayes Error according to an unknown probability distribution of the data. If a reasonable assumption about the form of the probability distribution is available parametric statistical methods can effectively benefit from this gain of information. But otherwise it may be useful to employ Neural Networks which benefit from the fact, that they search directly for discriminating surfaces without estimation of an unknown probability model. In the test example a slight advantage for a non-linear Neural Network was found. But the fact, that classifiers even when giving comparable results for test points may differ strongly in the generated partition of the input space, should not be undervalued.
REFERENCES 1. Boulard, H. and Morgan, N. - „Connectionist Speech Recognition.“. Kluwer Academic Publishers, Boston, 1993. 2. Fahrmeir, L. and Hamerle A. [ed.] - „Multivariate statistische Verfahren“. Walter de Gruyter, Berlin - New York, 1984. 3. Vapnik, V. N. - „Estimation of Dependences Based On Empirical Data“. SpringerVerlag, New York, 1982. 4. Vapnik, V. N. and Chervonenkis, A. Ya. - On the uniform convergence of relative frequencies of events to their probabilities, Theor. Prob. Appl., 16, 264-280 (1971).