232
M. Šarić, J. Hivziefendić, J. Kevrić: New algorithm for distribution system…
______________________________________________________________________________________________________________________
NEW ALGORITHM FOR DISTRIBUTION SYSTEM RECONSTRUCTION PLANNING BASED ON FUZZY INFERENCE AND MULTICRITERIA DECISION MAKING Mirza Šarić1* – Jasna Hivziefendić2 – Jasmin Kevrić2 1
Public Enterprise Elektroprivreda BiH, Distribution Company Mostar, Adema Buća 34, 88000 Mostar, Bosnia and Herzegovina 2 International Burch University, Francuske revolucije bb, 71000 Sarajevo
ARTICLE INFO
Abstract:
Article history: Received: 31.01.2017. Received in revised form: 12.06.2017. Accepted: 12.06.2017. Keywords: Bellman-Zadeh method Decision making Fuzzy system Mamdani model Power distribution network
This paper presents a new algorithm for distribution system reconstruction planning based on Mamdani type fuzzy inference and BellmanZadeh multi criteria decision making method. The proposed algorithm takes system attributes as inputs (number of customers served by renewed infrastructure, energy losses, power demand and cost of investment) and returns crisp output values which are used as planning criteria. The aim of this paper is to provide a logical decision making framework which can be used to model, evaluate, and rank projects according to required criteria. The proposed model is flexible and can be extended to include additional planning criteria. The proposed method is tested on a realistic distribution system to demonstrate its relevance. It is expected that this paper will make a contribution toward more effective management of power distribution network planning process and that it will be used by planning engineers in practical problems.
1
Introduction
The power system is a fundamental, strategically important asset for every country. It is a very capital intensive system which requires substantial investments in order to maintain predetermined quality standards and meet future energy and capacity needs. The electrical power distribution system (EPDS) is important part of the power system. In Bosnia and Herzegovina, it is run as a regulated monopoly, but this trend is changing due to market liberalisation process. The cost of power distribution constitutes a significant portion of the *
overall cost [1]. Investments in EPDS can roughly be divided in two groups: investments in construction of new facilities and investments in the renewal of existing infrastructure. It is estimated that 30 - 40 % of total investments in the electricity sector is allocated to distribution systems [2]. This paper presents an algorithm for EPDS reconstruction planning, based on fuzzy inference and multi criteria decision making (MCDC). Fuzzy logic is introduced in order to account for a varying degree of uncertainty, imprecision and contradictions in a semi structured problem domain which requires a comprehensive model for
Corresponding author. Tel: +387 36 502 125 Fax: +387 36 502 103 E-mail address:
[email protected]
Engineering Review, Vol. 38, Issue 2, 232-241, 2018.
233
______________________________________________________________________________________________________________________
knowledge analysis [3]. The proposed model can be divided in two parts. The first one is based on Mamdani type fuzzy inference and is used to model planning criteria. It takes the system attributes as input variables in three separate inference systems and returns crisp output values which are used as planning criteria. The system attributes considered are the number of customers served by renewed infrastructure, energy losses, power demand and cost of investment. The second part of the model is used for MCDM in fuzzy environment, based on the Bellman-Zadeh method in which decision making is accomplished by the intersection of fuzzy goals and constraints. Elements of the decision matrix (reconstruction criteria) are the output variables of the fuzzy inference system. Bellman-Zadeh model has been proven as a suitable tool in similar applications [4]. The main objective of this work is to provide a logical and easy to follow decision making framework which can be used to model, identify and rank EPDS reconstruction projects according to their ability to deliver long term benefits to both customers and utility. The proposed algorithm is tested on a realistic medium voltage (10 kV) network in Bosnia and Herzegovina in order to prove its practical relevance. Finally, results are discusses and it was demonstrated that the proposed algorithm can be used as a powerful business intelligence tool and that it can contribute towards more efficient management of the power distribution network planning process.
2 Literature review Distribution System Operators (DSO) makes long term investment plans using traditional tools such as load flow analysis [5]. The EPDS planning processes can be defined as preference based decision making process which requires inclusion and assessment of complex planning criteria [6]. Review of research problems and models related to the planning of the EPDS is provided in [1]. More recently, comprehensive review of modern EPDS planning issues has been provided in [7]. It includes an overview of modern models, methods and future research trends. It is complicated to capture all the necessary planning criteria and expert opinions within the formulations of conventional optimizing models [8]. The inclusion of expert opinion in the planning process is not straightforward and it requires the use of techniques designed for
evaluation of qualitative aspects, vagueness or uncertainty [9] and multiple decision making criteria [5]. A probabilistic approach is difficult to apply to this problem because of the lack of significant data and because uncertainty is not random. In practice, it is not possible to model wide range of practical engineering problems using the exclusive domain of Aristotelian binary logics in which particular element x, either belongs to a set A (A=1) or it does not belong to a set A (A=0), because such a rigid approach to boundary definition between two sets reduces natural process to discrete ones [10]. Probabilistic and deterministic methods model coefficients as crisp values which is not realistic scenario [1] and might lead towards misallocation of resources. The fuzzy approach appears to be appropriate to address these issues because it provides a softer approach to membership and boundary conditions and because it provides significant information in a single fuzzy model. Deterministic models on the other hand require analysis of various numbers of scenarios in order to produce the same result. Fuzzy sets are generally regarded as an adequate tool for translation of qualitative information into quantitative [11]. Use of fuzzy logic allows operators to take advantage of system tolerance to imprecision deviations or violations which could lead to substantial savings [1], especially in capital intensive environments. Many authors highlight advantages of fuzzy models over the deterministic models for power system planning purposes [12]. Representation of uncertainty using probability and representation of its likelihood by objective or subjective probability is also questionable because this approach assumes repetition of events under unchanged conditions. Possibility and probabilistic approaches are different both from the point of view of the model and interpretation of results [9] while fuzzy approach offers different insight [13]. It is therefore justified to use new methods and tools, such as fuzzy systems, to create a logical framework, which will use realistic data to model EPDS planning criteria. Some of the examples of fuzzy approach to EPDS and Distributed Generation (DG) planning and development applications are presented in [10], [14-20].
234
M. Šarić, J. Hivziefendić, J. Kevrić: New algorithm for distribution system…
______________________________________________________________________________________________________________________
3 Fuzzy sets, control and decision making Fuzzy logic provides a softer approach to membership concept as it recognizes the values of graded membership which can assume values between 0 and 1. Fuzzy set, therefore, can be described as an extension of classical set theory with softer transition from one membership function to another. If we consider a classical set A of the universe U, a fuzzy set A is defined by a set or ordered pairs, a binary relation as [21]:
Α {(x, μA(x))|x A, μA(x)0,1}
(1)
The fuzzy logic models are particularly useful in applications which require the description of imprecise and complex processes. Such descriptions are performed with the use of fuzzy sets used in the process of fuzzy logic control, which deals with control problems in an environment of uncertainty and imprecision [21]. In the proposed fuzzy system, input and output linguistic variables are described by an expert knowledge and represented by sets A, B and O which contain single terms Ai, Bj i Ok [21]:
O O1 , O2 ,, Ok , Ok 1 ,, O f
(2)
x1n x2n xmn
xm 2
j 1,, m
(4)
In order to obtain the matrix M, a number of goals Gg can be formed from the set of criteria Cj. The remaining criteria from the set Cj can be used to form the set of constraints. For set Gg, where r is the number of goals, it can be written that [23]:
G1 Gr
G1 x11 x n x ... G1 1n ∑ G1 1i X1 Xn Xi i 1
Gr xr1 x n x ... Gr rn ∑ Gr ri X1 Xn Xi i 1
(5) (6)
g r
n Gg x gi G g ∑ i 1 X i g 1
(7)
n Cc xr c,i Cc ∑ Xi i 1 c1
c h
Ai x, Ai ( x) x Ai U 1, i 1,, n
Xn
X2
x12 x22
Similarly, for fuzzy sets of constraints Cc, where h is the number of constraints, it can be written that [23]:
Terms Ai, Bj i Ok are fuzzy sets defined as [21]:
X1
x11 x 21 M Crm xm1 Cr1 Cr2
A A1 , A2 ,, Ai , Ai 1 ,, An B B1 , B2 ,, B j , B j 1 ,, Bm
B j y, Bj ( y ) y B j U 2 ,
element of a decision making matrix M represents a ranking of an alternative Xi with respect to a criteria Cj. In the case of m criteria (Cr1, Cr2,...,Crm) and n alternatives (X1, X2,...,Xn), decision matrix M can be represented as [23, 24]:
(3)
Ok z , Ok ( z ) z Ok U 3 , k 1,, f
Decision making in a fuzzy environment is a process in which goals or constraints, defined as fuzzy sets in the space of alternatives, are fuzzy in nature [22]. If we consider G described by the membership function G(x) to be a set of goals and C described by the membership function C(x) to be set of constraints, then the optimal decision is a fuzzy set D with membership function D(x), expressed as the intersection of fuzzy sets G and C [22], [23]. In order to make a decision, it is necessary to construct a decision making matrix M. Each column of the matrix represents a particular alternative and each row corresponds to a particular criteria. Each
(8)
Decision set is given by the intersection of fuzzy goals and fuzzy constraints and can be represented as follows [23]: D Gg
∩
(9)
Cc
n Gg x gi n Cc xr c,i D ∑ ∑ (10) Xi i 1 X i g 1 i 1 c1 g r
ch
D min min Gg xij , min Cc xij c1,h g 1,r
(11)
where membership functions of D are defined as [23]:
Engineering Review, Vol. 38, Issue 2, 232-241, 2018.
235
______________________________________________________________________________________________________________________
D1 X1 min min Gg x1n , min Cc x1n (12) c1,h g 1,r Dn X n min min Gg xmn , min Cc xmn c1,h g 1,r
shapes [25].
(13) which yields a fuzzy set of decisions [23]:
D
D X n D X D1 X 1 ... n n ∑ i i X1 Xn i 1 X i
(14)
D
~ x n ~ x D1 ~ x1 ... Dn n ∑ Di i X1 Xn i1 X i
(15)
The optimal decision is an alternative X* with greatest membership function to set D [23]:
D( X *) maxD1 ( X1 ),..., Dn ( X n )
(16)
D ( x*) max D1 ( ~ x1 )..., Dn ( ~ xn )
(17)
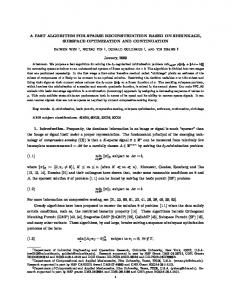
4 Algorithm development 4.1 Fuzzy inference In this paper Mamdani-type model is used in order to obtain planning criteria, which are represented by a crisp, single valued quantities using realistic system attributes. The input variables are energy loss index (ELI), maximum power demand (P), number of customers (NC) and investment cost (IC). In the first model, criteria based on the ELI are evaluated according to diagram shown in Fig. 1(a). The output value of the model gives the first criteria Cr1, which represents the estimated benefits of an investment project based on energy loss reduction. In the second model, planning criteria Cr2 is obtained based on maximum power demand and the cost of investment as shown in Fig. 1(b). Further, the third model is determines planning criteria Cr3, based on the number of customers and cost of investment as shown in Fig. 1(c). Finally, all the system reconstruction criteria are assigned the equal factor of importance (w). All membership functions of the fuzzy sets are represented using triangular shapes, which is one of the most frequently used
Figure 1. Mamdani model for assessment of criteria Cr1, Cr2 and Cr3 4.2 Fuzzification 1) Criteria based on ELI This is the first criteria which needs to be indirectly obtained from the given attribute, with the application of Mamdani type fuzzy logic based model. The final outcome is a crisp, single valued output. In this case, there are two inputs and one output variable described by fuzzy sets. The first input variable is based on the project capability to deliver energy loss reduction. Overall losses reduction is one of the most important technical, social and business objectives of the utility companies. The distribution network renewal projects are, in general, expected to reduce losses. There is a considerable difference in electrical energy losses around the world and it can be difficult to determine what a normal or acceptable rate is. The objective is not to give priority of reconstruction to the network sections with high losses, but rather to a particular project with greatest potential to reduce total energy losses. In [26], a method which can be used to compare load flow solutions for the original and reconstructed system is proposed in order to determine change of electrical energy losses for each alternative. The
236
M. Šarić, J. Hivziefendić, J. Kevrić: New algorithm for distribution system…
______________________________________________________________________________________________________________________
obtained values are linearly normalized into a 0-1 interval, where the highest loss reduction is associated with a value of 1 and the smallest associated with a value of 0. In [27], the Power Loss Index (PLI) fuzzification process is shown in which five membership functions are chosen to describe power reduction: Low (L), LowMedium (LM), Medium (M), MediumHigh (MH), and High (H). Such fuzzification method will be adopted in this paper in order to introduce ELI, which represents energy reduction measure of a project. It is calculated via sum of nominal power losses before and after reconstruction multiplied by their respective possibility of occurrence, derived from equal area criterion applied to load duration curve on a yearly level. The set of attribute values is defined as (0-amax+amin) interval. The obtained values are linearly normalized into (0-1) interval. Normalization is adopted because it ensures model flexibility. The energy loss index is represented as shown in Fig 2. by a fuzzy set ELI defined as:
ELI A1 , A2 , A3 , A4 , A5
ELI L, LM , M , MH , H
IC Low, Average, High
OUT ( ELI ) L, LM , M , MH , H
(22) (23)
Figure 2. ELI, P, NC and O fuzzy set
(18) (19)
The second input variable is the investment cost (IC). This attribute, obviously, plays a major role in any type of investment analysis. This variable is described with fuzzy set containing three membership functions: Low, Average, and High. Cost data are linearly normalized (0-1) range where the value of 1 is associated with amax+amin. All values are linearly normalized into (0-1) interval. It is used as the second input variable in all three Mamdani type models. More specifically, the cost of investment is represented by a fuzzy set IC as follows:
IC B1 , B2 , B3
OUT ( ELI ) O1 , O2 , O3 , O4 , O5
(20) (21)
ELI is represented by the fuzzy set shown in Fig. 2 while IC is represented by the fuzzy set shown in Fig.3. The output variable is represented by the specific fuzzy set which is graphically shown in Fig. 2. (just like the set ELI). The crisp value of the output function is obtained after the defuzzification process is completed and it represents the criteria in the decision making matrix. The output variable is represented by set OUT (ELI) as follows:
Figure 3. Investment cost (IC) fuzzy set 2) Criteria based on maximum power demand Maximum line loading is important in profitability and other long term benefits estimation for two reasons. The first reason is that it prevents confusion between heavily loaded lines that serve few of customers and lightly loaded lines that serve large number of customers, as evaluating only the total number of customers served by a particular power line might be misleading. Maximum or peak demand is therefore introduced in reconstruction profitability assessment in order to account for the total amount of power required, which has significant revenue implications in the long run. The second reason is the deterioration process which causes irreversible alterations of conductor mechanical and electrical properties. This process occurs faster in heavily loaded conductors. Maximum active power demand data are linearly normalized into (0-1) range where the highest line loading is associated with a value of 1 which corresponds to peak demand of 5 MW. This value is chosen based on the customized conductor type in 10 kV network whose maximum current rating is 300 A. The smallest value is associated with a value of 0 and it corresponds to peak demand of 0 MW. This variable is combined with IC to give the
Engineering Review, Vol. 38, Issue 2, 232-241, 2018.
237
______________________________________________________________________________________________________________________
second criteria (Cr2) and is represented by a set P as follows:
OUT ( P) L, LM , M , MH , H
(25) (26) (27)
IC
(28)
Low Average High
(29)
3) Criteria based on number of customers The number of customers served by power line is important planning criteria. This attribute is described by the fuzzy set shown in Fig. 2 where the number of customers value is normalized into [0,1] interval, 1 being the maximum value, corresponding to 1000 customers and 0 being the minimum [28]. This attribute is combined with IC, in order to obtain the value of the criteria based on the number of customers (Cr3). Two input variables and one output variable are represented by fuzzy sets as follows:
NC A1 , A2 , A3 , A4 , A5
NC L, LM, M, MH, H IC B1 , B 2 , B3
IC low, average, high
OUT( NC) O1 , O 2 , O 3 , O 4 , O 5 OUT( NC) L, LM, M, MH, H
Table 1. Fuzzy rules used to determine the output of the fuzzy system
(30) (31) (32)
START
Data collection and fuzzy inference stage
P L, LM , M , MH , H IC B1 , B2 , B3 IC Low, Average, High OUT ( P) O1 , O2 , O3 , O4 , O5
(24)
L LM L L
LM M LM L
ELI, P, NC M MH M M LM LM LM LM
H H MH M
INPUT data base measurement calculation (a1,a2,a3,a4 ) for an alternative An Attribute fuzzification (ELI, P, NC, IC)
Knowledge base
Fuzzy inference
Rules base
Aggregation & Defuzzification (center of gravity method)
Fuzzy System Output Cr1,Cr2,Cr3
NO
(33)
Are all attributes modeled?
YES
Assign weight factors (wi)
MCDM matrix (M)
(34) (35)
4.3 Rule base Table 1 shows n×m IF…AND…THEN rules, where n and m are the numbers of elements of the input variable set, giving a total of identical 15 rules for each model. 4.4 Defuzzification The last component of fuzzy system is defuzzification stage, sometimes also called decoding. The purpose of this stage is to produce a non-fuzzy control output which adequately represents the membership function μagg (z) [21]. There are numerous defuzzification methods and in this paper, a centre of gravity method is chosen as defuzzification method. Finally, Fig. 4 shows schematic representation of the proposed algorithm
Fuzzy multicriteria decision making stage
P A1 , A2 , A3 , A4 , A5
which is the final result of the algorithm development presented in this section.
Obtain decision set D(x)
Decision maximisation Dmax(x*)
END
Figure 4. Schematic representation of the proposed algorithm
5 Results, limitations and future work The proposed model, which is developed in previous section and graphically summarized in Fig. 4 is applied to realistic medium voltage (10 kV) distribution network of Bosnia and Herzegovina. The test system represents a typical distribution system which consist of the main 110/35/10(20) kV source substation which distributes electrical energy
238
M. Šarić, J. Hivziefendić, J. Kevrić: New algorithm for distribution system…
______________________________________________________________________________________________________________________
to the 35/10 kV zone substations via 35 kV feeders. It also delivers electrical energy to 10(20)/0,4 kV distribution transformers via the overhead and underground power distribution lines. The single line diagram (SLD), depicted in Fig. 5. which shows that the test system consists of eight 10(20) kV feeders. Let us assume that utility is required to provide a feeder reconstruction plan for this distribution area, which includes ranking and
prioritization of reconstruction project alternatives. On the test system, each 10 (20) kV feeder represent a candidate project (alternative), giving a total of eight different alternatives. The values of attributes used to form planning criteria are shown in Table 2. Table 3 shows normalized values of attributes which are used as inputs to the fuzzy inference systems.
Table 2. Planning alternatives Attribute A1 19 1,6 350 125
a1 (MWh) a2 (MW) a3 (#) a4 (000€)
A2 108 3,8 800 270
A3 37 0,44 410 110
Alternative A4 A5 68 97 2,1 2,8 200 680 87 202
A6 99 1,5 109 198
A7 90 2,2 338 59
A8 55 0,9 505 101
Table 3. Input variables of the fuzzy inference system Attribute A1 0,17 0,4 0,35 0,46
ELI P NC IC
A2 1 0,95 0,8 1
A3 0,34 0,11 0,41 0,4
Alternative A4 A5 0,62 0,9 0,52 0,7 0,2 0,68 0,32 0,75
A6 0,92 0,38 0,11 0,73
A7 0,83 0,55 0,34 0,22
A8 0,51 0,23 0,51 0,37
Fig 6. shows a surface view, which is a graphical representation of a function which maps input space to the output space of the proposed fuzzy systems and is used to determine planning criteria (output) for a given value of input variables. 110 kV Transmission network T
110/35/10(20) kV Source transformer station
35 kV Distribution network
10(20) kV power lines 10(20)/0,4 kV Transformers LV network (0,4 kV)
Feeder 1
Feeder 2
.........
Feeder 8
Figure 5. Single line diagram of the test system
Figure 6. Surface view-relationship between input and output variables of the Mamdani type inference The values shown in Table 4 are the output variables of fuzzy system for each of the eight alternatives and each pair of input variables (three planning criteria). When multiplied by relative importance factors, the output values of proposed
Engineering Review, Vol. 38, Issue 2, 232-241, 2018.
239
______________________________________________________________________________________________________________________
fuzzy system yield the elements of a decision making matrix M which is shown in Eq. 36. The computational procedure is carried out following these steps described in Fig. 4. Fig 7. shows and example of the rule view where for inputs values of 0,0982 0,1665 0,1421 0,1082 0,1535 0,0995 0,1065 0,1238 0.,1555 D1 ( A1 ) min Cw k ( x ) D1 ( ~ x1 ) 0,098 k k ,1 k 1,3
0,1245 0,1748 0,1788 0,1764 0,1178 0,1242 0,1015 0,0919 0,1368 0,1152 0,1192 0,0999 0,0815 0,1365 0,1178
Cr1 M Cr2 Cr3
(37)
D2 ( A2 ) min Cwk ( x ) D2 ( ~ x 2 ) 0,123 (38) k k ,2 k 1,3
D
D1 ( ~ x1 ) A1
D5 (~ x5 ) A5
D 2 (~ x2) A2
D 6 (~ x6 ) A6
D 3 (~ x3) A3
(36)
D 4 (~ x4) A4
~ D 7 (~ x 7 ) D8 ( x 8 ) A7 A8
( x ) D3 ( ~ x3 ) 0,099 k ,3
(39)
D4 ( A4 ) min Cwk ( x ) D 4 ( ~ x4 ) 0,119 k k ,4 k 1,3
0,098 0,123 0,099 0,119 0,099 A1 A2 A3 A4 A5
(40)
D5 ( A5 ) min Cwk ( x ) D5 ( ~ x5 ) 0,099 k k ,5 k 1,3
0,081 0,136 0,115 A6 A7 A8
(41)
D6 ( A6 ) min Cwk ( x ) D6 ( ~ x6 ) 0,081 k k ,6 k 1,3
(42)
D7 ( A7 ) min Cwk ( x ) D 7 ( ~ x 7 ) 0,136 k k ,7 k 1,3
(43)
D3 ( A3 )
min Cwk k k 1,3
0,344 and 0,459 the output value of 0,32 is obtained. The maximum value of the membership function of the fuzzy decision set D can be found as follows:
D(X*) max(D1(A1).....D8(A8)) D (x*) ( D1 (~ x1 ).,......, D8 (~ x8 )) ( x*) (~ x ) 0,136 D
D7
7
(45)
(46) (47) (48)
D 8 ( A 8 ) min Cw k ( x ) D8 ( ~ x 8 ) 0.115 (44) k k ,8 k 1,3
Table 4. Output variables of the fuzzy inference system and their weight factors Criteria Cr1 Cr2 Cr3
weight W 0,333 0,333 0,333
µ1(x) 0,295 0,325 0,320
µ2(x) 0,5 0,461 0,372
µ3(x) 0,343 0,299 0,347
Figure 7. Rule view used to obtain crisp output value
Alternative µ4(x) µ5(x) 0,374 0,525 0,373 0,305 0,358 0,300
µ6(x) 0,537 0,276 0,245
µ7(x) 0,530 0,411 0,410
µ8(x) 0,354 0,346 0,354
According to the obtained results, it can be concluded that A7 is the first alternative of choice, and it should be given the highest priority, based on the three criteria evaluated in the proposed model. Further analysis shows that it is now very simple to make project ranking based on the proposed methodology. In this example, projects are ranked according to their priority as follows: A7, A2, A4, A8, A5, A3, A1 and finally A6. One of the major advantages of the proposed system is that it enables the use of available data in order to design reconstruction criteria. Input variables (attributes) can be taken straight from the utility’s data base which enables fast processing and efficient use of
240
M. Šarić, J. Hivziefendić, J. Kevrić: New algorithm for distribution system…
______________________________________________________________________________________________________________________
available data, which would otherwise not be used. Fuzzy inference based on expert opinion, enables a planning engineer to obtain some important insights into various system characteristics. This is important for practical planning purposes because it allows planner to make an informed decision regarding an investment plan and offer the decision makers the most efficient long term project execution schedules. The planning criteria included in this paper do not exhaust the list of all criteria required to perform planning tasks of the modern power distribution system. Modern planning framework needs to include a number of other factors such as environmental issues, distributed generation, asset management, reliability and quality of supply [5]. Such a holistic approach should result in design of a flexible, robust and relevant model which can include any planning criteria required by utility executives and it represents an important future research direction. One of the most important advantages of the models based on fuzzy inference and MCDM, compared to traditional optimization tools, is that the number of goals and constraints can be extended without the increase in computational cost and reduction of precision. Further, the obtained results indicate that fuzzy approach is capable to overcome weaknesses of the traditional planning tools such as intolerance to the imprecision and inclusion of qualitative criteria. Finally, this paper demonstrated that qualitative criteria, based on expert opinion, is an important part of the planning process and that it can be modelled and used as an important decision making criteria.
6 Conclusion This paper presented an algorithm for the EPDS reconstruction planning based on fuzzy inference and MCDM. Fuzzy inference is based on Mamdani type model, while the decision making process is based on the Bellman-Zadeh method in which decision making is accomplished by the intersection of fuzzy sets of goals and constraints. It was shown that a fuzzy approach is capable to account for weaknesses and imprecisions of the traditional planning tools. The proposed model considered a set of system attributes as input variables in three separate inference models and returns crisp output values which are used as planning criteria. It was demonstrated that the proposed model provides a
logical framework which can be used to evaluate and rank the EPDS reconstruction projects based on their ability to deliver long term benefits, both to utilities and customers. The list of criteria modelled in this paper is by no means exhausted. This system can be extended to include additional planning criteria specified by the decision makers, without significant increase in computational complexity. It expected that this paper will make a contribution toward more efficient reconstruction planning process and that it will be used by planning engineers in practical problems.
References [1] Khator S.K., Leung, L.C.: Power distribution planning: a review of models and issues, IEEE Transactions on Power Systems, 12 (1997), 3, 1151-1159. [2] Rudnick H., Harnisch I., Sanhueza R.: Reconfiguration of electric distribution system, Revista facultad de ingenieria, U.T.A., 4 (1997), 41-48. [3] Egwaikhide O.I.: Fuzzy Modeling of Uncertainty in a Decision Support System for Electric Power System Planning, Advances in Soft Computing, 6 (2000), 387-396. [4] Ekel P.Y., Terra L.D.B., Junges, M.F.D.: Methods of multi-criteria decision making in fuzzy environment and their applications to transmission and distribution problems, Transmission and Distribution Conference, 1999 IEEE, 2, 765 - 770 [5] Espie P., Ault G.W., Burt G. M., McDonald J.R.: Multiple criteria decision making techniques applied to electricity distribution system planning, Generation, Transmission and Distribution, IEE Proceedings, 150 (2003), 5, 527 – 535. [6] Zhang T., Zhang G., Ma J., Lu J.: Power Distribution System Planning Evaluation by a Fuzzy Multi-Criteria Group Decision Support System, International Journal of Computational Intelligence Systems, 3 (2010), 4, 474-485. [7] Georgilakis P.S., Hatziargryriou N.D.: A review of power distribution planning in the modern power systems era: Models, methods and future research, Electric Power Systems Research, 121 (2015), 89–100. [8] David A.K., Zhao R.: An expert system with fuzzy sets for optimal planning [of power
Engineering Review, Vol. 38, Issue 2, 232-241, 2018.
241
______________________________________________________________________________________________________________________
[9] [10]
[11]
[12]
[13]
[14]
[15]
[16]
[17]
[18]
system expansion, IEEE Transactions on Power Systems, 6 (1991), 1, 59-65. Miranda V., Matos M.A.C.C.: Distribution system planning with fuzzy models and techniques, CIRED, 6 (1989), 472 - 476 Saric, M., Hivziefendic, J.: Management of the Power Distribution Network Reconstruction Process Using Fuzzy Logic, Advanced Technologies, Systems, and Applications, Springer Int. Publ., 155-172. El-Sayed M.A.H., Seitz Th., Montebaur A.: Fuzzy sets for reliability assessment of electric power distribution systems," Circuits and Systems, Proceedings of the 37th Midwest Symposium, 2 (1994), 1491-1494. Slowinski R., Teghem J.,: Stochastic Versus Fuzzy Approaches to Multiobjective Programming Under Uncertainty, Dordrecht, The Nederlands: Kluwe, 1990. Dimitrovski A.D., Matos, M.A.: Fuzzy engineering economic analysis [of electric utilities], Power Systems, IEEE Transactions on, 15 (2000), 1, 283-289. Mussoi F.L.R., Teive C. G. R.: Distribution system project selection based on the power quality value, Transmission and Distribution, Latin America Conference and Exposition (T&D-LA) Sixth IEEE/PES, 2012, 1-8. Canha L., Abaide A., Farret F., Daza E., Cassel G.: Automatic priority of the maintenance activities in distribution systems using multicriterial analysis and fuzzy techniques, International Conference on Power Engineering, Energy and Electrical Drives, Setubal, Portugal, 2007, 237-242. Malekpour A. R., Niknam T., Pahwa A. Kavousi F. A.: Multi-Objective Stochastic Distribution Feeder Reconfiguration in Systems With Wind Power Generators and Fuel Cells Using the Point Estimate Method, in IEEE Transactions on Power Systems, 28 (2013), 2, 1483-1492. Nayanatara A.C., Baskaran J., Kamalsakthi S.: Fuzzy-sa approach for optimization of Distributed Generation parameters in a power system network, International Conference on Computation of Power, Energy Information &Commuincation Chennai, 2016, 804-809. Aboli R., Ramezani M., Falaghi H.: Voltage control of distribution networks using fuzzy approach and capacitors offline planning,
[19]
[20]
[21]
[22] [23]
[24]
[25]
[26]
[27]
[28]
Electrical Power Distribution Networks Conference (EPDC), 2015 20th Conference on, Zahedan, 2015, 150-155. Mazhari S. M., Monsef H., Romero R.: A Multi-Objective Distribution System Expansion Planning Incorporating Customer Choices on Reliability, in IEEE Transactions on Power Systems, 31 (2016), 2, 1330-1340. Ganguly S., Samajpati D.: Distributed Generation Allocation on Radial Distribution Networks Under Uncertainties of Load and Generation Using Genetic Algorithm, in IEEE Transactions on Sustainable Energy, 6 (2015), 3, 688-697. Bojadziev G., Bojadziev M.: “Fuzzy logic for business, finance and management” Advances in Fuzzy Systems: Applications and Theory 23, 2007 Bellman R.E. and Zadeh L.A.: Decisionmaking in a fuzzy environment, Management Science, 17 (1970), 4. Spago S., Kurtagić S. M., Koldžo Đ., Vučijak B.: Fundamentals of water supply system management in utility companies, University Dzemal Bijedic Press, Mostar, 2014. Spago S., Catovic F.: Management of rehabilitation of a pipe water supply network through application of fuzzy sets, 7th International Scientific Conference on Production Engineering Development and nmodernisation of production, Cairo, 2009. Li. J, Wang G.,Li X.,: Failure prediction of ultracapacitor stack using fuzzy inference system, Engineering Review, 35 (2015), 2, 103111. Reddy M. D., Kumar N. V.: Optimal capacitor placement for loss reduction in distribution system using fuzzy and harmony search algorithm, Journal of Engineering and Applied Sciences, 7 (2012), 1. Injeti S.K. and Kumar N.P.: Optimal Planning of Distributed Generation for Improved Voltage Stability and Loss Reduction, International Journal of Computer Applications (0975 – 8887), 15 (2011), 1. Saric M.: Fuzzy approach for evaluating risk of service interruption used as criteria in electricity distribution network planning, 12th Symposium on Neural Network Applications in Electrical Engineering, Belgrade, 2014.