tic classification of very high resolution remote sensing images is the design and selection ... calls for constant monitoring and map updating. The high amount of ...
1
Features, Color Spaces, and Boosting: New Insights on Semantic Classification of Remote Sensing Images Piotr Tokarczyk, Jan Dirk Wegner, Stefan Walk, and Konrad Schindler
Abstract—A major yet largely unsolved problem in the semantic classification of very high resolution remote sensing images is the design and selection of appropriate features. At a ground sampling distance below half a meter, fine-grained texture details of objects emerge and lead to a large intraclass variability while generally keeping the between-class variability at a low level. Usually, the user makes an educated guess on what features seem to appropriately capture characteristic object class patterns. Here, we propose to avoid manual feature selection and let a boosting classifier choose optimal features from a vast Randomized Quasi-Exhaustive (RQE) set of feature candidates directly during training. This RQE feature set consists of a multitude of very simple features that are computed efficiently via integral images inside a sliding window. This simple but comprehensive feature candidate set enables the boosting classifier to assemble the most discriminative textures at different scale levels to classify a small number of broad urban land-cover classes. We do an extensive evaluation on several data sets and compare performance against multiple feature extraction baselines in different color spaces. In addition, we verify experimentally if we gain any classification accuracy if moving from boosting stumps to trees. Cross-validation minimizes the possible bias caused by specific training/testing setups. It turns out that boosting in combination with the proposed RQE feature set outperforms all baseline features while still remaining computationally efficient. Particularly boosting trees (instead of stumps) captures class patterns so well that results suggest to completely leave feature selection to the classifier. Index Terms—Classification, land cover, feature extraction, pattern recognition
I. INTRODUCTION
T
ODAY, the majority of humans live in cities, and it is anticipated that, by the year 2030, this will further increase to a level of 60% [1]. Developing appropriate infrastructure capable of meeting the needs of a growing population calls for constant monitoring and map updating. The high amount of small (e.g., trees) or narrow objects (e.g., footpaths) can only be captured with very high resolution (VHR) remote sensing images. Huge amounts of data are acquired with either spaceborne or airborne sensors to serve as basis for cartographic data usually being drawn manually. Manual semantic annotation is extremely time-consuming and costly, particularly if dealing with VHR images that have a high level of detail. Thus, map databases are often outdated. Moreover, in case of crisis situations evoked by, for example, earthquakes The authors are with the Photogrammetry and Remote Sensing group, Institute of Geodesy and Photogrammetry, Swiss Federal Institute of Technology, 8093 Zurich, Switzerland, e-mail: (piotr.tokarczyk, jan.wegner, stefan.walk, schindler)@geod.baug.ethz.ch
or inundations, rapid mapping is essential to organize instant response actions. In order to reduce the time and cost of mapping, automation is required - which is why one of the main goals of remote sensing research in the past decades has been semantic classification. Despite large efforts over the last 30 years, this task remains largely unsolved. What makes semantic classification challenging particularly in urban areas is the presence of many object classes within a single VHR image, the often small extent and heterogeneous structure due to fine-grained texture details, and the strongly varying between-class dependences. This leads to a large within-class variability while keeping the between-class variability at a low level at the same time. Here, we view semantic classification in a supervised setting that assigns one class label to each pixel in the image. The different class labels correspond to the specific object categories needed for mapping which depend on the application at hand. In this paper we group urban objects into four categories: buildings (of arbitrary size), streets (including bare ground), high vegetation, and low vegetation. In general, a supervised classification consists of four main steps: 1) feature extraction from the raw input data; 2) classifier training on a subset of the input data with labeled ground truth; 3) validation on another subset with ground truth; and 4) classification of the data using the previously trained and validated classifier. Although a vast body of literature deals with the last two steps considering mostly machine learning methods like support vector machines (SVMs) [2], fuzzy approaches [3], random forests [4], [5] or boosting [6], less systematic attention has been paid to the design and selection strategies of features. Usually, raw pixel intensities of all spectral bands are used, often enriched with features returned by the Normalized Differential Vegetation Index (NDVI) or some texture filter bank. Because it is, in general, not known in advance which combinations or mapping functions of features would help separating object classes optimally, manual feature selection can be viewed as ”educated guessing,” although certain features are, of course, physically motivated (e.g., NDVI). We propose to couple feature selection and training in such a way that we allow a boosting classifier to directly choose those features, that best discriminate the target classes, from an extensive set of feature candidates. Instead of learning a highly complex feature set like done in deep learning [7], [8] or with texture priors in the framework of Markov random fields [9], [10], we aim at providing a quasi-exhaustive feature
2
bank that is capable of adapting to scene specific properties in terms of radiometry, object classes etc. Since the seminal work of Viola and Jones [11] (and similarly that of Simard et al. [12]), integral images have become very popular to compute box filters to approximate smooth filters. For example, Bay et al. [13] make use of this concept to approximate Hessians in order to speed up computation of Speeded Up Robust Features (SURF) descriptors. We make use of integral images for averaging and approximating derivatives in order to efficiently extract this feature set despite its high dimensionality. Boosting has the advantage that the extraction of the whole feature set is only done once for a rather small training area whereas for testing, only the most discriminative subset of features explicitly selected during training has to be extracted. More precisely, features that do contribute only very little are completely discarded as opposed to down-weighting like in case of SVMs for example. Computational speed, memory requirements, and classification accuracy further benefit from computing the majority of features randomly regarding patch sizes and location. These socalled randomized quasi-exhaustive (RQE) features serve as input to boosting. In order to evaluate the proposed feature/classifier setup we perform an extensive set of experiments on five VHR urban scene images with three spectral bands. Cross-validation ensures that any bias caused by a specific training/testing setup is minimized. The goal of this study is threefold: 1) to compare the proposed RQE feature bank to various baseline features; 2) to evaluate the influence of three different color spaces; and 3) to test boosting decision stumps (linear) versus boosting decision trees, which, on the contrary to stumps, can represent nonlinear decision boundaries. II. R ELATED WORK Although feature design and selection has recently led to significant progress in computer vision and machine learning (e.g., [13–17]), the classification of VHR remote sensing data is usually still done based on standard features like raw pixel intensities. In [18], it is advocated to include intensities within a certain neighborhood around the pixel of interest for larger support. Other studies that use VHR aerial imagery to classify multiple object classes in urban scenes (e.g., [19–22]), additionally exploit height information obtained either from airborne-laser-scanning platforms or dense image matching. One strategy for discriminating different object classes is to model texture via prior distributions of graphical models [9], [10]. Helmholz et al. [23] apply the Markov random field of [9] to characterize texture for the classification of aerial and satellite images. A more common approach to texture description is the banks of texture filters (e.g., [24] and [25]). The image channels are convolved with filters (e.g., approximations of Gaussians, Laplacians, etc.) and their responses act as features during classification. A large variety of texture filter banks exists and has been applied to various tasks, for example, image segmentation [26], [27] and image registration [28]. Although being commonly used for pattern recognition problems in computer vision, filter banks have been less frequently
adapted to remote sensing data. One of the few examples is the work in [29] where the performance of Gabor filters on aerial images was evaluated. Generally, banks of filters are rather straightforward, and they quickly lead to relatively promising results. However, performance varies depending on the type of texture [30] because each filter bank is tuned for a specific application (i.e., a certain kind of texture). Thus, there is a need for a different approach that is capable of automatically adapting to various kinds of texture. One concept that aims to resolve this problem is deep learning where (nonlinear) feature extractors are learned directly (e.g., [7], [8], and [31]). This has been applied in [32] and [33] to patch-based road classification in aerial images. However, in a recent evaluation [34] exploiting deep learning for feature extraction to classify VHR remote sensing data (with random forests), we found that deep learning is brittle to set up, and often, results are not improved compared to simple linear filter banks. In this paper, we thus resort to an alternative (linear) and somewhat more intuitive strategy by providing a quasiexhaustive set of candidate features to the classifier instead of learning these directly from raw pixels. Alternatively, approaches exist that first compute a very large comprehensive set of features and, second, reduce the feature space dimensionality before training by partial least squares [35], [36] or genetic algorithms [37], [38] for example. In [39] Doll´ar et al. propose to meaningfully organize the potentially huge comprehensive space of features in such a way that the most informative features can be picked by a boosting classifier without having to search the entire feature space brute force. Experiments on human face and pedestrian benchmark data indicate superior performance compared to manually chosen feature sets. As opposed to selecting a discriminative subset of features prior to training, Doll´ar et al. [40] propose to let the classifier select discriminative features directly during training. Using integral images, they randomly generate a vast number of box filters and record their responses within a detection window. AdaBoost then selects the most discriminative features, thus largely improving performance over standard baseline features. Note that the authors also report better performance compared to separate feature mining and learning as proposed earlier in [39]. A similar approach, but using random forests instead of boosting, was proposed by Fr¨ohlich et al. [41] and applied to satellite images in [42]. The authors randomly sample Haar-like features inside a window, which serve as input to an augmented random forest classifier. Contextual class-specific cues are learned iteratively based on previous classifier outputs. Another good example of joint optimization of classification and feature selection in the spectral dimension is shown in [43]. The authors employ the generalized relevance learning vector quantization in order to distinguish between classes in the hyperspectral remotely sensed imagery. A major advantage of doing feature selection and training jointly is that the classifier directly selects those features that it finds to be most discriminative, i.e. those that work best in combination with this particular classifier, data set, and object classes. Our approach is inspired by [40] and follows
3
similar lines of thought (in terms of the comprehensive feature candidates set) as [41] and [42]. III. METHODS It is common practice in remote sensing to treat feature selection and classification as separate subsequent problems. In this paper, conforming to recent achievements in the field of machine learning, we pose these problems jointly. In contrast to the standard stepwise procedure, appropriate features for characterizing a particular scene are not being selected manually. This step is entirely left to the classifier that selects only those features from a large candidate set of RQE features, which minimize the misclassification error for a specific dataset. In the following subsections, we describe the features which serve as baselines for our experiments. Thereafter, we turn to a detailed description of the proposed RQE features that serve as candidate set for the boosting classifier, which is explained in the last part of this section. Emphasis is put on the differences between boosting stumps and boosting trees. A. Baseline features Here, we describe the standard features used in remote sensing for aerial- and satellite-image classification. Usually, the user makes an ”educated guess” about which specific features might be the best to classify a particular scene. While this procedure is straightforward, discriminative features not anticipated by the expert will not be computed, and classspecific patterns will possibly remain hidden. We propose to avoid ad hoc manual feature selection by letting the classifier choose features directly during training. In the following we describe standard features that will act as baselines for experiments. 1) Raw Pixel Intensities: The most basic feature of a digital image is the intensity of a single pixel. Today’s digital airborne and spaceborne optical sensors capture sun radiation in multiple spectral bands. Each band is recorded in a single channel, leading to several intensities per pixel, one for each channel. Standard VHR multispectral aerial sensors have four spectral channels (VHR multispectral satellite sensors usually have more): red, green, blue and infrared. If we directly take the intensities of all available channels per pixel, the feature space dimension is equivalent to the number of channels (e.g., four in case of standard sensors). The advantage of these features is that they are intuitive and very fast to compute. 2) Raw Pixel Intensities Within 15×15 Neighborhood: The natural extension of taking single intensities over all channels per pixel is to include a certain neighborhood. State-of-theart VHR data has a ground sampling distance (GSD) between 0.05 and 0.5 m. Although such high spatial resolution is of greatest value for urban remote sensing applications, it creates new challenges because a lot of small objects emerge that remain hidden in images of lower resolution. Single trees are composed of tens of pixels, and small superstructures on roofs (chimneys, dormers, etc.) become visible. Cars on the streets no longer consist of one or very few pixels but are clearly recognizable. As a consequence, the spectral variability
within object classes considerably increases, whereas the interclass variability remains low. A common strategy to resolve potential ambiguities is discriminating classes based on their specific textural patterns. The most natural and straightforward approach for texture learning is to add intensities of neighboring pixels to such of the pixel of interest. More precisely, intensities of adjacent pixels within a square window are simply added to the feature vector. Usually, the window size varies between 3 × 3 to 21 × 21 pixels and is closely linked to image resolution and object size. We have tested a wide range of window sizes and found 15 × 15 to be sufficient for our data GSD, creating a 225-dimensional feature vector per channel. For input images with three channels, we thus obtain a 675-dimensional feature space. Note that, due to the strong overlap of neighboring windows, feature vectors of adjacent pixels are highly correlated. In turn, classification results can be expected to be a lot smoother than such based merely on single pixels. 3) 15×15 Pixel Neighborhood + NDVI: Along with the neighborhood of each single pixel, as described in the previous subsection, we add an NDVI channel. The NDVI is a standard feature created by nonlinear combination of the red and near infrared channels and is widely used in optical remote sensing. It captures differences between vegetated and nonvegetated areas. In our experiments, we consider the NDVI as independent channel, i.e. all NDVI values in a 15 × 15 neighborhood of the pixel of interest are recorded. Adding the 225-dimensional NDVI feature vector to the already existing one of the three spectral bands thus results in a 900-dimensional feature space. 4) Texture Filters: Texture filter banks are another standard approach to capture object class patterns. They are a good example for ”hand-crafted” features where an expert designs a relatively small bank of specifically engineered features to capture expected object class patterns. Images are convolved with a series of filters and their responses are stored in a feature vector. A good representative for this kind of technique is the subset of the root filter set (RFS) used in [44], and we take it as baseline for our experiments. All channels are convolved with the filters adopted from [44]: four Laplacian-of-Gaussians (LoG), three Gaussians and four first-order Gaussian derivatives. Four LoG and three Gaussian kernels are computed in different scales ({σ, 2σ, 4σ, 8σ} and {σ, 2σ, 4σ}). As the first-order Gaussian derivatives are computed independently in two different scales {2σ, 4σ} and two directions (x and y), they produce four responses. In total, 11 features per channel are computed, generating a 33-dimensional feature space when using input images with three spectral bands. The σ value has been empirically tested, and we found σ = 0.7 to yield best results. Note that, by convolving all channels with the described filters, a neighborhood of each pixel is implicitly considered. B. RQE Features Our aim is to avoid data-specific design of features completely. Therefore, we generate a vast and redundant set of simple features, that can be computed efficiently via integral images [11], to allow the classifier to choose the most discriminative ones directly. This comprehensive RQE feature
4
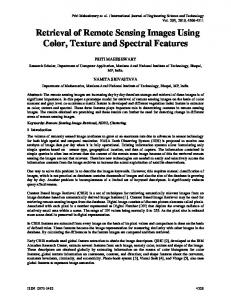
bank enables one to handle different lighting conditions, object class properties, different scene structures, etc., thus mitigating scene-specific performance variations of standard filter banks [30]. This approach can be viewed as an intuitive intermediate step between deep learning methods [7], [8], and [31–33]) and standard feature banks (e.g., [24], [25], and [44]). A sliding window that is shifted pixel-wise across the image acts as basic unit. All following operations take place inside this window and are exactly the same at each of its positions. Various window sizes were tested, and 15 × 15 performed best across all data sets. The first subgroup of the RQE feature set consists of differences between pairs of patches. Instead of allowing only predefined regular patterns and patch shapes (as in [45]), we generate a large pool of features by randomly choosing patch size and position (inspired by [40]) within the 15 × 15 window. Each randomly chosen patch is being mirrored with respect to the central pixel of the window, and the difference between the mean intensities of both patches is calculated. Patches can take on any rectangular shape; sizes can vary from 1 × 1 to 15(14) × 14(15) (see Fig. 1). Randomizing patch generation allows us to capture a wider range of textures while reducing runtime and memory, too. Note that this randomized patch sampling is done only once. The configuration then remains fixed for all positions of the sliding window, i.e. patch sampling is not repeated for each new window position. Note that this definition of patch generation explicitly allows overlapping patches, both in the same iteration step and in consecutive steps. For example, consider a patch that has been randomly generated such that it overlaps with the central pixel of the 15 × 15 window. If we now mirror this patch at the central pixel, the second patch will overlap with the first one. In the following iteration, the newly generated initial patch may then overlap with either the first or the second patch of the previous iteration, etc. While this feature generation strategy results in highly correlated features, it is, in principle, capable of covering isotropic AND anisotropic texture patterns. Designing symmetric filters accounts for the nadir perspective of remote sensing data. As opposed to terrestrial images, where a typical order of object classes naturally exists (e.g., sky appears in the top image part, a building facade in the middle, and cars at the bottom), the same scene acquired in nadir view does not have such a simple ordering. One could argue that still some typical organization of object classes exists (e.g., car on road and buildings close to streets), but we cannot assume any scene-specific structure in terms of ”above,” ”below,” ”left,” and ”right”. Recall that flight paths of aerial sensors vary and urban structures do often not follow any preferred direction (except cities with regular road grids). Thus, assymmetric filters would largely increase feature space dimensions, resulting in longer training times without significant information gain. In addition to these differences based on randomly generated patch pairs, the second subgroup of the RQE feature set
contains the following.1 • All pixel intensities within the 15 × 15 window in three different scales: 1) raw intensities per pixel (675 features); 2) the same window after 3 × 3 mean-filtering (675 features); and 3) after 5 × 5 mean-filtering (675 features). We also add mean values for 3 × 3 and 5 × 5 up to 15 × 15 patches, but only for the central pixel of the 15 × 15 window (21 features). Note that this is different from filtering the whole window (as in case of 3 × 3 and 5 × 5 mean-filtering), which would largely increase the feature space dimensionality without significant performance gain. • Differences between mean values of square patches of the same size centered on the central pixel of the 15 × 15 window between different spectral channels [see Fig. 2 (right)]. Square patch sizes range from 3 × 3 to 15 × 15 (42 features). • Differences between mean values of square patches of different sizes (ranging from 3 × 3 to 15 × 15), but only within the same spectral channel (126 features) [see Fig. 2 (left)]. The first and the second subgroup contain only linear features. To enable a fair comparison with the NDVI, which is a nonlinear combination of intensities across channels, we add a third nonlinear subgroup. This will also allow us to experimentally evaluate the general impact of nonlinear features, which do, of course, increase the feature dimensionality, on the classification performance. We include and extend the NDVI by computing it for all possible combinations of two channels. More precisely, for two different channels, we divide the difference of mean values of square patches by their sum. These square patches (ranging from 3 × 3 to 15 × 15) are centered on the central pixel of the 15 × 15 window, and both patches of a pair (i.e., one in the first channel and another one in the second channel of the channel combination) have the same size (42 features). The second subgroup of the RQE feature set with only linear features consists of 2214 features. Adding the third subgroup, the nonlinear features, increases the feature space to 2256 dimensions. Recall that patches of the first sub-group are randomly sampled within the 15 × 15 window, and thus, feature space dimension depends on the number of samples. This RQE feature set has inherited all the properties of [45], but it broadens them. True derivative filters are approximated reasonably, and the randomized patch-based subgroup naturally enables including a vast range of scales and texture frequencies. Patches are no longer restricted to a grid, and their shape is not imposed to be square. This new layout also takes advantage of color information explicitly by exploiting differences (and ratios) between spectral bands. IV. C LASSIFIER The classifier that is chosen is a multiclass extension of discrete AdaBoost [46]. Boosting has turned out to be significantly better (4%–10%) than linear SVMs and random 1 The numbers of features in brackets are always given under the assumption of three channels.
5
2X6
6X6
h disagrees with the class label yi . The weak learner that maximizes |� − 0.5| is chosen for the next iteration and is assigned a weight α � � 1−� 1 (2) α = log 2 �
9X8
Fig. 1. Randomized patches: Examples of rectangular patches of random size. The grid within dashed lines symbolizes the image, solid black lines depict a sliding window of size 15×15 centered on the pixel of interest (dark blue). The difference is computed between the mean values (”-” subtracted from ”+”) of both image patches (red) and repeated with random position and size of patches.
Fig. 2. Left image: Differences between means inside square patches with different sizes (3×3 (dark grey) to 15×15 (light grey)) centered on the pixel of interest. Right image: Differences between means inside square patches (red) of equal size over different image channels (within the sliding 15×15 window (solid black line)).
forests in previous experiments for us. Kernelized SVMs have prohibitive memory and runtime requirements, so they have not been considered. AdaBoost combines multiple classifiers (so-called ”weak learners”) in an iterative fashion. If the weak classifiers (like decision trees) operate on a subset of features during testing, AdaBoost implicitly performs feature selection during training. In each iteration, the training data are reweighted so that samples that are hard for the current classifier obtain a larger weight. Then the weak learner that reduces the weighted error rate the most is added to the classifier, and the next iteration starts. In image processing, weak learners for AdaBoost are usually decision trees, with decision stumps (trees with only one split and two leaves) being the most common choice. A. AdaBoost AdaBoost works by combining K weak classifiers hk into a strong classifier H. The final classifier (with the feature vector x) is a linear combination of the weak classifiers H(x) =
K X
αk hk (x)
(1)
k=1
The classification result (if the sample is predicted in the positive or negative class) is the sign of H. The magnitude of H signifies the confidence of the classification result. AdaBoost starts with equal weights ( N1 ) for all N samples. In each iteration AdaBoost tries to find the best weak learner to add to the strong classifier by looking at the weighted error rate �. � is the sum of all weights for which the weak learner
The better the weak learner, the higher the weight it gets in the final strong classifier. After the weak learner is added, the weights for each training sample is multiplied by a factor of exp (−αyi h(xi )), which is bigger than one if the weak learner disagrees with the ground truth label (yi 6= h(xi )) and smaller than one otherwise. This is the mechanism that ensures that ”hard” samples are more likely to be classified correctly by the weak learner chosen in future iterations. Before the next iterations, the weights are normalized to sum to one. Then, the weak learner that works best for the updated weights is added, and the whole procedure is repeated until no weak classifiers that operate better than chance are found or the desired number of weak classifier is reached. As standard AdaBoost is a binary classifier, discriminating a ”positive” (label y = +1) from a ”negative” (label y = −1) class, and we are working with a multiclass scenario, we need to use a modification of it that allows more than two classes. In this paper, we use a variant of AdaBoost.MH [47], which is a multiclass extension to AdaBoost.2 By using a one-versusall strategy (as known, for example, from multiclass SVMs), it is possible to reduce a C-class problem to a set of C binary problems. Instead of being scalar-valued, H and h are now vector-valued functions with C components. The labels also become vectors. The label yi of a sample with class c has +1 in its cth component and −1 in the other components. Weak classifiers are of the form h(x) = d · η(x)
(3)
where d is also a vector with c components with +1 or −1 in each component and η is a binary classifier (as used in standard AdaBoost). The cth component of d is +1 or −1 if the correlation (under the influence of the sample weights) between the binary classifier η and the true class label is positive or negative, respectively. This construction means that each weak classifier tries to separate two sets of classes (the classes with +1 in d from those with −1), so we can expect that we need more weak classifiers than in the two-class case (by a factor of log2 C) just by construction (since each weak learner is still effectively binary). The weights are also vectors whose components get updated independently of each other in the same fashion as in (2), so the weight increases for the components where h disagrees with the class label and decreases otherwise. There is also a per-class weighted error rate, and the ”best” weak learner is the one that has the lowest weighted error rate averaged over all components. The predicted class in H(x) is the one whose component has the highest value. A possible confidence measure is the distance between this value and the second highest value. If AdaBoost.MH were applied to a binary classification 2 In
the experiments, the software of [48] was used.
6
learner seeks to find a combination of a feature index i and a threshold θ that splits the set at a node in a way that decreases the weighted error rate the most. With µ+ and µ− being the sum of weights of positive and negative samples in a leaf node, the weighted error in that node is given by
root,inner
.1
x1
≥3
µ− `leaf (x) = −1 otherwise
(7)
This is because the label the node predicts corresponds to the label with the bigger sum of weights, so the smaller sum corresponds to the weighted error. A beneficial split has a +1 label on one side and a −1 label on the other side, as a split with the same label for both child nodes would not decrease the error rate. We call the sums for the weights in the left and right child nodes of a potential split µl,· and µl,· , respectively. This leads to the error after splitting as �s = min (µl,+ + µr,− , µl,− + µr,+ ) (8)
leaf −1
x4