No-Reference Sharpness Metric based on Inherent Sharpness S. Ryu and K. Sohn
We propose a no-reference sharpness metric that employs the concept of inherent sharpness. It provides a perceptual sharpness score based on wavelet coefficients. The proposed metric is highly correlated with subjective sharpness evaluations and outperforms other state-of-the-art metrics.
Introduction: Measurement of the sharpness or blurriness of an image is important to several image and video processing applications, such as image restoration, enhancement, deblurring, super-resolution, and biomedical applications. In particular, when combined with other factors, blurriness can be used to ascertain the overall quality of an image. Blurred images are generally due to the attenuation of high frequencies within the image, which are commonly caused by image compression algorithms, out-of-focusing, or motion blurring. Objective sharpness assessment methods have been classified into full-reference, reduced-reference, and no-reference assessments. The full-reference metrics use the original image as a reference. The reduced-reference metrics use partial information from the original image such as edge information and features of artifacts. The no-reference metrics require no information about the original image. The demand for no-reference assessments has increased since no reference image is available in many practical applications. Overview of existing no-reference metrics: Several no-reference sharpness or blurriness metrics have been proposed. In [1], Marichal et al. proposed a blur metric based on discrete cosine transform (DCT) information. The method estimates blurriness through the number of coefficients that are very near zero. Marziliano et al. [2] proposed a blur metric based on the edge-width that is a distance between the 1
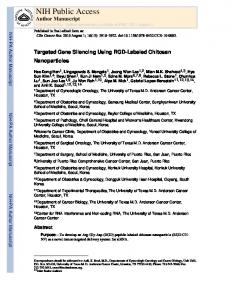
start and end points of an edge. In [3], a blur metric was proposed based on kurtosis, which is a statistical measure of the flatness of a distribution. In [4], a sharpness metric based on a local kurtosis of edge profiles was proposed by Caviedes et al. Ferzli and Karam [5] employed the concept of “just noticeable blur” (JNB) to determine noticeable edges. The metric integrated measured JNBs and probability summation model with local edge features to evaluate the perceived sharpness. Proposed sharpness metric: The proposed no-reference sharpness metric employs the concept of inherent sharpness (InS) and generates a perceived sharpness score based on wavelet coefficients. In an image, high frequencies carry information about fine details while low frequencies contain information about large features. The Human visual system (HVS) considers an image containing higher frequencies to be a sharper image owing to the presence of fine details. Yet, the degree of perceived sharpness is affected not only by the total amount of high-frequency components, but also by the content of an image, such as brightness, color, and spatial activity. In order to study the response of the HVS to sharpness in images containing different spatial activities, we performed subjective experiments and determined a relationship between the high frequencies in the image and the perceived sharpness of the image for different spatial activity levels. To obtain test images containing different spatial activities, 6 original images were selected from LIVE image DB [6] and were cropped into smaller images. Three of the images had low spatial activity while the others had comparatively high spatial activity. The cropped images were blurred by a 7x7 Gaussian filter with standard deviations of 0.5, 1.0, 1.5, 2.0, and 2.5, respectively. In total, 18 low spatial activity images and 18 high spatial activity images were used for the experiments. The results of analysis are shown in Fig. 1, which presents the relationship between the high frequencies (HF) and the Mean Opinion Score (MOS) of perceived sharpness for images with different spatial activities. The HF values represent the power of the normalized high frequency elements that have been highpass filtered with a cut-off frequency of π/8. As shown in Fig. 1, perceived sharpness 2
increased as a function of HF for both low and high spatial activities. However, images containing equal HF but different spatial activities give different perceived sharpness. From this result, we conclude that the amount of HF required to increase perceived sharpness is relatively proportional to the spatial activity. Accordingly, we define the spatial activity as the InS and use it to estimate the perceived sharpness of the image. The InS is computed by the average value of the morphological gradients as follows:
InS
1 MN
m (i, j ) , k
i
(1)
j
mk (i, j ) max M k (i, j ) min M k (i, j ) ,
(2)
M k (i, j ) { X (i x, j y ) | 1 x, y 1} ,
(3)
where mk(i,j) is the morphological gradient of location (i,j), X is an input image, and M, N are the horizontal and vertical sizes of the image, respectively. Wavelet decomposition is a general way to reveal both the spatial and frequency properties of an image. It divides the information of an image into approximated and detailed sub-signals. The approximated sub-signal represents the general trend of pixel values while the other sub-signals represent detailed features in three directions: vertically, horizontally, and diagonally. To acquire information of the HF in an image, the proposed sharpness metric employs the diagonal coefficients of wavelet decompositions. Since the vertical and horizontal details are dependent on the vertical or horizontal edges, which vary highly from image to image, the diagonal details represent more general properties, and thus are more useful for this metric. The diagonal wavelet coefficients can be computed as follows: K
K
wHH (u, v ) ψ HH (i, j ) X ( 2u i, 2v j ) ,
(4)
i 0 j 0
where ψ HH (i, j ) is a diagonal wavelet function composed of two impulse responses of horizontal and vertical high-pass filters. X is the input image and wHH(u,v) are
3
computed diagonal coefficients. Then, the power of diagonal coefficients, W, is computed, and normalized by InS (Eq. 1) in order to account for the effect of spatial activities on the perceived sharpness. Accordingly, sharpness score S can be calculated as:
m (i. j ) k
S
i
j
w
HH
u
(u, v )
2
.
(6)
v
Performance evaluations: Cropped images (typically 350 250) from the LIVE database [6] were used to establish test sets in order to consider various spatial activities. Ten original images having diverse spatial activities were blurred using three different distortion types: JPEG-2000, Gaussian blur, and linear motion blur. Accordingly, the simulated test sets were composed of 10 original, 50 Gaussian blurred, 50 linear motion blurred, and 50 JPEG-2000 compressed, totally 160 images. To obtain subjective perceived sharpness scores of the test images, subjective tests were conducted according to ITU-R 500 recommendations [7]. In the experiments, ten subjects graded each image based on the perceived sharpness using a continuous scale, and the final grade of perceived sharpness for each image was computed by averaging the grades. To evaluate the proposed metric’s performance, we used the Pearson correlation between the MOS and the metric’s scores. The proposed sharpness metric was compared with the five existing sharpness or blurriness metrics based on DCT [1], edge-width [2], kurtosis [3], edge profile local kurtosis [4], and JNB [5]. To analyze the performances of these metrics more consistently, MOSblur = 100 - MOS was used as the subjective blur value instead of the originally obtained MOS because this MOS represents perceived sharpness, not blurriness. The correlation value between the MOS and the proposed metric’s score, as well as the values from five other metrics, are presented in Table 1. For all of the metrics, the obtained correlations were above 0.9 and were therefore highly correlated to the subjective evaluations for same 4
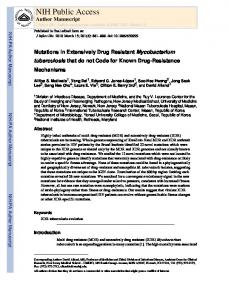
scenes. The performance of existing metrics decreased, however, for the Gaussian, linear motion, and JPEG-2000 blurred images, in which both the scene characteristics and the rate of blur were varied but the type of blur distortion remained fixed. Especially, edge information based metrics [2][4][5] give poor performance due to lack of edges in images over-blurred and with low spatial activity. Admittedly, the correlation of the proposed sharpness metric also decreased when compared to that of the same scene value, but it still showed higher correlations than the existing metrics, 0.87, 0.91, and 0.77 for Gaussian blur, linear motion, and JPEG2000, respectively. In addition, the proposed metric significantly outperformed the other metrics when all the types of distortions were taken into account in the evaluation. Fig. 3 shows the scatter plots of the MOS versus the objective sharpness or blurriness metrics. The R2 value represents a coefficient of determination that provides a statistical measure of how well the regression curve performs as a predictor on the real data points. The experimental results show that the proposed metric works well in different scenes and with blur types and a superior metric to measure of sharpness an image. Conclusion: We propose the objective sharpness metric that employs the concept of inherent sharpness and wavelet coefficients, which takes into account the response of HVS to sharpness on images of different spatial activities. Unlike existing metrics, the proposed metric proved to be content invariant and provided an accurate measurement of the perceived sharpness regardless of the scene characteristics or blur types. Acknowledgement This research was supported by the IT R&D program of MKE/KCC/KEIT [10035158, Quality monitoring and quality assurance for multimedia and 3D applications]
5
References 1. X. Marichal, W.-Y. Ma, and H.J. Zhang, “Blur determination in the compressed domain using DCT information,” in Proc. IEEE Int. Conf. on Image Processing, Kobe, Japan, Oct. 1999, pp. 386-390. 2. P. Marziliano, F. Dufaux, S. Winkler, and T. Ebrahimi, “Perceptual blur and ringing metrics: Applications to JPEG2000,” Signal Processing: Image Communication, vol. 19, no. 2, pp. 163-172, Feb. 2004. 3. N. Zhang, A. Vladar, M. Postek and R. Larrabee, “Spectral density-based statistical measures for image sharpness”, Metrologia, vol. 42, no. 5, pp. 351-359, Aug. 2005. 4. J. Caviedes and F. Oberti, “A new sharpness metric based on local kurtosis, edge and energy information,” Signal Processing: Image Communication, vol. 19, no. 2, pp. 147-161, Feb. 2004. 5. R. Ferzli and L. Karam, “A no-reference objective image sharpness metric based on the notion of just noticeable blur (JNB)”, IEEE Transaction on Image Processing, vol. 18, no. 4, pp. 717-728, Arp. 2009. 6. H. Sheikh, Z. Wang, L. Cormack, and A. Bovik, LIVE Image Quality Assessment Database
Release
2,
2006,
[Online]
available:
http://live.ece.utexas.edu/research/quality. 7. ITU-R Recommendation BT.500-11, “Methodology for the subjective assessment of the quality of television pictures”, ITU-R, Geneva, Switzerland, 2000.
Authors’ affiliations: S. Ryu and *K. Sohn (School of Electrical and Electronic Engineering, Yonsei university, 50 Yonsei-ro, Seodaemun-gu, Seoul, Republic of Korea) *: Corresponding author E-mail:
[email protected]
6
Figure captions: Fig. 1. Relationship between high frequencies (HF) and perceived sharpness (MOS) for different spatial activities Fig. 2. Scatter plots for Gaussian + linear motion + JPEG-2000 blurred images: (a) MOS versus the proposed metric (b) MOSblur versus edge-width based metric [2] (c) MOSblur versus DCT based metric [1] (d) MOS versus JNB based metric [5] (e) MOSblur versus kurtosis based metric [3] (f) MOSblur versus local edge based metric [4] (a) (b) (c) (d) (e) (f)
Figure 1
7
Figure 2
8
Tables Table 1. Pearson correlation values for the proposed metric and five existing metrics. Gaussian blur
Linear motion
JPEG-2000
Gaussian + Linear motion + JPEG-2000
0.95
0.87
0.91
0.77
0.87
Edge-width [2]
0.94
0.63
0.65
0.76
0.61
DCT [1]
0.93
0.83
0.79
0.57
0.76
JNB [5]
0.90
0.75
0.69
0.44
0.66
Kurtosis [3]
0.94
0.82
0.84
0.69
0.78
Edge-profile [4]
0.95
0.75
0.64
0.46
0.68
Metric
Same scenes
Proposed
9