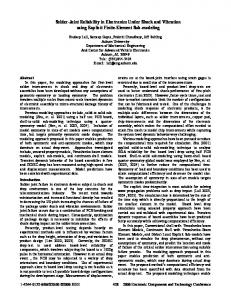
Non-Wet Solder Joint Detection in Processor Sockets and BGA Assemblies Asaad F. Said1, Bonnie L. Bennett2, Francis Toth2, Lina J. Karam1, and Jeff Pettinato2 School of Electrical, Computer, & Energy Engineering, Arizona State University, Tempe, AZ, USA 2 Intel Corporation, USA
[email protected],
[email protected],
[email protected],
[email protected],
[email protected] 1
Abstract The existence of non-wet solder joints in PCB sockets can cause boards failures and it’s necessary to inspect theses sockets to locate any possible defective joints. 2D or advanced x-ray machines are used to image solder joints in processor sockets and make solder joints visible to be examined by the operator who determines if each individual joint is defective or not. This is a very time consuming process since each processor has an average of 150 images with 30 joints per image. An accurate and efficient non-wet detection method is proposed in this paper. The main components of the proposed method consist of region of interest (ROI) segmentation, feature extraction, reference-free classification, and automatic mapping. The ROI segmentation process is a noise-resilient segmentation method for the joint area. The centroids of the segmented joints (ROIs) are used as feature parameters to detect the suspect joints. The proposed reference-free classification can detect defective joints with high accuracy without the need for training data. An automatic mapping method is used to get the precise label and location of the suspect joint. The accuracy of the proposed method was determined to be 95.8% detection rate with 1.1% false alarm rate based on the examination of 56 sockets (500K joints). In comparison, the detection rates of currently available advanced x-ray tools with multi-dimension capability are in the range of 43% to 75%. The proposed method reduces the operator effort by 90%. The presented system identifies neighboring joints to any missed non-wet joints, which provides an operator with the capability to make 100% detection of all non-wets. The proposed scheme works with a 2D x-ray imaging device, which makes the proposed scheme relatively inexpensive to implement, and is very portable and easy to set up as compared to the available advanced x-ray tools with multi-dimension capability. I. Introduction A single non-wet solder joint in a critical area will result in a board failure. Board failures are costly particularly if they are not detected until late in the assembly process or even after delivery. There are several different methods that can be used to identify non-wet joints. The common methods that are used to make the non-wet visible are 2D or multi-dimensional x-ray machines to image solder joints in processor sockets. The x-ray methods produce images which are examined by an operator to locate the non-wet joints. The non-wet shows up as a shadow extending below the body of the joint as shown in Fig.1. The inspection process is very manual and time consuming. The operator must first collect the x-ray images and then examine each image in detail and locate the non-wet joint among tens of other joints. Detection under these criteria is difficult and produces highly variable results. Even with training, the homogeneity of the image and the closeness
978-1-4244-6412-8/10/$26.00 ©2010 IEEE
Non-wet solder joints
Fig.1: 2D x-ray image with defective solder joints (nonwet) highlighted in dotted white color.
of smaller joints make a high degree of accuracy extremely difficult. A typical x-ray inspection process that allows manual detection of the non-wet joints is done by setting up and programming a 2D x-ray machine to image the processor socket of a board. The images of the sockets are taken at oblique angles to make the non-wet joints visible to the operator. In order to identify all the non-wet joints in a socket, the operator must then look through a large set of 150 to 200 images. Each image can contain an average of 30 solder joints. The constant checking of homogenous images is fatiguing, highly variable and can result not only in missed detections but also in ergonomic issues. A means of automatically detecting suspect joints and classifying the defects on those joints is needed to mitigate these issues. This can significantly decrease the number of images that need to be manually checked, reduce variability and enable more rapid fault detection and isolation through better inspection quality. The considered x-ray images with oblique angles present many challenges including inconsistency in joint shape and size, lighting variation, image blurring, overlapping between neighboring joints and the joints repetitive pattern. The images are also corrupted with noise during the image capturing process. The shape of the joints varies as a function of their position within the image and the camera angle (circle, eggy, ellipse, and other shapes). Thus, the circular shape assumption for non-defective joints as in [1-8] is not valid in our case. Our investigation of other work showed that the methodology described in this paper is unique. The proposed automatic defect identification and classification scheme is reference-free in the sense that it does not make use
1147 2010 Electronic Components and Technology Conference
Fig. 2. Image acquisition using Xray machine with oblique view.
Fig. 3. Top-down view of a solder joint ball grid array.
of known training data to locate defective joints. The primary goal of this work is the identification of suspect joints in processor sockets before they leave the factory. Another goal is to assist engineers with rapid, new technology development through early identification of process issues. This paper is organized as follows. Section II presents the Image Acquisition Challenges. Section III presents the Proposed Non-wet Detection for Solder Joints. Performance Results are presented in Section IV. A conclusion is given in Section V. II. Image Acquisition Challenges For the non-wet detection, a transmission-type x-ray system was used. Transmission-type x-ray systems consist of three main elements: the x-ray source, sample stage, and x-ray detector. The geometric magnification of the image is determined by the ratio of sample to detector and sample to xray source distances. Therefore, for adequate magnification,, it is desirable to move the sample to be imaged as close as possible to the x-ray source; however, this creates a challenge because the height of components on a PCB board can hinder the free movement of x-ray stage when holding the sample. For this reason, it is advantageous to image the PCB board with the secondary side facing the x-ray source. Even if the secondary side of the PCB is populated with components, they are generally lower form factor than components on the primary side. Another main requirement for non-wet solder joint detection is the ability of the x-ray detector to move into a lateral position which maintains the highest magnification possible while providing the ability to image the component solder joints from an angle. Without the capability of the xray detector to tilt from the main axis and the rotation of the x-ray stage, non-wet solder joint detection would not be possible. Fig. 2 shows the process of image acquisition using the x-ray machine with a collector angle at 45o. The collector angle is critical to the detection of the nonwet solder joints. When the collector angle is at 45o, the angles of the solder ball patterns appear at approximately 45o in the images and the non-wet joints are very visible to the operator. If the collector angle is shallower than 45 o,, the rows of joints can merge into each other making the detection more difficult. If the collector angle can be increased to an angle higher than 45o, the non-wet joint is more visible and thus has a higher probability of being detected by the operator. A collector angle of 45o is used in this experiment because it was the highest oblique view obtainable by the employed instrument.
Fig. 4. Imaging sequence for each X-ray stage rotation angle.
Other factors that influence the collection of the x-ray image are the parameters of tube acceleration, voltage, and current. These parameters need to be adjusted to maintain good contrast between the solder joint array and the background. Due to the fact that, in ball grid array (BGA) and socket components, the solder ball patterns follow a right angle pattern as shown in Fig. 3, the x-ray image collection can proceed in a grid like pattern around the component of interest. The same grid pattern is repeated for three additional x-ray stage rotation angles that are 90 degrees apart, while maintaining the same magnification. In the example presented, the rotation angles for imaging were chosen as 45o, 135o, 225o, and 315o degrees as shown in Fig. 4. This multiangle imaging maximizes the potential of detecting non-wet solder joints because non-wet solder joints are not necessarily visible from every angle due to possible variations in the solder joint geometry caused when the non-wet is formed. The multi-angle imaging motion requires precise manual control. This type of manual control is not suitable for high volume manufacturing environments (HVM) which need consistent and fast results. A script that automatically positions the board to allow the x-ray to move over each specific area of the socket was developed to allow consistent and accurate imaging. A fixture to hold the boards accurately was also developed. The fixture allows the board to be positioned using fiducial marks present on the board. Typical non-wet detection x-ray equipment applications only identify the board as having a non-wet or not with manual positioning of an area of the part and possibly with further manual manipulation to provide actual joint label. It was desired to collect data for individual joints to provide accurate and precise failure data for analysis and process improvements. In order to collect individual joint data automatically without relying on manual manipulation of the x-ray software once a non-wet was located, it was necessary to develop an automatic process to know the precise coordinates of a position in each x-ray image taken. The script developed to move the x-ray precisely over the part was modified to provide the precise coordinates of a joint in the center of each image taken. The precise coordinates of the joints captured by the script are referenced to each angle at which the images were taken. It is necessary to get the coordinates referenced to existing design coordinates with respect to a single reference frame for the entire set of images. The CAD data for the socket is considered the single reference frame. The coordinate data obtained from running the script is combined with existing CAD data using polar
1148 2010 Electronic Components and Technology Conference
coordinate rotations to resolve the data taken at different angles. The resulting file can be used to generate a lookup table which precisely defines the position of a central point in each image in the CAD coordinate system. This file can be used along with the corresponding image number to reference the joint label within each newly acquired image. III. Proposed Non-wet Detection for Solder Joints In this paper, an automatic non-wet solder joint detection method is proposed. The proposed method is referred to as no-reference because no reference data are used to detect the non-wet joints. The proposed method uses a lookup table as a reference data only to get the automatic labels for suspect joints. The solder joint area, which is referred as the Region of Interest (ROI) in this paper, is segmented first to extract some feature parameters that best describe properties that are used to discriminate between defective and non-defective joints. One of the important properties of the solder joints in processor sockets is that they are aligned in parallel horizontal lines and parallel vertical lines when the solder joint images are captured at a 90o angle relative to the board (top view). However, top-view images do not provide a good view for non-wet detection. Images taken with oblique angles are required to distinguish non-wet joints from good joints. However, solder joints in images with oblique angles are no longer aligned on parallel vertical and parallel horizontal lines. Also, the imaged joints exhibit variations in shape and size within the same image and across images due to perspective effects when imaging at oblique angles. The oblique angle images still exhibit the feature that the solder joints are aligned in straight lines even though these lines are not necessarily parallel. The centroids of the joints are significant features that can be used to check for joint alignment in each line and can be, therefore, used to distinguish between suspect and non-suspect joints. The proposed automatic non-wet defect detection scheme consists of three components including: 1) adaptive segmentation thresholding that is resilient to noise and illumination changes in order to extract the solder joints (ROIs); 2) a no-reference classification component in which each segmented solder joint area is classified as suspect or non-suspect using a procedure that exploits the fact that the centroids of the solder joints should be aligned in straight lines in the directions that represent the projected parallel horizontal and parallel vertical lines of the socket (top view), angular deviations of the joints’ centroids in each line are computed locally to be used for classifying the considered joint into suspect joint (significant deviation) and non-suspect (insignificant deviation); 3) the third component is an automatic mapping procedure which finally maps the positions of all joints to a known labels in the lookup table for recording and disposition. The scheme of the proposed method is shown in Fig. 5. The first step of the proposed scheme is pre-processing the input image in order to reduce the artifacts and noise that are introduced by the x-ray machine during the image acquisition process. Most notably, the image contains salt and pepper noise which can be easily removed by applying a simple and fast 3x3 median filter [9, 10] which can effectively remove this type of noise without significantly blurring the edges in
Input Image
Preprocessing Step
ROI Segmentation Angle Deviation at each joint
Suspect joint
Yes
Calculate the joint centroid of each segmented ball Check joint centroid alignment across the image
No
Angle’s deviation>T
Non-suspect joint
Fig. 5. Block diagram of the proposed automatic defect classification scheme for non-wet joints in processor socket. 0.014 Solder joint clustering region
0.012 Threshold Value
0.01 0.008
Background clustering region
0.006 0.004 0.002 0
0
u1
50
T
100
u2
150
200
250
Fig. 6: Thresholding using histogram analysis
the image. Solder joints are then segmented using a proposed adaptive histogram-based thresholding procedure to get ROIs. This is followed by the computation of the centroids of the segmented joints and by checking the alignment of those joints' centroids in order to detect suspect joints. Details about the ROI segmentation, joint centroids computation, joint centroids alignment, centroid-based classification, and automatic joint mapping are given in the following subsections. A. Solder Joint Segmentation The 2D x-ray image quality can suffer from a number of xray parameters, settings, and variables. In order to segment the solder joint area, it is important to use an adaptive threshold value which is based on the image intensity distribution instead of using a fixed threshold value. In the proposed method, an automatic thresholding value based on the image histogram analysis is applied to the original image to segment the solder joints. Fig. 6 shows the histogram of the 2D x-ray image where the histogram contains two main cluster regions represented by two distinct peaks: the solder joint and background regions. The two cluster regions can be represented by a mixture of two Gaussian distributions with two different means and variance parameters. In order to separate the two regions, an automatic threshold should be selected adaptively for each image midway between the mean values of the two Gaussian distribution functions. In order to compute the segmentation threshold for each image, the means of the Gaussian distributions need to be estimated first and then used to obtain the initial segmentation threshold value. The updated threshold is set to be the average of the two cluster means. This refinement step is repeated until the two cluster mean values no longer change, resulting in the final threshold estimate. This procedure converges in 4 to 6
1149 2010 Electronic Components and Technology Conference
(a) Original image
(b) Segmentation using Thresholding
(c) Final segmentation mask
(d) Solder joint segmentation results
Fig. 7: ROI segmentation of candidate solder joints.
L7
L1
L8 L2 L9
L10
L3
L11 L4
L12
L5
L13 L6
(a). Joints Centroids Extraction
(b). Checking neighbors joints to get the ones that are falling in the same lines.
(c). getting neighbor joints that are falling in the desired directions.
(d) Centroids clustering: classification into different groups (directional clusters).
Fig. 8: Centroids directional clustering: classification of centroids into different groups based on alignment along two directions.
iterations on average. Fig. 7(b) shows an example of the segmentation mask that is obtained by applying the above adaptive histogram-based thresholding algorithm to the image shown in Fig. 7(a) in order to segment the ROIs (solder joint areas). The image shown in Fig. 7(b) has some issues which need to be addressed such as: 1) undesired regions that need to be removed such as small areas of background and incomplete joints that correspond to joints near the image borders, and 2) touching and overlapping solder joints. The overlapping between solder joints may result in the erroneous merging of separate ROIs and, consequently, in the misclassification of the considered solder joints. A mathematical morphology based procedure can be used to tackle the aforementioned issues. To separate overlapped solder joints, the erosion morphology operation is performed first followed by the dilation morphology operation using a circular structuring element [10-12]. Similarly, the undesired regions, including the incomplete joints near the image borders and small regions in the background can also be easily removed by using morphological operations based on the area of complete solder joint. Fig. 7(c) shows the final resulting segmentation mask after solving the aforementioned issues. Fig. 7(d) shows the result of applying the mask of Fig. 7(c) to the original image in Fig. 7(a). B. Joint Centroid Feature Extraction and Alignment The centroids of the segmented solder joints function as feature parameters that can be used for checking the degree of alignment between the solder joints despite the perspective effects and the non-parallel lines introduced by the x-ray image being taken at multiple oblique angles. To calculate the
centroids of solder joints, each individual segmented solder joint (ROI) has to be extracted with a unique label by using an image labeling procedure [13]. The labeling procedure is applied to the binary segmentation mask image (Fig. 7(c)) which consists of 0's that represents the background region and 1's that represents the isolated white regions (corresponding to the segmented solder joints). Each white region, consisting of 4 or more connected pixels, is uniquely defined by assigning a label number to all pixels in the considered region. The label number is increased by 1 and the process is repeated when a new isolated white region is detected till all the ROI areas are labeled. Each individual joint can then be extracted and identified by its label number and, therefore, its centroid locations. Fig. 8(a) shows the extracted centroids (‘+’ symbol) of the segmented joints of Fig. 7(d). In the considered setup, the images are captured at known oblique angles: 45°, 135°, 225°, and 315° which are multiples of 45°, and which correspond to two main directional clusters at angles 45° and -45° as shown in Fig. 7(a). The main key of locating suspect joints is first applying an efficient centroid clustering by grouping together centroids that lie on or close to a straight line. The search range for the centroids’ alignment is limited to finding two directions θ1 and θ2 around 45º and -45 º, respectively, where 45º - θε ≤ θ1 ≤ 45º + θε and -45º - θε ≤ θ2 ≤ -45º + θε (where θε = 15º in the implementation). The angles between the considered joint and its surrounding neighbors are used to get cluster lines in the direction of θ1 and θ2 as shown in Fig. 8(b). Fig. 8(c) shows the result of the search algorithm in locating the surrounding
1150 2010 Electronic Components and Technology Conference
joints that lie in the desired directions θ1 and θ2. Following the same procedure locally at each joint, one can determine the groups of joint centroids that lie on or near the same line as shown in Fig. 8(d). C. Centroid-based Classification of Solder Joints To distinguish between suspect (non-wet) and non-suspect joints, a robust classification procedure is needed to classify each individual centroid in each directional cluster. This classification is performed by checking the degree of alignment of each joint's centroid with respect to the rest of the joints in the same directional cluster. In the proposed reference-free classification procedure, the steps to the detection of suspect joints are: 1) calculate the angle deviation between each joint d and the rest of the joints k in the same directional cluster line (where k = 1,2, ..., Ni; k ≠ d and Ni represents the number of joints in line i ; 2) the output of the previous step gives a vector with Ni - 1 angle deviation values for each joint d in the same cluster line i; the standard deviation (δid) of these angle deviations is calculated for each joint in the same cluster line; 3) each joint is classified as a suspect joint if the joint has a significant deviation (high δid)) or as a good joint if the joint has an insignificant deviation (low δid) as shown in Fig. 9; 4) the previous step is repeated for all clustering lines i in the directions of θ1 and θ2 to detect all the suspect joints in the image. To check if the joint deviation is significant or insignificant, an experiment was conducted to determine a threshold value Tε that is used to classify each joint with a standard deviation δid into suspect and good joint as follows:
There is no suspect joint
There is a suspect joint
Fig. 9: Angle deviation at each joint's centroid
Y=2 ?
X\Y
24
27
28
29
30
…
1
..
L1
M1
N1
P1
..
2
H2
L2 (2,27)
M2
N2
P2
..
3
H3
L3
M3
N3 (3,29)
P3
..
4
H4
L4
M4
N4
P4
..
5
H5
L5
M5
N5
P5
..
6
H6
L6
M6
N6
P6
..
7
..
..
..
..
..
..
25
26
L2
(0,0) X=1
Y+2
X+1
(a). 2D x-ray image taken 45o oblique angle
(b) look up table
Fig. 10: Solder Joint Automatic mapping procedure
crucial to have an automatic joint mapping algorithm which would not only save time but can also produce accurate (1) results. The x-ray machine can be programmed to acquire 2D Lower Tε value increases the number of suspect joints and images of the processor socket in a specific sequence. The produces a higher false positive rate. Higher Tε decreases the center of each 2D x-ray image can be set to a specific known number of false positive joints and may cause some non-wet solder joint’s label. This is an important advantage that can be joints to be missed. A conservative deviation threshold which used to generate the automatic mapping of solder joint to a produces a low false positive rate and which results in a specific label without the use of reference images. The relatively high detection rate of non-wet joints was determined experimentally and based upon statistical analysis proposed automatic mapping of solder joints uses only the [14]. Since each joint belongs to two directional clusters θ1 current image and a lookup table for calculating the joint and θ2, the degree of alignment for each joint is checked twice labels. The lookup table is obtained from the master CAD file as described above, once for each cluster. This helps in of the processor socket. The master file contains the joint’s increasing the detection rate of non-wet joints because, in label and its coordinates. Each joint has a unique label which some cases, the non-wet joints cannot be detected in one consists of letters that represent rows and numbers that direction as they may be aligned in that direction with other represent columns, i.e., B3, W43, AY17....etc. The lookup joints, but can be detected due to misalignment in the second table is represented by a matrix that has the same dimensions of the processor socket where one can locate the joint by its direction. coordinates. The procedure of automatic mapping of solder D. Automatic Joint Mapping joints can be summarized as follows: 1) locate the joint in the The same non-wet joint can be detected several times due to center of the given 2D image; 2) generate a new coordinate the fact that the joint can appear in at least 4 different images system that has its origin (0,0) at the center joint as shown in corresponding to 4 different oblique angles. It is difficult to Fig. 10(a); 3) get the position of each other joint in the image know whether a detected non-wet joint has been detected using the new coordinate system; 4) since the label of the before or whether the detected joint corresponds to a new center joint is given, one can easily locate the labels of the rest detection. To know if the joint has been detected before or of the joints from the lookup table (see Fig. 10(b)). The not, the operator has to have a map which provides a unique proposed solder joint automatic mapping is simple and can label to the same joint in each of the oblique angle views. This work accurately with any processor socket once we have the is time consuming and tedious work for the operator to look at master CAD file. The automatic mapping method works around 5400 repeated joints in each socket. It is therefore perfectly on each inspected 2D x-ray image without the need
1151 2010 Electronic Components and Technology Conference
C5 B5
D4
(a) Classification results
(b) Zoom in of non-wet in (a)
(c) Classification results
(d) Zoom in of non-wet in (c)
Fig. 11: Examples of non-wet joints detection using the proposed algorithm with automatic mapping.
of reference images for every image processed, which is one main advantage of this method. IV. Performance Results An example of the proposed method with automatic mapping is given in Fig. 11. Images in Fig. 11 show examples of detecting non-wet joints in different sockets using the proposed scheme. The detected non-wet joints are highlighted with a spot in their centroids. Figs. 11(b) and (d) show an enlarged view of the non-wet joints detected in Figs. 11(a) and (c), respectively. Despite the fact that some of the nonwet joints are hard to notice by the human eye, such as for example the non-wet joints shown in Figs. 11(c), the proposed algorithm is capable of detecting these non-wet joints accurately. Ground truth data clearly identifying the non-wet joints is required to verify the accuracy of the proposed algorithm with automatic mapping. Dye and pull validation was used to get ground truth data to verify the accuracy of the proposed algorithm. Dye and pull testing consists of immersing the board with the unit attached in a red dye and then pulling the unit off the socket and examining it for non-wet joints. The non-wet joints are identifiable to the operator by looking at an abnormal separation point between the board and the unit and are identified by the amount of solder residue remaining on the each joint in the unit. Dye and pull validation was run for 56 sockets. Each socket has 1366 unique joints, which gives a total number of joints equals to 76,496 joints in the inspected sockets. The number of non-wet joints that were detected by the dye and pull was 47. The total number of non-wet joints that were detected by the proposed algorithm and that matched the dye and pull results are 45 out of 47 non-wet joints. This gives a detection rate equal to 95.8%. The algorithm detected a total of 911 suspect joints of which 866 were false positives. The resulting false positive rate is 1.1% (866/76496). The average number of suspect joints per socket is 16 joints (911/56). Assuming the worst case of 1 suspect joint per image, this requires an average of 16 images to be inspected by the operator instead of 150 images in a single socket, which reduces the inspection time by approximately 89.3%. For the 2 missed non-wet joints, the algorithm detects the neighboring joints of the missed ones. The identification of the neighboring joints enables the operator to focus attention on the area surrounding the detected suspect joint.
This can allow a detection rate of 100% with the operator in the loop. A comparison between the results of the proposed algorithm with one of the up-to-date advanced-capability xray machines with an embedded non-wet algorithm was run for the same sample sockets. The up-to-date advanced capability x-ray machine, which costs 5x to 10x the price of the 2D x-ray machine, shows a non-wet detection rate in the range of 43% to 75%. However, the proposed method gives 95.8 % which is 21% to 53% more accurate as compared to the advanced-capability x-ray machines. The overall performance of the proposed method is fast and the inspection process is very efficient due to the fact that, as soon as the 2D x-ray image is available, it is processed and, if suspect joints are found, the image is immediately made available to the operator. This enables the inspection to be completed at the same time or very close to the time that the x-ray itself has finished imaging the socket. The user interface of the proposed method is shown in Fig. 12. This interface is currently being used in technology development at Intel Corporation. V. Conclusion In this paper, an automatic defect detection method is presented to accurately locate the non-wet solder joints in processor sockets. The method is capable of locating the nonwet joints in socket images that were taken at different oblique angles using a 2D x-ray machine. The method has been implemented into an application which is currently being used in technology development at Intel Corporation. A performance evaluation was conducted and the resulting statistics show that the proposed algorithm provides a detection rate of 95.8% which is 21% to 53% better than commonly used state-of-the-art inspection machines. With an operator in the loop, the proposed method has the potential of producing 100% detection rate due to the identification of neighboring joints to any missed defective ones. Moreover, the proposed scheme reduces the false positive rate, false negative rate, and the inspection time and requires only a relatively inexpensive 2D x-ray imaging device, which makes it cost effective as compared to other multi-dimensional stateof-the-art inspection machines. Other future work includes considering new features in addition to the angular deviations of the joints’ centroids, and characterizing other types of defects in solder joints.
1152 2010 Electronic Components and Technology Conference
5.
6.
7.
Fig. 12: User Interface of the proposed non-wet detection method.
8.
VI. References 1.
2.
3.
4.
S. Rooks, B. Benhabib, and K. C. Smith, "Development of an inspection process for ball-grid-array technology using scanned-beam X-ray laminography," Proceedings of the Technical Program. National Electronic Packaging and Production Conference. pp. 277-89, Des Plaines, IL, USA, 1993. T. Sumimoto, T. Maruyamay, Y. Azuma, S. Goto, M. Mondo, N. Furukawa, and S. Okada, "Detection of defects at BGA solder joints by using X-ray imaging," IEEE International Conference on Industrial Technology. pp. 238-41, Piscataway, NJ, USA, 2002. T. Sumimoto, T. Maruyama, Y. Azuma, S. Goto, M. Mondou, N. Furukawa, and S. Okada, "Shape measurement of BGA for analysis of defects by X-ray imaging," Proc. SPIE - Int. Soc. Opt. Eng.pp. 361-5, USA, 2004. T. Sumimoto, T. Maruyama, Y. Azuma, S. Goto, M. Mondou, N. Furukawa, and S. Okada, "Development of image analysis for detection of defects of BGA by using X-ray images," Proceedings of the 20th IEEE
9. 10. 11. 12.
13. 14.
Instrumentation Technology Conference. pp. 1131-6, Piscataway, NJ, USA, 2003. M. Ji-Quan, K. Fan-Hui, M. Pei-Jun, and S. Xiao-Hong, "Detection of defects at BGA solder joints by using X-ray imaging," Proceedings of 2005 International Conference on Machine Learning and Cybernetics. pp. 5139-43, Piscataway, NJ, USA, 2005. K. Kuk Won, R. Young Jun, C. Hyung Suck, and K. Hyung Cheol, "A neural network approach to the inspection of ball grid array solder joints on printed circuit boards," Proceedings of the IEEE Int. Joint Conference on Neural Networks. IJCNN2000. pp.233-8, Los Alamitos, CA, USA, 2000. K. W. Ko, Y. J. Roh, H. S. Cho, and H. C. Kim, "Neural network approach to the inspection of ball grid array solder joints on printed circuit boards," Proceedings of the International Joint Conference on Neural Networks. pp. 233-238, Piscataway, NJ, USA, 2000. Y. J. Roh, K. W. Ko, H. S. Cho, H. C. Kim, H. N. Joo, and S. K. Kim, "Inspection of ball grid array (BGA) solder joints using X-ray cross-sectional images," Proc. SPIE - Int. Soc. Opt. Eng. pp. 168-78, USA, 1999. J. S. Lim, "Two-Dimensional Signal and Image Processing," pp. 469-476, Englewood Cliffs, NJ: Prentice Hall, 1990. Rafael C. Gonzalez, and R. E. Woods, Digital Image Processing: Prentice Hall, 2003. R. M. Haralick, and Linda G. Shapiro, "Computer and Robot Vision," pp. 158-205: Addison Wesley, 1992. B. Rein van den, and B. Richard van, “Methods for fast morphological image transforms using bitmapped binary images,” CVGIP: Graph. Models Image Process., vol. 54, no. 3, pp. 252-258, 1992. R. M. Haralick, and Linda G. Shapiro, Computer and Robot Vision, pp. 28-48: Addison-Wesley, 1992. Asaad F. Said, Bonnie L. Bennett, Lina J. Karam, and Jeff Pettinato, “Automated Detection and Classification of Non-Wet Solder Joints,” Accepted for publication in IEEE Transactions on Automation Science and Engineering, 2010.
1153 2010 Electronic Components and Technology Conference