the steady value of penetration resistance reached after many cycles of movement. Numerical studies (Zhou & Randolph. 2009) and field data (Yafrate et al.
Proceedings of the ASME 2009 28th International Conference on Ocean, Offshore and Arctic Engineering OMAE2009 May 31 - June 5, 2009, Honolulu, Hawaii, USA
OMAE2009-79199
NUMERICAL SIMULATIONS OF DYNAMIC EMBEDMENT DURING PIPE LAYING ON SOFT CLAY D. Wang Centre for Offshore Foundation Systems University of Western Australia Perth, Western Australia
D.J. White Centre for Offshore Foundation Systems University of Western Australia Perth, Western Australia
M.F. Randolph Centre for Offshore Foundation Systems University of Western Australia Perth, Western Australia
ABSTRACT Prediction of the as-laid embedment of a pipeline, which affects many aspects of pipeline design, is complicated by the dynamic motions that occur during the lay process. These motions cause pipelines to embed deeper than predicted based on static penetration models, as the seabed soils are both softened and physically displaced by the pipeline motion. This paper describes the results of 2D numerical analyses using a large displacement finite element approach aimed at quantifying pipeline embedment due to cyclic lateral motion at various fixed vertical load levels. The validity of the numerical results is first assessed by comparison with published data from centrifuge model tests in two different types of clay. A parametric study varying the normalized vertical load is then presented, which suggests a simple approach for estimating an upper limit to the dynamic embedment. INTRODUCTION Dynamic pipe embedment: background The embedment of a subsea pipeline affects the onbottom stability of the pipeline during environmental loading, and also the lateral buckling and axial walking behavior during thermal cycles (Bruton et al. 2007). The as-laid embedment depends on a number of factors including the near-mudline shear strength profile, the submerged pipe weight, the pipe-lay configuration and the wave-induced motion of the lay vessel and the resulting pipeline movements at the seabed. The general approach for predicting pipeline
embedment combines static estimates based on the pipe weight and local stress concentration factor in the touch down zone, with a multiplicative dynamic embedment factor to account for the effects of cyclic pipeline motion during laying (Bruton et al. 2006). Back-analysis of the observed embedment of pipelines indicates a wide scatter in the apparent dynamic embedment factor (Lund 2000, Bruton et al. 2007). Some of this scatter is inevitable, due to the variability associated with the dynamics of the lay process. However, other causes of this scatter can potentially be tackled by improved calculation methods for pipeline embedment – perhaps bypassing the concept of a multiplicative dynamic embedment factor – and better techniques for assessing soil conditions close to the mudline. Model tests, either on the laboratory floor or in a geotechnical centrifuge, provide a means of assessing dynamic pipeline embedment under well controlled conditions, but it is not generally practical to cover all of the relevant range of pipe weights and patterns of cyclic motion that may occur during the laying process. Numerical analysis has the potential to augment such studies, although it is essential to first validate, and calibrate, the numerical approach. The aim of the present paper is to present a numerical approach, based on large deformation finite element analysis, to evaluate the static and dynamic embedment of pipelines. The approach allows modeling of both softening of the soil as it is remolded and also the physical scraping of the soil aside by the lateral pipeline motion. Results from the numerical approach are compared with data from centrifuge model tests
1
Copyright © 2009 by ASME
in two different soil types. The approach is then used in a parametric study to bracket the dynamic embedment anticipated for a range of normalized pipe weights and a particular soil strength profile. The resulting embedments are quantified through a simple relationship to the static embedment, but based on the remolded soil strength profile rather than the intact strength profile. Objectives and scope of this study Dynamic pipeline embedment is typically a large deformation process which features a combination of cyclic horizontal and vertical loading. The purpose of this paper is to simulate, in an idealized manner, the response of an element of pipeline during undrained dynamic laying using a twodimensional large deformation finite element (LDFE) method, termed ‘remeshing and interpolation technique with small strain’ (RITSS, Hu & Randolph 1998). The parameters that affect the embedment behavior are assessed, including the pipe weight relative to the soil strength, the number of horizontal cycles of movement and softening of the soil around the pipe. The dynamic embedment of a pipeline is a threedimensional soil-structure interaction process, which is driven by the prevailing metocean conditions, the geometry of the pipeline catenary, the characteristics of the lay vessel, and the response of the seabed. This study focuses on the geotechnical aspect of this behavior – the interaction between the pipeline and the seabed. This interaction has been idealized as monotonic vertical load applied on the pipe and subsequent cyclic horizontal motion whilst the vertical load is held constant. This approach is an idealization of the load conditions applied as a section of pipe moves through the touchdown zone when laid on the seabed. This process is described in more detail by Randolph & White (2008a). NUMERICAL TECHNIQUES Large deformation finite element analysis The RITSS method is composed of Lagrangian steps incorporating ‘convection’ of field variables between meshes. The method divides the initial vertical penetration and subsequent horizontal oscillations into a series of incremental steps. The pipe displacement in each step has to be small enough to avoid element distortion in the vicinity of the pipe. The small strain calculation then can be performed reasonably, followed by mesh regeneration according to the deformed geometry. The field variables including the stresses, strains and material properties are mapped from the old mesh to the new mesh. The mapping is similar to the flow of solid in an Eulerian mesh, so the RITSS method can be viewed as a special Arbitrary Lagrangian-Eulerian method. The advantage of the RITSS approach is that it can be coupled with any standard finite element package. In this paper, ABAQUS has been selected to conduct the small strain calculation and the mesh generation process, with the soil being composed of quadratic triangular elements.
The accuracy of LDFE analyses depends largely on the strategy used to map field variables. The mapping consists of extrapolation of field variables from the old Gauss points to the old element nodes and then interpolation from the old nodes to the new Gauss points. For the extrapolation, a technique termed Superconvergent Patch Recovery (SPR, Zienkiewicz & Zhu 1993) is employed, the robustness of which has been verified in our previous LDFE studies (Randolph et al. 2008; Wang et al. 2008c). After the stresses and strains at the old element nodes are recovered, the old deformed element that contained the coordinates of each new Gauss point is identified and the corresponding variable S at new Gauss points is then interpolated as S = NS*
(1)
where N is the shape function and S* represents the recovered variables at nodes of the old element. Application of the SPR technique requires optimal sampling points which own at least one-order higher convergence than other positions. The existence of optimal sampling points in quadratic triangular elements has not been proved in theory, however, the Gauss points were found as optimal sampling points empirically (Zienkiewicz & Zhu 1993). To mimic pipe-soil interaction during the dynamic lay process, the sequence of small strain increment, mesh regeneration and mapping is repeated until the predefined displacement has been reached. The overall scheme of the LDFE analysis is controlled by a master program written in Fortran. The mapping of field variables is carried out externally by subroutines in Fortran. ABAQUS is called by the master program to build the small strain finite element model, which is automatically implemented by a Python file prepared beforehand. Python is the built-in script language of ABAQUS (HKS 2004). Another Python file is coded to extract the necessary data from the ABAQUS result files. More detailed procedures for the RITSS method coupled with ABAQUS can be found in our previous papers (Wang et al. 2006; 2008a; 2008b). Strain-softening and rate-dependent soil model The profile of intact undrained strength, su0, for most seabed clays can be described as a linear function:
s u0 = s um + kz
(2)
where sum is the shear strength at the mudline, k is the strength gradient and z is the soil depth. The soil strength reduces during episodes of remolding. This strength reduction can be estimated by means of cyclic penetrometer tests and is quantified by a cyclic sensitivity factor, ST-bar, which is defined as the ratio of the initial downward penetration resistance to the steady value of penetration resistance reached after many cycles of movement. Numerical studies (Zhou & Randolph 2009) and field data (Yafrate et al. 2009) have shown that ST2
Copyright © 2009 by ASME
s u = ⎡δrem + (1 − δ rem ) e-3ξ ⎣
ξ95
⎤ s u0 ⎦
(3)
where δrem = 1/St; ξ denotes the accumulated absolute plastic shear strain and ξ95 represents the value of ξ at which the soil has undergone 95% of the reduction in strength due to remolding. Typical values of ξ95 are in the range of 10 – 30 (Zhou & Randolph 2007). The shear strength at the mudline is a key parameter for assessing the behaviour of on-bottom pipelines. However, the strength of the surficial soil is not easily measured in many actual applications, and the exact strength profile in the depth range relevant for pipelines is often difficult to determine. In the following LDFE studies, the soil is regarded as an elastic-perfectly plastic material obeying the Tresca yield criterion. The Young’s modulus of the two clays is taken as E = 500su, and the Poisson’s ratio is taken as 0.499 to approximate constant volume undrained conditions. The submerged unit weight of the soils is taken as γ' = 6 kN/m3. MONOTONIC PIPELINE EMBEDMENT Pipelines laid untrenched on the seabed embed more deeply than can be calculated from the self-weight alone. This is due to two factors. Firstly, the contact stress between the pipe and the soil is enhanced through the touchdown zone due to the catenary shape. Secondly, dynamic movement of the pipe during the lay process leads to disturbance of the seabed. This motion remolds the seabed soil, causing a reduction in the strength. Also, if the horizontal movement is of sufficient amplitude, the soil is pushed aside and a trench forms around the pipe. The additional penetration from remolding and trenching is principally attributed to the horizontal oscillations and also depends strongly on the pipe weight (Lund 2000; Cheuk & White 2008). Therefore, accurate assessment of the relationship between the monotonic embedment and the pipe weight forms the initial basis for any simulation of the dynamic laying response and the overall dynamic embedment process. Limit plasticity analyses have been proposed by Murff et al. (1989) and Randolph & White (2008b) to predict the embedment induced by monotonic vertical load (i.e. pipe weight). In their studies the laying process is neglected and the pipe is assumed to be wished-in-place, and the soil is modeled as a rigid plastic solid. The full penetration process and the resulting soil heave and remolding are neglected in this type of analysis. By contrast with limit plasticity analyses, the LDFE method can not only track the deformed seabed surface,
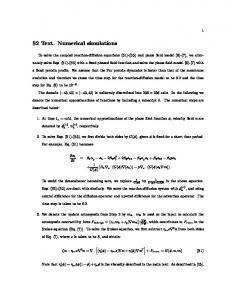
created by heave, but can also incorporate a strain softening model for the soil strength. The pipe-soil interface interaction is simulated by setting the pipe and soil surfaces as a master-slave pair. The length of contact around the pipe perimeter is permitted to vary as the pipe moves. The maximum shear stress on the pipe-soil interface is defined as τmax = αsum, where α denotes the roughness factor. A value of α = 0 corresponds to a fully smooth interface that cannot sustain shear stress. In order to confirm the effectiveness of the RITSS implementation, the monotonic penetration of a pipeline – i.e. a rigid cylinder with a horizontal axis – is first simulated under various different conditions. An intact soil strength profile of su0 = (0.75 + 1.6z) kPa (where z is in meters) and a pipe diameter of 0.8 m have been adopted, to match the centrifuge model tests back-analyzed later in this paper. This diameter is relatively large compared to field conditions, but the resulting normalized loads and embedments are typical. Strain softening of the soil is not considered in this benchmark problem. The numerical responses during monotonic penetration are compared with the upper bound solution (Randolph & White 2008b) in Fig. 1, where w represents the embedment of the pipe invert and the value of su0 at the level of the pipe invert has been used for normalization. In weightless soil (γ' = 0), the soil heaves that forms over the shoulders of the pipe does not produce a surcharge load, thus the normalized load-displacement curve from the LDFE method is very close to the theoretical solution by Randolph & White (2008b). V/s u0D 0
1
2
3
4
5
6
7
0 0.1 LDFE 0.2 α=0.2, γ'D/s um=6.4
w/D
bar is typically 20 to 40 % lower than the true sensitivity of the soil, due to partial softening during the initial penetration. A ratio of remolded to intact strength in the range 0.2 – 0.5 is typical (i.e. a true sensitivity, St, of 2 – 5). An empirical expression that is widely used to model this progressive loss of strength during remolding is (Zhou & Randolph 2007; Wang et al. 2008c)
0.3 0.4 0.5
smooth, γ'D/s um=6.4 smooth, w eightless smooth, w eightless (Randolph & White)
Figure 1. Monotonic penetration resistance (non-softening soil strength)
However, when the soil self-weight is included, the penetration resistance is significantly increased (Fig. 1). For the adopted value of submerged unit weight (γ'D/sum = 6.4), the monotonic penetration resistance of the smooth pipe is enhanced by 49% in the LDFE results compared to weightless soil at w/D = 0.5. This contrast shows that the penetration resistance may be underestimated if the surcharge loading
3
Copyright © 2009 by ASME
created from the self-weight of the soil heave is neglected, especially in softer soils for which the non-dimensional parameter γ'D/sum is higher. In contrast, the penetration resistance increases by less than 6% when the roughness factor is adjusted from α = 0 to 0.2 (Fig. 1).
stable value of H/su0D ∼ 0.9, where su0 refers to the value of the intact strength profile at the current embedment of the pipe invert. This steady value indicates that the theoretical increase in normalized lateral resistance created by the increased embedment is countered by progressive remolding of the soil.
SIMULATION OF DYNAMIC LAYING Benchmark results: centrifuge model tests The following large deformation simulations of the dynamic lay process will focus on reproducing the phenomena observed in four centrifuge model tests reported by Cheuk & White (2008). The pipe diameter was D = 0.8 m at prototype scale. Two tests were carried out in Kaolin Clay (denoted KC) and the other two in a natural high plasticity clay (denoted HP). The linear strength profiles derived from 70 deep T-bar tests conducted in these samples are shown in Table 1.
0 0.1
w/D
0.2
0.4
Table 1. Soil strength profiles in centrifuge model tests Soil sample
Kaolin Clay (KC) High plasticity clay (HP)
Mudline strength, sum 0.75 kPa 0.4 kPa
Strength gradient 1.6 kPa/m 2.5 kPa/m
Table 2. Simulated pipe weight and monotonic embedment Test identifier Pipe weight, V/sumD Monotonic embedment, w/D
KC04 1.93 0.08
KC05 3.68 0.12
0.5
Cyclic T-bar sensitivity, ST-bar 2.3 1.9
In the centrifuge, the pipe was rigidly attached to the actuator by means of a vertical load cell and a loading arm that was instrumented to measure the horizontal load applied to the pipe. The pipe was firstly penetrated into the soil under a monotonic vertical load, V, which represents a steady vertical pipe-soil contact pressure. This value was maintained constant during the sequence of horizontal displacement cycles which simulated the dynamic embedment process. The values of V and the corresponding monotonic embedment obtained for the four tests are listed in Table 2. In all tests the pipe was subjected to 40 horizontal displacement cycles of ±0.05D. This lateral amplitude was chosen to represent typical pipeline movements during laying in a modest seastate. In practice, this amplitude depends on the lay conditions and will reduce through the touchdown zone until the point at which the pipeline is at rest on the seabed.
HP06 4.53 0.10
HP07 8.16 0.22
To illustrate the typical observed behavior, the lateral resistance measured during test KC05 is compared with the accumulating pipe embedment in Fig. 2. The monotonic embedment under the imposed vertical load was only 0.12 diameters, but the pipe embedment increased rapidly during the first few cycles of horizontal motion (whilst the vertical load was held constant). The rate of embedment reduced with continued cycling, and the horizontal resistance approached a
0.3
0.6 -1
-0.5
0
0.5
1
H/su0D
Figure 2. Measured lateral resistance (test KC05) Numerical modeling: analysis parameters During horizontal oscillations, the soil may be bonded to the rear face of the pipeline due to the tensile resistance sustained through negative excess pore pressure. Alternatively, immediate breakaway may occur on the pipe-soil interface when net tension is created. The bonded contact leads to a double-sided failure mechanism. In a similar centrifuge test that simulated large-amplitude lateral displacement of a pipeline, Dingle et al. (2008) used particle image velocimetry and close range photogrammetry techniques (White et al. 2003) to capture the instantaneous velocity fields in the soil. They observed that the double-sided mechanism remained until the pipe lateral displacement exceeded 0.06D. The oscillation amplitude in this study is only 0.05D so it is reasonable to assume that there was no separation between the soil and the rear face of the pipe. This assumption appears to be confirmed by the monotonically increasing lateral resistance mobilized during each cycle, with no indication of the brittleness that would accompany breakaway at the rear of the pipe (Cheuk & White 2008). The loading mode adopted during the monotonic penetration stage was displacement-rate controlled, rather than load-controlled, so the maximum vertical load was not exactly equal to the vertical load given in Table 2, which was sustained during the cyclic phase, but the difference was less than 3.5%. The strain softening of the soil strength, as described by Equation 3, has been incorporated into the large deformation simulations to capture the role of remolding in the laying behavior. The brittleness parameter, ξ95 is taken as 10. Four simulations of test KC05 have been conducted, adopting four
4
Copyright © 2009 by ASME
0 (a) St=1
0.1
w/D
0.2 0.3 0.4 0.5 0.6 -3
-2
-1
0 H/s u0D
1
2
3
(a) St = 1 0 (b) St=2.3
0.1
w/D
0.2 0.3 0.4 0.5 0.6 -2
-1.5
-1
-0.5
0 0.5 H/s u0D
1
1.5
2
(b) St = 2.3 0 (c) St=4
0.1
w/D
0.2 0.3 0.4 0.5 0.6 -2
-1.5
-1
-0.5
0 0.5 H/s u0D
1
1.5
2
(c) St = 4 0 (d) St=5
0.1 0.2 w/D
values of the soil sensitivity, St. For test KC05 with St =1 and 2.3, the relationship between the horizontal resistance and the pipe embedment are shown in Fig. 3(a) and (b), respectively. The normalized maximum horizontal resistance, Hmax/su0D reaches 2.73 and 1.55 in these two cases. These values significantly exceed the experimental result Hmax/su0D = 0.9 (Fig. 2, and Cheuk & White 2008). This over prediction can be attributed to the T-bar test sensitivity of St = 2.3 being an underestimate of the softening of the surficial soil. This underestimation may be for two reasons: (i) under-estimation of the true soil sensitivity due to partial remolding during the initial penetration phase (Zhou & Randolph 2009, Yafrate et al. 2009), or (ii) additional loss of soil strength due to water entrainment into the near-surface soil. When cyclic T-bar tests are used to determine the sensitivity factor, the T-bar is usually cycled up and down at depth within the soil since the T-bar capacity factor is based on the fully local failure mechanism. This local mechanism cannot be mobilized if the T-bar is close to the soil surface. Although the soil at depth is fully remolded by cyclic movement of the T-bar, the event takes place in undrained conditions. Different from T-bar tests, on-bottom pipelines lay on the soil surface, where the soil has access to the free water which can be mixed with the soil during horizontal oscillations of the pipe. The surficial soil can be weakened by the increasing water content, leading to a higher apparent sensitivity than at depth. Two further analyses are shown in Fig. 3(c) and 3(d), with higher values of soil sensitivity: St = 4 and 5. In Fig. 3(a) to 3(d), all of the final values of pipe embedment after 40 cycles are close to the experimental result of w/D = 0.52, but the maximum horizontal resistance decreases with increasing sensitivity factor. In order to replicate the observed horizontal resistance accurately, the sensitivity factor found by means of a deep T-bar test needs to be modified to consider the effect of water entrainment. There is currently no established routine for capturing the changing strength of clay through this type of remolding, with a change in water content in addition to the accumulation of shear strain. In Fig. 3(c) and 3(d) the lay response is broadly consistent with the centrifuge test results (Fig. 2), but the maximum horizontal resistance Hmax/su0D = 1.22, remains approximately 35% higher than the experimental value. This discrepancy may partly be attributed to the uncertainty surrounding the sensitivity factor but it should also be noted that the interpretation of the near-surface strength profile (within the upper 10 mm of the sample) is also subject to uncertainty in the centrifuge test. The final embedment for the case of St = 4 is 0.49D, which is very slightly shallower than the value of 0.5D found for St = 2.3. The reason for greater embedment being recorded for the less sensitive soil is that the actual value of monotonic vertical load achieved numerically in the former case is ∼4% higher. As will be discussed later, the dynamic lay embedment is sensitive to monotonic vertical load.
0.3 0.4 0.5 0.6 -2
-1.5
-1
-0.5
0 0.5 H/s u0D
1
1.5
2
(d) St = 5
Figure 3. Numerical simulations of test KC-05, using different values of soil sensitivity
5
Copyright © 2009 by ASME
SOFTENING 0.95 0.90 0.86 0.81 0.77 0.72 0.68 0.63 0.59 0.54 0.50 0.45
0
1
z/D
z/D
1
-1
-2
SOFTENING 0.95 0.90 0.84 0.79 0.73 0.68 0.63 0.57 0.52 0.47 0.41 0.36 0.30 0.25
0
-1
-2
-1
0 x/D
1
2
-2
-2
-1
Prior to horizontal cycles
2
SOFTENING 0.95 0.90 0.84 0.79 0.73 0.68 0.63 0.57 0.52 0.47 0.41 0.36 0.30 0.25
1
z/D
z/D
0
1
At 30 cycle
SOFTENING 0.95 0.90 0.84 0.79 0.73 0.68 0.63 0.57 0.52 0.47 0.41 0.36 0.30 0.25
1
0 x/D
th
0
-1
-1 -2
-2
-1
0 x/D
1
2
-2
th
At 5 cycle SOFTENING 0.95 0.90 0.84 0.79 0.73 0.68 0.63 0.57 0.52 0.47 0.41 0.36 0.30 0.25
z/D
1
0
-1
-2
-2
-1
0 x/D
1
2
th
At 10 cycle SOFTENING 0.95 0.90 0.84 0.79 0.73 0.68 0.63 0.57 0.52 0.47 0.41 0.36 0.30 0.25
z/D
1
0
-1
-2
-2
-1
0 x/D
1
-2
-1
0 x/D
1
2
th
At 40 cycle
Figure 4. Distribution of remolding during lay process (KC05)
The distribution of the soil strength relative to the intact value is indicated in Fig. 4 for different stages in the analysis, with St = 4. The weakening of the soil due to the horizontal oscillations of the pipe is clearly evident. The strain softening appears around the pipe-soil interface during monotonic penetration and none of the soil is fully remolded. The softening zone extends around the shoulders of the pipe during the horizontal cycles, and the soil in the heaved zones becomes heavily remolded. These zones are pushed outwards gradually, becoming flatter. The area of the softened zone remains approximately constant after 30 cycles, which is the same stage at which the rate of pipe embedment reduced (Fig. 3(c)). The smallamplitude cycles generate a triangular ‘pool’ of softened soil, within which the soil flow mechanism becomes localized. The maximum width and depth (below the pipe invert) of the heavily remolded zone are ±1.6D and 0.2D, respectively.
2
th
At 20 cycle
6
Copyright © 2009 by ASME
0
10
Number of cycles 20
30
40
0 0.1
HP06
0.2 KC04
w/D
0.3 0.4
KC05
0.5 HP07
0.6 0.7
(a) LDFE analyses 0
10
Number of cycles 20
40
30
0 0.1
HP06
w/D
0.2 0.3
for the simulated load level, which corresponds to a monotonic embedment in the range of 0.03D to 0.19D. Any additional cycles would not significantly deepen the pipe. The steady embedment is an important concept for the assessment of dynamic embedment in practice, since it narrows down the input parameters necessary for a simplified analysis of the lay process. It may not be necessary to specify precisely the number of cycles that will be imposed during the lay process if that number is sufficient for the embedment to approach the steady value. The final embedment from the centrifuge tests and the numerical simulations are compared in Table 3. The embedment depths predicted by the LDFE approach are smaller than the measured values, but the average discrepancy is less than 10%. The numerical error for the HP tests is higher than for the KC tests. This may be due to two reasons: (1) the surficial strength of HP profile may not have been assessed accurately, (2) an additional reduction in strength due to water entrainment during the remolding process is not incorporated accurately within the sensitivity factor adopted in the LDFE analyses.
KC04
0.4 0.5 0.6
Table 3. Comparison of final embedment ratio, w/D Test identifier KC04 KC05 HP06 HP07 Centrifuge model 0.34 0.52 0.44 0.70
KC05 HP07
0.7
LDFE analyses
0.33
0.49
0.37
0.63
(b) Centrifuge test results (Cheuk & White 2008)
Difference (%)
2.9
5.8
15.9
10.0
Figure 5. Cyclic evolution of pipe embedment Comparison with experimental data The evolution of pipe embedment found by the LDFE method is compared with the experimental data in Fig. 5. A sensitivity factor of St = 4 has been adopted for both clays in these LDFE analyses, which used values of pipe weight and intact strength profiles that replicated all four centrifuge tests reported by Cheuk & White (2008). The pipes penetrate rapidly during the first 10 horizontal cycles in the LDFE analyses. The ratios of the dynamic embedment after 10 cycles to the final dynamic embedment are 74% (HP06), 66% (HP07), 65% (KC04) and 77% (KC05), respectively. In particular, the first five cycles can triple (KC04, KC05) or double (HP06, HP07) the monotonic embedment. In contrast, the final 10 of the 40 cycles give rise to only a slight increase in embedment. For example, the embedment increment of KC05 is 0.006D, about 1.5% of the final dynamic embedment. Similar results are apparent from the centrifuge model tests. Compared with the numerical results, the initial rate of embedment is slightly less rapid, and the rate of embedment during the final cycles is slightly higher. For the horizontal cyclic displacement of ±0.05D, all pipes approached a steady embedment after 30 cycles, at least
Parametric study of the effect of pipe weight A final set of analyses were conducted to explore in more detail the effect of pipe weight on the dynamic embedment behavior. Fig. 6 shows the accumulation of embedment with displacement cycles of ±0.05D under different monotonic vertical loads, ranging from V/sumD = 0.98 up to V/sumD = 3.56. The markers show the pipe embedment at the end of each cycle. In each case, the pipe is monotonically penetrated to the specified vertical load then is cycled with a horizontal displacement of ±0.05D on soil with the KC strength profile (Table 1), using a sensitivity of St = 4. The dynamic embedment is significantly affected by the monotonic vertical load. In normalized vertical load– embedment space, the responses move downwards from the monotonic embedment curve. The shape of these curves arises from the changing intact soil strength with depth. The vertical load, V, was held constant during the dynamic movement. The embedment achieved after 40 cycles of lateral movement exceeds the embedment under the same monotonic vertical load by a factor of 28 for the lowest vertical load case (V/sumD = 0.98) but by a factor of only 4 for the highest load case (V/sumD = 3.56). This ratio between the static and dynamic embedment is commonly termed the dynamic embedment factor, fdyn (Bruton et al. 2006), but does not
7
Copyright © 2009 by ASME
appear to give a consistent multiplicative factor to capture the effect of the same dynamic motion on pipes of differing weight. A better strategy for describing the additional embedment created by the dynamic motion is to compare the dynamic embedment (which arises from remolding of the soil) with the monotonic embedment that would result from the soil initially being in the full remolded state. The monotonic penetration resistance from an LDFE analysis based on a non-softening soil model using the fully-remolded strength profile (i.e. the intact strength divided by St = 4) is shown dotted in Fig. 6. The dynamic embedment reached after the cyclic phases is comparable to the monotonic embedment in the fully softened soil under a vertical load which is approximately 0.5 – 2.0 times higher (length OA′ vs. OA).
0
1
2
V/s u0D 3
4
5
6
0 Monotonic embedment
0.1
w/D
0.2 0.3 0.4 0.5 0.6 0.7
O
A' A Monotonic embedment in fully-remoulded soil
Figure 6. Cyclic accumulation of embedment for different values of pipe weight
This observation is consistent with an interpretation that links the steady embedment during dynamic motion to the parallel point of the corresponding theoretical failure envelope in vertical-horizontal load space. The parallel point is the vertical load level at which the trajectory of pipe movement at failure under horizontal load is purely horizontal (i.e. the pipe has no tendency to rise or fall), according to a flow rule based on normality, combined with failure envelopes derived from plasticity limit analysis. This approach is explored in more detail by Cheuk & White (2009). Based on these observations, it may be possible to improve the prediction of dynamic pipeline embedment by adopting the remolded rather than intact soil strength in embedment calculations, and by assuming that the soil reaches a lateral failure condition during laying. CONCLUSIONS Pipelines laid on the seabed usually embed more deeply than indicated by static penetration calculations due to the dynamic motion as the pipe touches down – particularly horizontal oscillations. Conventional small strain finite element methods cannot simulate the pipe lay process since the mesh in the
vicinity of the pipe becomes grossly distorted, and the loss of soil strength through heavy remolding cannot be captured. A large deformation method, RITSS, based on mesh regeneration, was developed to investigate pipe-soil interaction under complex pipe movements. A strain softening soil model was incorporated into RITSS to capture the soil remolding during dynamic pipe laying. The robustness of the large deformation method is verified by comparison with an upper bound solution for monotonic penetration of cylindrical objects such as pipelines. LDFE studies of dynamic pipeline laying, were conducted to replicate the behavior observed in centrifuge model tests of this process. The basic form of the tests and simulations is for the pipe to be initially embedded monotonically to a specified vertical load (or simulated weight), before many cycles of small amplitude lateral displacement (±0.05D) are imposed, to represent the dynamic effect. From comparison of the two sets of simulations, it was found that the sensitivity factor of the soil may be underestimated by cyclic T-bar tests in deep soil, since additional water becomes entrained in the soil with oscillations of the pipe. The soil is then softened due to both the remolding effect of accumulated shear strain and also increasing water content. The lower lateral resistance encountered in the centrifuge test compared to the LDFE is attributed to this mechanism. To achieve closer agreement, the impact of the water content on the soil strength is captured in a simple manner by increasing the sensitivity factor. It is shown that the steady dynamic embedment is less affected by the sensitivity factor, compared to the horizontal resistance, which decreases as the sensitivity factor is raised. For pipes in kaolin clay and the offshore high plasticity clay simulated here, the numerical evolution of pipe embedment agrees well with the test data. When small amplitude lateral cycles are imposed on the pipe, the embedment increases rapidly within the first 5 cycles, with the embedment exceeding the monotonic value by a factor of 2 to 3. For a horizontal amplitude of 0.05D, an approximately steady embedment was reached in all cases at 30 cycles. At this stage, the LDFE analyses show that a softened zone had formed around the pipe and remained largely unchanged with subsequent cycles. Overall, the LDFE method has shown good potential for simulating the dynamic embedment of seabed pipelines. ACKNOWLEDGEMENTS This work forms part of the activities of the Centre for Offshore Foundation System at UWA, which was established under the Australian Research Council’s Special Research Centre scheme and is now supported by the State Government of Western Australia through the Centre of Excellence in Science and Innovation program. This financial support is gratefully acknowledged.
8
Copyright © 2009 by ASME
REFERENCES Bruton, D. A. S., Carr, M. C. and White, D. J. (2007). The influence of pipe-soil interaction on lateral buckling and walking of pipelines: the SAFEBUCK JIP. Proceedings of 6th International Conference on Offshore Site Investigation and Geotechnics, London, 133-150. Bruton, D. A. S., White, D. J., Cheuk, C. Y., Bolton, M. D. and Carr, M. C. (2006). Pipe-soil interaction behaviour during lateral buckling, including large amplitude cyclic displacement tests by the SAFEBUCK JIP. Proceedings of Offshore Technology Conference, OTC17944. Cheuk, C. Y. and White, D. J. (2008). Centrifuge modelling of pipe penetration due to dynamic lay effects. Proceedings of 27th International Conference on Offshore Mechanics and Arctic Engineering, OMAE2008-57923. Cheuk, C. Y. and White D. J. (2009). Modelling the dynamic embedment of seabed pipelines. Géotechnique. submitted December 2008, in review. Dingle, H. R. C., White, D. J. and Gaudin, C. (2008). Mechanisms of pipe embedment and lateral breakout on soft clay. Canadian Geotechnical Journal, 45: 636652. HKS (2004). ABAQUS Users’ Manual, Version 6.5, Hibbit, Karlsson and Sorensen, Inc. Hu, Y. and Randolph, M. F. (1998). A practical numerical approach for large deformation problem in soil. International Journal for Numerical and Analytical Methods in Geomechanics, 22(5): 327-350. Lund, K. H. (2000). Effect of increase in pipeline soil penetration from installation. Proceedings of International Conference on Offshore Mechanics and Arctic Engineering, New Orleans, OMAE2000PIPE5047 Murff, J. D., Wagner, D. A and Randolph, M. F. (1989). Pipe penetration in cohesive soil. Géotechnique, 39(2), 213229. Randolph, M. F., Wang, D., Zhou, H., Hossain, M. S., and Hu, Y. (2008). Large deformation finite element analysis for offshore applications. Proceedings of 12th International Conference of International Association for Computer Methods and Advances in Geomechanics, 3307-3318. Randolph M. F. and White D. J. (2008a). Pipeline embedment in deep water: processes and quantitative assessment. Proceedings of Offshore Technology Conference, Houston, USA. Paper OTC19128. Randolph, M. F. and White, D. J. (2008b). Upper-bound yield envelopes for pipelines at shallow embedment in clay. Géotechnique, 58(4): 297-301. Wang, D., Hu, Y. and Jin, X. (2006). Two-dimensional large deformation finite element analysis for the pulling-up
of plate anchor. China Ocean Engineering, 20(2): 269279. Wang, D., Hu, Y. and Randolph, M. F. (2008a). Threedimensional large deformation analyses of plate anchor keying in clay. Proceedings of 27th International Conference on Offshore Mechanics and Arctic Engineering, OMAE2008-57218. Wang, D., Hu, Y. and Randolph, M. F. (2008b). Effect of loading rate on the uplift capacity of plate anchors. Proceedings of the 18th International Offshore and Polar Engineering Conference, 2: 727-731. Wang, D., White, D. J. and Randolph, M. F. (2008c). Large deformation finite element analysis of pipe penetration and large-amplitude lateral displacement. Submitted to Canadian Geotechnical Journal, September 2008. White, D. J., Take, W. A. and Bolton, M. D. (2003). Soil deformation measurement using Particle Image Velocimetry (PIV) and photogrammetry. Géotechnique, 53(7): 619-631. Yafrate, N., DeJong, J., DeGroot, D. and Randolph, M. F. (2009). Assessment of remolded shear strength in soft clay with full flow penetrometers. Journal of Geotechnical and Geoenvironmental Engineering, ASCE (under review, revised October 2008). Zhou, H. and Randolph, M. F. (2007) Computational techniques and shear band development for cylindrical and spherical penetrometers in strain-softening clay. International Journal of Geomechanics, 7(4): 287-295. Zhou, H. and Randolph, M. F. (2009). Numerical investigations into cycling of full-flow penetrometers in soft clay. Géotechnique (accepted December 2008). Zienkiewicz, O. C. and Zhu, J. Z. (1993). The superconvergent patch recovery and a posteriori error estimates. Part 1: The recovery technique. International Journal for Numerical Methods in Engineering, 33: 1331-1364.
9
Copyright © 2009 by ASME