OCT Fluid Segmentation using Graph Shortest Path and Convolutional Neural Network* Abdolreza Rashno1 , Dara D. Koozekanani2 and Keshab K. Parhi3 Abstract— Diagnosis and monitoring of retina diseases related to pathologies such as accumulated fluid can be performed using optical coherence tomography (OCT). OCT acquires a series of 2D slices (Bscans). This work presents a fullyautomated method based on graph shortest path algorithms and convolutional neural network (CNN) to segment and detect three types of fluid including sub-retinal fluid (SRF), intraretinal fluid (IRF) and pigment epithelium detachment (PED) in OCT Bscans of subjects with age-related macular degeneration (AMD) and retinal vein occlusion (RVO) or diabetic retinopathy. The proposed method achieves an average dice coefficient of 76.44%, 92.25% and 82.14% in Cirrus, Spectralis and Topcon datasets, respectively. The effectiveness of the proposed methods was also demonstrated in segmenting fluid in OCT images from the 2017 Retouch challenge.
I. I NTRODUCTION Optical coherence tomography (OCT) is a non-invasive and non-contact imaging method with extensive clinical use in ophthalmology. It uses optical technology to create tomographic images with variable scan rates and resolutions, and is used to create cross-sectional images of ocular tissues, including the retina [1]. It is extensively used clinically for the diagnosis and follow-up of patients with retinal vein occlusion (RVO) and age-related macular degeneration (AMD) [2]. The macula is the central part of the retina and is critical for good vision. RVO, manifested by fluid cysts within the retina and retinal thickening, is caused by fluid leakage from damaged macular blood vessels. This causes vision loss and is the most common cause of vision loss among working-aged adults in the United States. OCT images allow very sensitive detection and quantitative assessment of these fluid cysts and retinal thickening [4], [6], [7]. AMD is characterized by the growth of abnormal blood vessels from the choroidal vasculature, and the resultant fluid leakage into the intra-retinal, sub-retinal, and sub-retinal pigment epithelium (RPE) spaces. The standard treatment for this condition is guided by the presence and quantity of this fluid [5]. The fluid quantity cannot be routinely measured in clinical practice because commercial algorithms do not *This research was supported in part by the Minnesota Lions Foundation under grant UMF14601 and by the Research to Prevent Blindness. 1 Abdolreza Rashno is with the Department of Computer Engineering, Engineering Faculty, Lorestan University, Khorramabad, Iran.
[email protected] 2 Dara D. Koozekanani is with the Department of Ophthalmology and Visual Neurosciences, University of Minnesota, Minneapolis, MN 55455 USA
[email protected] 3 Keshab K. Parhi is with the Department of Electrical and Computer Engineering, University of Minnesota, Minneapolis, MN 55455, USA
[email protected]
directly detect fluid. Some state of the art methods for fluid segmentation in AMD and RVO subjects were proposed in [8]–[14]. Recently, we have developed fully-automated methods for fluid segmentation in AMD and diabetic macular edema (DME) subjects based on neutrosophic theory and graph cut methods followed by the evaluation of clinical importance of fluid regions [2]–[6]. In this work, a fully-automated method is presented for the segmentation of three types of fluid including intra-retinal fluid (IRF), sub-retinal fluid (SRF) and pigment epithelial detachment (PED). In the first step, inner limiting membrane (ILM) and retinal pigment epithelium (RPE) layers are segmented by graph shortest path methods. Then, the regions between these layers are input to a convolutional neural network (CNN). The CNN is trained for binary classification of pixels between ILM and RPE. In this application, both IRF and SRF fluids are considered as object and tissue is considered as background. Finally, PED is segmented by the proposed method based on layer segmentation and layer flattening. The rest of this paper is organized as follows. Section 2 presents the proposed methodology with subsections including layer segmentation, PED segmentation with layer flattening, IRF and SRF segmentation with CNN, and fluid detection. Experimental results are presented in Section 3. Segmentation results are presented in Section 4. Finally, conclusion is described in Section 5. II. P ROPOSED M ETHODS The main contribution of this work is to segment and detect IRF, SRF and PED. IRF and SRF are located between ILM and RPE layers while PED is underneath RPE. The important property of IRF and SRF is that these fluid types stem from abnormal blood vessels leakage from the choroidal and retinal vasculature, and the resultant dark region. In PED fluid may or may not exist. In patients with early AMD, PED is the result of RPE elevation and fluid does not exist while in severe AMD RPE is elevated by fluid regions. The proposed approaches for fluid segmentation are in agreement with the mentioned properties of fluid regions. For IRF and SRF, a supervised method based on CNN is trained. PED is computed by the flattening of RPE which means that the elevated RPE is flattened and then the elevation of RPE is computed. It is not affected by the texture of PED. Therefore, both non-fluid PED and fluid PED can be segmented by this method.
A. Layer Segmentation The first step of the proposed method is the segmentation of ILM and RPE layers as a ROI for IRF and SRF regions. This step is very important due to two aspects. First, the background region is very similar to fluid/cyst regions in both brightness and texture. This can easily mislead the CNN segmentation method since this method is based on brightness of neighboring pixels of target pixel. The second reason for ROI segmentation is speeding up since the ROI is processed instead of the whole image. Therefore, ROI is presented in the training and testing phases of CNN. For layer segmentation, the graph is constructed from each OCT Bscan by mapping each pixel in the image to one node in a graph. We only consider the local relationship between pixels. Therefore, by considering the local relationship for 8 neighbors of each pixel, the 8-regular graph is constructed. For ILM segmentation, the image is first filtered with a vertical gradient filter and then the weight computation between any two arbitrary pixels (a1 , b1 ) and (a2 , b2 ) is defined by (1): W ((a1 , b1 ), (a2 , b2 )) = 10 ∗ M axG − V erGrad(a1 , b1 ) − V erGrad(a2 , b2 ) + 2 ∗ mean(R) (1) where M axG is the maximum gray level of the image and R is a set of R pixels above (a1 , b1 ). In this work, R is set to 10 based on experiments. In (1), suppose that there are pixels in other layers with the maximum vertical gradient V erGrad(a1 , b1 ). These pixels are good candidates to mislead the graph shortest path because of their low weights in the graph. For pixels in ILM, the term 2∗mean(R) is almost zero since R is a set of pixels in background. For NonILM pixels, R is a set of pixels in retina tissue. Therefore: 2 ∗ mean(RILM ) < 2 ∗ mean(RN onILM )
(2)
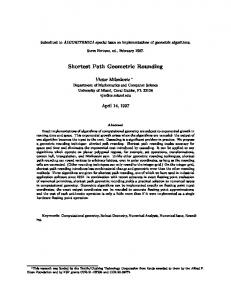
Fig. 1: Two samples of ILM and RPE segmentation results.
B. PED segmentation with Layer flattening As it was mentioned before, PED cannot be segmented based on pixel intensities since in early AMD there is no fluid in PED while in severe AMD fluid exists. The proposed method for PED segmentation is to flatten the elevated RPE and compute the region between the flattened RPE and the elevated RPE. Segmented RPE in the previous section is the elevated RPE. To flatten RPE, first all pixels in RPE are considered as a vector in which RP E(i) is the height of ith pixel in RPE. When the RPE is elevated, a pick (or picks) are created. This pick is determined as a point with the maximum curvature. Then, the left and right sides where the curve begins and ends are found. Finally, left and right sides are connected by 1D linear interpolation which leads to the flattened RPE. Two samples of the flattened RPE results are shown in Fig. 1. C. IRF and SRF segmentation with CNN IRF and SRF fluid types are located between ILM and elevated RPE. Here, IRF and SRF segmentation are modeled as a supervised classification task in which fluid (IRF and SRF) and tissue pixels are labeled as 1 and 0, respectively. Therefore, a CNN is trained for binary classification. It may be noted that in this step, both fluid types are classified as fluid. The type of fluid is determined based on Algorithm 1.
Furthermore Algorithm 1 IRF and SRF Labeling. 10 ∗ M axG − V erGrad(a1 , b1 ) − V erGrad(a2 , b2 ) + 2 ∗ mean(RILM ) < 10 ∗ M axG − V erGrad(a1 , b1 ) (3) − V erGrad(a2 , b2 ) + 2 ∗ mean(RN onILM ) Therefore, WILM ((a1 , b1 ), (a2 , b2 )) < WN onILM ((a1 , b1 ), (a2 , b2 )) (4) Therefore, it is unlikely that the graph shortest path method will be misled by NonIM pixels. The procedure for the segmentation of RPE is that the vertical gradient is multiplied by -1 and R corresponds to a set of D pixels under (a1, b1). Weight computation between any two arbitrary pixels is defined by (5): W ((a1 , b1 ), (a2 , b2 )) = 4 ∗ M axG − V erGrad(a1 , b1 ) − V erGrad(a2 , b2 ) − mean(R) (5)
1: 2: 3: 4: 5: 6: 7:
8: 9: 10: 11: 12:
Inputs: Binary segmented image by CNN: SegBscan (fluid=1, tissue=0), Trshld=40. Output:Labeled fluid pixels as IRF or SRF. Find all connected components in SegBscan and save them in CCom. for i=1:length(CCom) do CC = CCom(i) for j = 1: length(CC) do . ?All pixels in CC Find the vertical distance of pixel j from the segmented elevated RPE (without flattening) and save it in dist(j) M inDist = min(dist) if M inDist < T rshld then Label all pixels in CC as SRF . else Label all pixels in CC as IRF . End.
D. Fluid Detection Another contribution of this paper is fluid detection. For each Bscan, probabilities of the existence of IRF, SRF and PED are computed. In the next step, these probabilities are computed for each OCT volume. In this work, the probability of IRF, SRF and PED are computed by thresholding. Therefore, a binary value is assigned for each Bscan which means that this Bscan may or may not contain fluid. For each fluid type in a Bscan, T rIRF = 110, RtSRF = 180 and T rP ED = 85 are considered as thresholds for IRF, SRF and PED detection, respectively. If the number of segmented pixels for each fluid type is more than the corresponding threshold this probability is 1, otherwise it is 0. E. CNN architecture The CNN is applied to each Bscan separately. For this task, each pixel is windowed by a [10 10] window of its neighbors. Then, these windows are input to the CNN. Therefore, each pixel is labeled as fluid or tissue by its 100 neighbors. The architecture of CNN is as follows: First Layer: Convolution layer: number of feature maps=10, size of kernels=[3 3], activation function=rect. Second Layer: Pooling layer: sub sample rate=2, sub sample method=mean. Third layer: Fully-connected layer: number of nodes=150, activation function=tanh. Fourth layer: Fully-connected layer: number of nodes=2, activation function=tanh. Fig. 2 shows the proposed structure of CNN for fluid segmentation. The procedure to select training pixels for CNN is as follows: Consider a fluid pixel in training set; three properties including pixel intensity, average and standard deviation of the intensity of neighboring pixels are considered for this pixel. In the next step, all fluid pixels which have the properties similar to this pixel are removed from training set. Finally, a tissue pixel set with the same size of fluid pixel set is selected from tissue pixels randomly. This approach decreases the size of the training set significantly since the majority of fluid pixels have the same behavior with respect to the three mentioned properties. On th other hand, ignoring such fluid pixels does not affect the performance of CNN in classification. III. E XPERIMENTAL RESULTS We have used the dataset in RETOUCH fluid segmentation challenge including a total of 112 macula-centered OCT volumes of 112 patients1 [15]. The experimental procedures involving human subjects described in this paper were approved by the Institutional Review Board. Half of the patients had macular edema secondary to AMD and half of them had edema secondary to RVO. OCT volumes were acquired with spectral-domain SD-OCT devices from three different vendors: Cirrus HD-OCT (Zeiss Meditec), Spectralis (Heidelberg Engineering), and T-1000/T- 2000 (Topcon). To evaluate the proposed algorithms, released training data are divided 1 https://retouch.grand-challenge.org
TABLE I: Dice Cofficient for IRF, SRF and PED segmentation in Cirrus, Spectralis and Topcon datasets. Dimension # of Train Bscans for IRF and SRF # of Train Bscans for PED # of Test Bscans IRF SRF PED Average
Cirrus 1024x512
Spectralis 496x512
Topcon 885x512
2048
784
2048
0
0
0
1024 78.45 69.74 81.13 76.44
392 96.24 94.53 85.98 92.25
1024 81.65 79.64 85.13 82.14
into 2 groups, training and validation sets. The training set contains 24 volumes from three manufacturers. For each manufacturer, 16 volumes are considered as training set and 8 volumes as validation set. PED segmentation is performed by the proposed layer segmentation and layer flattening methods. Therefore, it does not need a training set and can be applied in each OCT scan in an unsupervised manner. For IRF and SRF segmentation, three CNNs are constructed and trained for the OCT Bscans of each manufacturer. In each CNN, 16 OCT volumes of each manufacturer are used in training step and remaining 8 OCT volumes are used for evaluation. IV. S EGMENTATION RESULTS Proposed methods for layer segmentation and layer flattening are combined with the proposed CNN architecture to segment all pixels in each Bscan as IRF, SRF, PED and tissue. Fig. 3 shows two samples of the segmented Bscans in Spectralis dataset. Also, Fig. 4 shows two samples of the segmented Bscans from Cirrus and Topcon datasets with IRF, SRF and PED. In these examples, proposed methods segment SRF, IRF and PED as shown in red, yellow and cyan colors, respectively. Table 1 reports the average Dice coefficients of all Bscans in the test set. The proposed method achieves on average 76.44%, 92.25% and 82.14% of Dice coefficients in Cirrus, Spectralis and Topcon datasets, respectively. Note that these numbers are the average Dice coefficients in the segmentation of IRF, SRF and PED. V. C ONCLUSION This paper presented a fully-automated method to segment and detect three types of fluid including IRF, SRF and PED in OCT volumes from subjects with AMD and RVO. The proposed method is based on graph shortest path methods for layer segmentation and flattening and CNN for pixel classification. IRF and SRF are classified as fluid or tissue by CNN and an algorithm is proposed for IRF and SRF labeling. PED is segmented by flattened RPE and elevated RPE. Results show the ability of the proposed method in the segmentation of three fluid types for different manufacturers. The effectiveness of the proposed methods was also demonstrated in segmenting fluid in OCT images from the 2017 Retouch challenge, obtaining simultaneously the first position in these metrics: dice cofficients of PED
Fig. 2: Proposed structure of CNN for fluid segmentation.
[4]
[5]
Fig. 3: Two samples of the segmented Bscans in Spectralis dataset. (a): SRF, (b): PED [6]
[7] [8]
Fig. 4: Two samples of the segmented Bscans. (a): A Bscan from Cirrus dataset with SRF and PED, (b): A Bscan from Topcon dataset with IRF. segmentation in Topcon and Cirrus datasets, absolute volume difference (AVD) in PED segmentation in the Cirrus dataset and SRF segmentation in Spectralis and Topcon datasets. Furthermore, the use of the proposed approach enabled the authors (UMN team) to garner the overall second position in the Retouch challenge among all metrics. Future efforts will be directed towards fine-tuning the CNN to achieve better results especially in Cirrus dataset with low signal to noise ratio. Finally, reproducibility studies between segmentation following repeat imaging can be addressed as another future work.
[9]
[10]
[11]
[12]
[13]
R EFERENCES [1] R. Kafieh, H. Rabbani, M. D. Abramoff, and M. Sonka, “Intra-retinal layer segmentation of 3d optical coherence tomography using coarse grained diffusion map,” Medical image analysis, vol. 17, no. 8, pp. 907–928, 2013. [2] A. Rashno, D. D. Koozekanani, P. Drayna, B. Nazari, S. Sadri, H. Rabbani and K. K. Parhi, “Fully-Automated Segmentation of Fluid/Cyst Regions in Optical Coherence Tomography Images with Diabetic Macular Edema using Neutrosophic Sets and Graph Algorithms,” IEEE Transactions on Biomedical Engineering, 2017. [3] A. Rashno, B. Nazari, D. D. Koozekanani, P. Drayna, S. Sadri, H. Rabbani and K. K. Parhi, “Fully-automated segmentation of fluid regions in exudative age-related macular degeneration subjects: Kernel
[14]
[15]
graph cut in neutrosophic domain,” PloS one,vol. 12, no. 10, pp. e0186949, 2017. K. K. Parhi, A. Rashno, B. Nazari, S. Sadri, H. Rabbani, P. Drayna, and D. D. Koozekanani, “Automated fluid/cyst segmentation: A quantitative assessment of diabetic macular edema,” Investigative Ophthalmology & Visual Science, vol. 58, no. 8, pp. 4633–4633, 2017. A. Rashno, K. K. Parhi, B. Nazari, S. Sadri, H. Rabbani, P. Drayna, and D. D. Koozekanani, “Automated intra-retinal, sub-retinal and sub-rpe cyst regions segmentation in age-related macular degeneration (amd) subjects,” Investigative Ophthalmology & Visual Science, vol. 58, no. 8, pp. 397–397, 2017. J. Kohler, A. Rashno, K. K. Parhi, P. Drayna, S. Radwan, and D. D. Koozekanani, “Correlation between initial vision and vision improvement with automatically calculated retinal cyst volume in treated dme after resolution,” Investigative Ophthalmology & Visual Science, vol. 58, no. 8, pp. 953–953, 2017. F. Mohammad, J. Wanek, R. Zelkha, J. I. Lim, J. Chen, and M. Shahidi, “A method for en face OCT imaging of subretinal fluid in age-related macular degeneration,” Journal of ophthalmology, 2014. S. J. Chiu, M. J. Allingham, P. S. Mettu, S. W. Cousins, J. A. Izatt, and S. Farsiu, “Kernel regression based segmentation of optical coherence tomography images with diabetic macular edema,” Biomedical optics express, vol. 6, no. 4, pp. 1172–1194, 2015. T. Wang, Z. Ji, Q. Sun, Q. Chen, S. Yu, W. Fan, S. Yuan, and Q. Liu, “Label propagation and higher-order constraint-based segmentation of fluid-associated regions in retinal sd-oct images,” Information Sciences, vol. 358, pp. 92–111, 2016. M. Wu, Q. Chen, X. He, P. Li, W. Fan, S. Yuan, and H. Park, “Automatic subretinal fluid segmentation of retinal sd-oct images with neurosensory retinal detachment guided by enface fundus imaging,” IEEE Transactions on Biomedical Engineering, 2017. A. Montuoro, S. M. Waldstein, B. S. Gerendas, U. Schmidt-Erfurth, and H. Bogunovi´c, “Joint retinal layer and fluid segmentation in oct scans of eyes with severe macular edema using unsupervised representation and auto-context,” Biomedical Optics Express, vol. 8, no. 3, pp. 1874–1888, 2017. A. G. Roy, S. Conjeti, S. P. K. Karri, D. Sheet, A. Katouzian, C. Wachinger, and N. Navab, “Relaynet: Retinal layer and fluid segmentation of macular optical coherence tomography using fully convolutional network,” arXiv preprint arXiv:1704.02161, 2017. T. Schlegl, S. M. Waldstein, H. Bogunovic, F. Endstraßer, A. Sadeghipour, A. Philip, D. Podkowinski, B. S. Gerendas, G. Langs and U. Schmidt-Erfurth, “Fully Automated Detection and Quantification of Macular Fluid in OCT Using Deep Learning,” Ophthalmology, vol. 125, no. 4, pp. 549-558, 2017. C. Farinha, T. Santos, I. P. Marques, J. P. Marques, L. Ribeiro, J. Figueira, R. Silva, and J. Cunha-Vaz, “OCT-Leakage Mapping: A New Automated Method of OCT Data Analysis to Identify and Locate Abnormal Fluid in Retinal Edema,” Ophthalmology Retina, vol. 1, no. 6, pp. 486–496, 2017. A. Rashno, D. D. Koozekanani, and K. K. Parhi, “Detection and segmentation of various types of fluids with graph shortest path and deep learning approaches,” in Proc. MICCAI Retinal OCT Fluid Challenge (RETOUCH), Sep. 2017.