not made or distributed for profit or commercial advantage and that copies bear this .... issue of exploiting asymmetric
On Exploiting Asymmetric Wireless Links via One-way Estimation Lifeng Sang
Anish Arora
Hongwei Zhang
Department of Computer Science and Engineering The Ohio State University
Department of Computer Science and Engineering The Ohio State University
Department of Computer Science Wayne State University
[email protected]
[email protected]
[email protected]
ABSTRACT A substantial percentage of links in wireless networks, especially low-power ones, is asymmetric. For the low-quality direction of asymmetric links, we observe based on testbed experiments that the reliability of synchronous acknowledgments is considerably higher than that of asynchronous messages. Thus the norm of estimating link quality in both directions via asynchronous beacons such as in ETX-based routing potentially underestimates the link reliability of asymmetric links. This leads us to investigate how to exploit asymmetric links in order to improve network functions such as convergecast routing in sensor networks via one-way link estimation. We propose a new one-way link metric ETF (for the expected number of transmissions over forward links) and present a local procedure for its estimation. We use ETF to identify high reliability forward links and use dynamic retransmission thresholding for error control and observe an improvement in convergecast routing over ETX. This is quantified with experimental testbed results with respect to reliability, number of transmissions per packet, latency, duplicates and average hops. We also study the comparative performance improvement of ETF over ETX when no special mechanism is employed to discover asymmetric links. Categories: Network Protocols General Terms: Algorithm, Performance, Design, Implementation Keywords: Sensor Network, Link Estimation, Routing
1.
INTRODUCTION
The bidirectional link model has been widely adopted in designing routing protocols for wireless networks [7, 19, 15, 11, 6, 16, 20]. Most routing metrics, such as ETX (for expected number of transmissions), evaluate the quality of a link based on its quality in both directions [7]. Due to variations in radio hardware, transmission power, interference,
Permission to make digital or hard copies of all or part of this work for personal or classroom use is granted without fee provided that copies are not made or distributed for profit or commercial advantage and that copies bear this notice and the full citation on the first page. To copy otherwise, to republish, to post on servers or to redistribute to lists, requires prior specific permission and/or a fee. MobiHoc’07, September 9–14, 2007, Montréal, Québec, Canada. Copyright 2007 ACM 978-1-59593-684-4/07/0009 ...$5.00.
and environmental factors, however, a substantial percentage of links in wireless networks, especially low-power ones, are asymmetric. Selecting links based on bidirectional quality eliminates asymmetric links and so discounts a potential resource. For example, consider a case in which source A has two routes to destination B: in one route the link reliability is 50% in both directions while in the other route the link reliability is 100% in the links towards B but 0% in the links towards A. ETX will favor the first route despite the fact that the second is better for moving data from A to B. Ignoring asymmetric links can also lead to network disconnection if these links happen to be the cut set of the network [18]. So it is desirable to exploit asymmetric links for both the performance and the basic connectivity of wireless networks. Asynchronous-beacon based link estimation in bidirectional metric-based routing protocols further exacerbates the problem. As we will show in Section 4, the reliability of synchronous acknowledgments in the low quality direction of asymmetric links is considerably higher than that of asynchronous messages. Since link estimation is usually based on periodic exchange of asynchronous messages among neighbors, the actual link quality may well be underestimated in those protocols using bidirectional routing metrics. This error of underestimating link quality can also degrade network performance, because potential good links may not be discovered. Contributions of the paper. To address these issues, we propose a one-way routing metric ETF (for the expected number of transmissions over forward links) to exploit asymmetric links for improved network performance. In ETF, the quality of an outgoing link from a node is solely based on its forward quality, towards the destination. To justify the potential benefits of exploiting asymmetric links in routing, we analyze the physical length and stability properties of asymmetric links, and we find that most asymmetric links, especially those with high and stable forward reliability, are longer than symmetric links. We also experimentally evaluate the reliability of synchronous acks and asynchronous messages, and find that the transmission of asynchronous messages is much less reliable than that of synchronous acks, especially in the presence of interference. To enable ETF-based routing, we address the following two challenges posed by link asymmetry: • Link discovery. One challenge of link asymmetry is how a node detects asymmetric links that have good forward reliability but poor backward reliability. For
instance, if the link from a node A to its neighbor B has very good reliability, then B can detect this by calculating the ratio of beacons that are successfully delivered over link A → B. But if the backward reliability from B to A is very low, then B cannot inform A of the high quality of link A → B. To address this challenge, we design a simple yet effective mechanism where nodes in a neighborhood collaborate with one another to relay link estimation information for asymmetric links. • Error control. Another challenge of link asymmetry is how to deal with ack loss (especially for asymmetric links with low backward reliability) which, if not handled correctly, will cause unnecessary retransmissions. To address this challenge, we design a simple mechanism that adapts the maximum number of allowable per-hop retransmissions to the forward link reliability, to ensure reliable packet delivery while reducing the number of unnecessary retransmissions at the same time. Using a high fidelity sensor network testbed, realistic eventdriven sensor network traffic trace, and synthesized periodic traffic, we run experiments to quantify the improvement in routing performance of ETF-based approach as compared with ETX-based routing. We find that exploiting asymmetric links in routing via ETF significantly improves the reliability and reduces the number of transmissions, latency, number of duplicate packets, and average routing hops in data delivery. Organization of the paper. In Section 2, we briefly review the literature that is closely related to this paper. In Section 3 and 4, we investigate in detail link asymmetry and the reliability of synchronous acks, which justify the effort of exploiting asymmetric links. Then, we present ETF, asymmetric-link discovery, and dynamic retransmission thresholding in Section 5. Finally, we present our experimental results in Section 6 and make concluding remarks in Section 7.
2.
RELATED WORK
Several experimental study have shown that wireless links can be asymmetric and that link asymmetry can negatively impact network performance [21, 17, 12, 14, 13]. In consequence, one common approach is to avoid using asymmetric links in routing for wireless networks. This is reflected in many existing routing metrics and protocols that have been adopted in the community. To the best of our knowledge, there has not been any work that systematically studies the issue of exploiting asymmetric links in wireless networks, especially for convergecast routing in wireless sensor networks. Based on the observations that wireless links tend to be dynamic, unreliable, and asymmetric [4, 21, 13], various routing metrics have been proposed to estimate wireless link quality. For instance, end-to-end success rate (SR) [11], round trip time (RTT) [9], packet pair delay (PktPair) [9], expected number of transmissions (ETX) [7, 19], required number of packets (RNP) [6], and the expected MAC latency per unit-distance to destination (ELD) [20] have been proposed and deployed in different wireless networks. Among these routing metrics, ETX has been shown to perform well in a variety of wireless networks [9, 19], and has been widely
used in the research community. ETX is also most closely related to our one-way routing metric ETF, since the only difference between ETX and ETF is that ETX considers the quality of a link in both directions and ETF considers the quality of a link solely in the forward direction. To characterize the impact of only considering forward-direction link quality, we use ETX-based routing in our comparative study in this paper. ETX has been proposed to minimize the number of transmissions required to deliver data packets to their destina1 tions. The ETX metric of a link is calculated as df ×d , r where df and dr are the forward and backward reliability of the link respectively. df and dr are estimated mainly via asynchronous broadcast beacons [7]. Therefore, ETX-based routing, similar to other routing protocols, tends to avoid asymmetric links, leaving them for routing. Kim et al [12] proposed a framework for reliably and efficiently estimating wireless link quality. They also briefly discussed the potential benefits of exploiting asymmetric links in routing for IEEE 802.11 mesh networks. Our work in this paper complements [12] by systematically studying the properties of asymmetric links and addressing the challenges of exploiting asymmetric links for convergecast routing in sensor networks. There has been extensive work on addressing the challenges of routing (and distributed computing in general) in unidirectional networks [14, 3]. Sensor networks with omnidirectional radios but asymmetric links are different from general unidirectional networks, since the end-points of an asymmetric link may still be close by geographically in most cases. Therefore, the issue of sharing control information in sensor networks with asymmetric links is usually simpler than that in general unidirectional networks, and we show this in Section 5.2 by designing a simple method to discover asymmetric links.
3. EMPIRICAL STUDY OF LINK ASYMMETRY Many studies have shown that radio connectivity on low power devices is complex and non-ideal [19, 8, 21], especially in the presence of concurrent transmissions. Besides temporal and spatial dynamics of link properties, link asymmetry, resulted partly from variations in hardware and environmental noise, is a widely observed but less utilized complexity in wireless sensor networks. Instead of investigating the causes of asymmetry in physics, we seek a simple characterization of link asymmetry to motivate our design and development of ETF for exploiting asymmetric links.
3.1 Testbed All the experiments in this paper were conducted on Kansei [10], a high fidelity sensor network testbed. We used the testbed’s eXtreme Scale Mote (XSM), an enhanced version of Mica2 motes. Each XSM consists of a 4M Hz ATmega128L microcontroller and a Chipcon CC1000 radio operating at 433M Hz. It has 128KB of flash and 4KB of RAM, and runs TinyOS [1]. 210 XSMs are currently deployed on Kansei, with each XSM elevated 3 feet above the ground. In our experiments, we selected a 7 × 7 subgrid, with a 3 feet separation between neighboring nodes, from the testbed to mimic the setup of a field sensor network [5].
3.2 Link Asymmetry
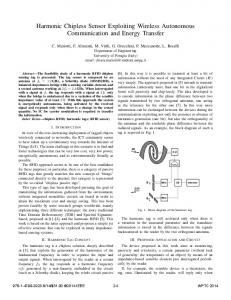
the links, the less propagation noise they may experience. On the other hand, as shown in Figure 1(b), distance seems to have positive impact on the ratio of unidirectional links. One extreme example is that links with distance 7 at power level 3 are all unidirectional. This might not be a general case, but it does indicate that more links may experience asymmetry with longer distance. In other words, if unidirectional links tend to be long, they could be exploited to result in more efficient routes. Considering the scenario of convergecast, we are particularly interested in unidirectional down links that point to the base station, i.e., links with excellent reliability in the forward direction closer to the base station and bad quality in the reverse direction. The reason to explore such links is that the upper layer routing protocol would substantially benefit from these unidirectional down links. The topology of these links are shown in Figure 2. Compared with the
Using round-robin broadcast experiments on the 7×7 grid, we collected empirical data to characterize link asymmetry in the target testbed. Since packet reception rate (PRR) is calculated over a relatively short period, we repeat such experiments 4 times to capture temporal variation: (1) EXP1: once in the morning; (2) EXP2: once in the afternoon; (3) EXP3: once in the evening; (4) EXP4: once at midnight. In each experiment, each node is given a turn in a roundrobin manner to transmit 100 broadcast messages (one per second). With source address and sequence numbers in all traces, we measure the PRR between each pair of nodes. We only consider connected link s that have non-zero PRR at least on one direction in the following measurements. Particularly, a link with less than 10% PRR difference on both directions is considered as a symmetric link, and the rest are asymmetric. We also consider a link with more than 90% PRR difference as a unidirectional link, a special case of asymmetric link. Note that the notion of unidirectional links in this paper only refers to links with excellent reliability on one direction and close to zero reliability on the other. Table 1 lists the average ratio of asymmetric links at difPRR difference Power level 1 Power level 3 Power level 9
< 10% 50% 65% 88%
10-90% 43% 22% 6%
> 90% 7% 13% 6%
# of links 500 1038 1155
0.8
Ratio of links
Ratio of links
0.8 0.6 0.4 0.2 0
1
2 3 4 5 6 7 Distance (×3 feet)
(a) symmetric links
8
45
46
47
48
37
38
39
40
41
4 28
29
30
31
32
33
34
3 21
22
23
24
25
26
27
2 14
15
16
17
18
19
20
17
8
9
10
11
12
SINK 11
0
2
2
3
3
4
4
5
5
13 6
6
results at the other two power levels, we find that some of these links (e.g. link(42, 12)) become disconnected at power level 1; and many links become symmetric at power level 9. For example, link(42 → 21) is unidirectional at power level 3, but P RR(42 → 21) = 99% and P RR(21 → 42) = 98% at power level 9, which is reasonable because reachability becomes much better with the higher power level. However, we find that link(42 → 15) and link(42 → 18) are still unidirectional at power level 9, which indicates that node 42 seems to be an inherent bad receiver from certain senders’ view, even with relatively high transmission power. Here is a summary of our observations as they pertain to our study. 1. A substantial percentage of links in wireless networks, especially low-power ones, are asymmetric. 2. Lower transmission power is likely to result in more asymmetric links in relatively dense networks. 3. Symmetric links tend to be short, while asymmetric links (especially unidirectional ones) are more likely to be long. This implies that effective exploitation of asymmetric links could lead to more efficient routing.
0.6 0.4 0.2 0
44
36
Figure 2: Topology of the unidirectional down links at power level 3.
ferent power level. We see that the majority of the links are symmetric, especially at higher power levels. Half of the links are symmetric at the lowest power level 1, 65% at 3, and 88% at 9. In contrast, the ratio of asymmetric links increases when the power level decreases. Nonetheless, we do not observe similar trend for the ratio of unidirectional links. Instead, both power level 1 and 9 have lower ratio of unidirectional links, which might be due to edge effects and link diversity at certain power level. Overall, we observe that a substantial percentage of links are asymmetric, and many of them are even unidirectional. The next aspect to explore is the distribution of symmetric links and unidirectional links as a function of the physical link length (i.e., distance between the sender and receiver of a link). We see that symmetric links are likely to occur between nodes nearby, as shown in Figure 1(a). The reason might be that the shorter 1
43
5 35
0
Table 1: Link asymmetry at different power levels.
1
6 42
1
2 3 4 5 6 7 Distance (×3 feet)
8
Note that the above conclusions do not include scenarios where senders and receivers use different transmission power. In these cases, the observation may not be exactly the same as we have from the testbed, but the degree of link asymmetry is likely to become even higher.
(b) unidirectional links
4. RELIABILITY OF SYNCHRONOUS ACKS Figure 1: The ratio of symmetric links and unidirecCerpa et al [6] studied temporal properties of low power tional links as a function of physical link length when wireless links and indicated that acknowledgments are betthe transmission power level is 3. ter to be sent soon right after packet reception (for improved
PRR difference EXP1 EXP2 EXP3 EXP4 Intersection
≤ 10% 660 648 692 685 572
10-20% 56 49 54 49 3
20-30% 22 25 27 21 0
30-40% 16 23 23 7 0
40-50% 15 20 15 18 0
50-60% 12 20 10 15 0
60-70% 13 16 16 22 0
70-80% 33 22 36 31 0
80-90% 69 63 47 59 3
> 90% 139 143 126 135 65
Table 2: Detailed statistics of PRR difference at power level 3. EXP1: morning; EXP2: afternoon; EXP3: evening; EXP4: midnight; Intersection: number of links that fall in the same category in all the experiments.
2. Synchronous/Asynchronous ACK with interference. Repeat the above experiments with interference. Nodes 0, 6, 42 and 48 at the four corners each send a broadcast interfering packet immediately after they overhear a packet from the sender. Since the acknowledgment packet and the interfering packets are sent at almost the same time, they will compete for channel access. The experimental results are shown in Figure 3. We see that synchronous ACKs for good links have almost 100% reliability whether or not there is interference, while asynchronous ACKs experience some loss, which increases in the presence of interference. In the case of medium links, the reliability of synchronous ACKs is around 90% on average, and some are close to 100%. Yet the reliability of asynchronous ACKs becomes very low (e.g., around 20%), especially in the presence of interference. Another surprising
Reliability
1 0.8 Syn. Ack−N.I Asyn. Ack−N.I Syn. Ack−W.I Asyn. Ack−W.I
0.6 0.4 0.2 0 0
500
1000 1500 2000 2500 Time (seconds) (a) good links
1 0.8
Reliability
1. Synchronous/Asynchronous ACK without interference. One node sends 20000 unicast packets (one per 128 ms) to its destination with link layer ACK mechanism enabled. When the application at the destination receives a packet, it immediately replies a data packet as an explicit ACK. The reliability of synchronous ACK is calculated as the number of synchronous ACKs received at the sender over the number of data packets received at the receiver during a window of 100 packets. And the reliability of asynchronous ACK is calculated as number of explicit replies received at the sender over the number of data packets received at the receiver on a window of 100 packets interval.
observation is that even bad links have reasonable reverse reliability for synchronous ACKs in the low quality direction, as shown in 3(c). If we compare the interference data with non-interference data, we see that synchronous ACKs are much less affected by potential channel contention and collision. Since the reliability of synchronous ACK is better than that of asynchronous ACK and experiments in [6] showed that the reliability of asynchronous ACK have higher reliability than those of beacon packets, we see that the reliability of synchronous ACK is generally better than that of periodic beacons. We also study the relation between ACK
0.6 0.4 0.2 0 0
500
1000 1500 2000 2500 Time (Seconds) (b) medium links
1 0.8
Reliability
ACK reliability). In their experiments, however, they regarded asynchronous broadcast packets (at least 1 second after packet reception) as acknowledgments. Here we go one step further. We investigate the performance of synchronous acknowledgment. We believe that the link quality for synchronous ACK packets is significantly better than that for beacons, especially in the presence of interference. This is because 1) everyone is backing off so that the channel is likely to be clear for a short acknowledgment immediately after a successful data transmission, and 2) the size of a synchronous ACK is usually much smaller than that of a normal data packet. To verify the conjecture, we select different classes of links: good, medium and bad reliability on the reverse direction at power level 3 based on the previous round robin experiments, to study the reliability of synchronous acknowledgments with and without interference. We consider explicit replies as asynchronous ACK because they are sent after a random back-off in the link layer. To reduce temporal variation, we collect data for synchronous ACK (using the default B-MAC in TinyOS) and asynchronous ACK in the same experiments as follows:
0.6 0.4 0.2 0 0
500
1000 1500 2000 2500 Time (Seconds) (c) bad links
Figure 3: Experiments for ACK reliability. N.I: No interference; W.I: With interference. The legends are the same for all three graphs. reliability and sender-receiver distance in the absence of interference. In this particular study, one node sends unicast packets to all the other nodes in the testbed in a round robin
1
43
44
45
46
47
48
35
36
37
38
39
40
41
28
29
31
32
33
34
24
25
26
27
21
42−>30: 23% 30−>42: 93%
42−>15: 100% 15−>42: 3%
23
17
18
19
20
99%9 7 5−>sink: 8
10
11
12
13
SINK
15
16
3
4
5
6
sink−>5: 98%
0.4 Asyn. Messages
1
2
Syn. Ack 2
4
6
8
Figure 4: ACK reliability vs distance. cussion we see that the improvement that synchronous ACK could achieve is significant (even for long links). This indicates that synchronous ACK is useful in guaranteeing the performance of ETF-based routing for both dense networks (where most links are short) and sparse networks (where links tend to be long).
Figure 5: An example of route selection. link(42, 15) is a unidirectional link in all the experiments. Consider a scenario where node 42 is the source, and node 15 and 30 are potential forwarders to the SINK. ETX selects path 42 → 30 → 15 → SIN K while ETF selects path 42 → 15 → SIN K.
SINK
bo
ETF: A ONE-WAY ROUTING METRIC
1. The quality of forward links is the key factor for successful data delivery. 2. A substantial percentage of links are asymmetric, with a wide range of loss ratios. 3. The reliability of synchronous acknowledgments on the reverse links is considerably higher than that of asynchronous messages. If each attempt of transmitting a packet from node A to node B is considered a Bernoulli trial with probability p(t), then (i × (1 − p(t))i−1 × p(t)) =
i=1
1 p(t)
(1)
and the delivery ratio of p(t) is measured over a period of time, p(t) =
recv(t − w, t) send(w)
th
0 .9
B
b o th
0 .9
C
bo
th
0 .8
b o th
0 .9 D
b o th
0 .8
S
Figure 6: An example of discovering asymmetry.
ETF is the expected number of data transmissions required for a data packet over a forward link, without considering the delivery ratio of ACK packets. ETF is better than ETX in the scenario of convergecast for the following reasons:
∞ X
bo
.0 5
5.1 The ETF metric
0 .7
d_ r= 0
The empirical study of link asymmetry and quality of synchronous acknowledgment leads us to investigate how to exploit asymmetric links, to improve network functions such as multi-hop convergecast routing, via one-way link estimation. In this section, we introduce ETF, followed by its implementation and discussion.
th
.9 5
0 0
ET F (t)A→B =
22
14
0.6
0.2
30
99% in both directions
0.8
Distance (×3 feet)
5.
42
d_ f= 0
Average Reliability
fashion. We collect data for nodes 0 and 1, and compute the average ACK reliability, as shown in Figure 4. From this dis-
(2)
where recv(t − w, t) is the number of probes received during the window w at node B, and send(w) is the number of probes sent by node A, i.e., the number of probes that should have been received by node B. The ETF of a route is the sum of the ETF of each forward link along the path.
The advantage of ETF can be illustrated by a realistic example from the testbed. In Figure 5, for instance, node 42 selects node 30 as its parent if ETX is the metric, because ET X42→30→15 = 5.69 and ET X40→15 = 33.3. It takes 5.4 transmissions on average to deliver a data packet from 42 to 15 through 30. However, only 1 transmission is actually needed to deliver a data packet directly from node 42 to 15. In this particular case, node 42 would spend much less number of data transmissions if ETF is the metric. If these links happen to be some of the important links [18] that join well connected components in certain network topologies, the choice of ETF would substantially improve the network performance. The next question is how to obtain ETF, especially for asymmetric links.
5.2 Discovering Asymmetric Links Unlike routing implementations in wireless ad hoc networks, most sensor network applications prefer low-rate beaconing (e.g. one beacon every 30 seconds) due to energy constraints. Thus connectivity updates along low-quality links may be delivered only infrequently. In Figure 6, for instance, link(S → B) is an asymmetric link with 95% forward reliability and 5% backward reliability. Delivery ratio of S → B is recorded at node B. In basic distance-vector routing, node S knows the forward quality only when it receives some reports from B. However, chances for such a direct report to be received at node S is extremely low, only 5%. Statistically speaking, node S may know the forward delivery ratio eventually, but it might be too late to take advantage of the excellent forward quality. Moreover, some links may be completely unidirectional, as we find in our testbed, then the source nodes would have no way of knowing such a fact. This
motivates us to design an effective strategy for locally discovering asymmetric links. Forward quality of asymmetric links can be obtained in an indirect manner based on the simple density argument as follows. In Figure 6, for instance, node C learns the quality of Link(S → B) and Link(B → S) when node B and S broadcast their reception reliability. C can then help convey this information. Certainly it requires C to keep track of information of Link(S → B) and Link(B → S). Due to memory constraint, however, it is impossible for C to keep information about all the links around (especially in a dense network). To address this issue, we can design a memory-efficient asymmetric link discovery method based on the following observations: (1) A node only needs to help a neighbor with which a high-quality bidirectional link exists. In Figure 6, for example, it is reasonable for C to keep information about the good forward link SB only if link quality of CS is good in both directions. This is because 1) it is difficult for C to learn from S that Link(B → S) is bad if the quality of Link(S → C) is low, and 2) it is difficult for C’s report to be received by S if Link(C → S) is bad. On the other hand, if C does not help because the quality of link SC is low in either direction, there exists with high probability another node (e.g., D) in the neighborhood who can help as long as the network connectivity (or density) is not too low. (2) A node only needs to keep information about asymmetric links and for asymmetric links, information about the direction where the link quality is high. When a third node detects an asymmetric link of interest, it can either put this information in his beacon packets or it can send a control packet to the node that may not be able to directly discover the asymmetry. If beacon packets can accommodate the information of asymmetry discovery, the first ’piggyback’ choice may be better since no additional control packets are introduced. In our current implementation, we adopt the second choice since 1) we want the discovery procedure to be independent of the link quality estimation protocol, 2) we want to ensure reliable delivery of asymmetry-discovery-information via link-level ACK, and 3) the payload size of each packet is limited in TinyOS (29 bytes by default), and beacon packets may need to accommodate other information such as reception reliability. Such an implementation introduces extra communication overhead due to control packets. To avoid control packet explosion, similar discovery reports are suppressed. In addition, such a discovery packet does not need to be reported every time a node detects asymmetry. A node needs to sharing information about asymmetric links only once every estimation period. Next we discuss the overhead of control packets. For each asymmetric link that needs to be discovered indirectly, the number of extra transmission is upper bounded by ∆, the number of detectors in every neighborhood. In fact, it is also upper bounded by min(∆,5). If the communication model were a perfect unit disk, the worst case transmission overhead would occur when all reporters are on the disk boundary and just outside each others communication range. In this case, up to five messages could be sent to inform link asymmetry in the disk. In practice though, the common neighborhood of nodes having an asymmetric link is likely to be much smaller than this unit disk, so the number of transmissions would be fewer than min(∆,5). Since control packets are introduced only for links of high degree of asymmetry, and the control packet is transmitted only once
every estimation period, the communication overhead is low compared with that of beacon packets.
Listing 1: Asymmetry Discovery AsymmetryDiscovery ( ngbr1 , ngbr2 , r ) { // r i s t h e r e l i a b i l i t y o f Link ( ngbr1−>n g b r 2 ) i f r >85% i f e x i s t s ( ngbr2 , ngbr1 ) remove e n t r y ( ngbr2 , ngbr1 ) ; e l s e i f s i m i l a r f a c t has been h e a r d 4 t i m e s s c h e d u l e a r e p o r t t o ngbr1 ; e l s e i f t h e r e i s a s p a c e f o r Link ( ngbr1−>ngbr2 ) and q u a l i t y ( me , ngbr1 ) i s good keep Link ( ngbr1−>ngbr2 ) ; e l s e i f r u1 , ETF would choose node C, while ETX B. For ETF, node A would spend Pk−1would choose node i−1 × (u2 × v2 )) + k × (1 − u2 × i=1 (i × (1 − u2 × v2 )
0.5 u2: forward reliability
1
5 0 0
0.5 u : forward reliability
1
2
(a) Relative increase in cost (b) Relative reduction in cost when using ETF in the bad when using ETF in the good cases. cases. Figure 8: Impact of using ETF in different cases. relative cost is less than 1.2, and most of them are less than 0.6. Nonetheless, if we check the improvement achieved by using ETF (i.e., in good cases) as shown in Figure 8(b), we see that benefit of using ETF is substantial, where many nodes only pay half of the price when using ETF instead of ETX. Neighbor table management. When neighbor table size is limited, it may be impossible to maintain information about all the neighbors. In this case, an eviction policy should be carefully designed. In our implementation, an entry with the least priority is evicted when a new neighbor is discovered while the table is full. The priority is defined by a set of metrics such as path quality, neighbor’s path quality, current reception rate, and hop count. A subtle detail of the neighbor table management is that a newly added neighbor should not be replaced unless its quality has been reliably estimated (e.g., by at least a round of estimation). We conduct a simple experiment in Section 6 to show the importance of this subtlety.
6. EXPERIMENTAL EVALUATION In this section, we evaluate, via testbed based experiments in convergecast routing, the performance of ETF and compare it with that of ETX.
PRR vs Distance: power level=9
6.1 Experiment Design
1
0.6 0.4 0.2 0 3
4
6
8
9
10
12
13
15
16
17
18
19
20
21
23
25
20
21
23
25
20
21
23
25
Distance (feet) PRR vs Distance: power level=3 1 0.8
PRR
We have implemented in TinyOS a distance-vector routing framework where different aspects of routing (e.g., routing metric and neighbor table management mechanisms) can be evaluated in the same setting. To study the impact of exploiting asymmetric links on routing and to examine some design decisions of ETF, we instantiate the routing framework in different ways to get the following routing protocols:
PRR
0.8
6.1.1 Protocols studied
0.6 0.4 0.2
• ETX : convergecast using routing metric ETX.
0 3
• ETF : convergecast using routing metric ETF.
6
8
9
10
12
13
15
16
17
18
19
Distance (feet) PRR vs Distance: power level=1 1 0.8
PRR
• ETX-pre: same as ETX, but a newly added neighbor can be replaced even if its quality has not been reliably estimated (e.g., by a round of estimation) yet. This is to study the importance of proper neighborhood management, especially in high-density networks.
4
0.6 0.4 0.2 0 3
4
6
8
9
10
12
13
15
16
17
18
19
Distance (feet)
• ETF-NU : same as ETF, except that the explicit asymmetric- Figure 9: Testbed density at power level 9, 3 and 1. link discovery is disabled. This is to study whether ETF will work well without explicit asymmetric-link discovery which is designed for detecting links with the radio transmission power level adopted by the motes. extreme asymmetry (e.g., unidirectional links). To illustrate this, we provide in Figure 9 the boxplots of (Note that, for simplicity, we name protocols primarily based packet reception rate (PRR) as a function of the distances on their routing metrics.) between senders and receivers, when the power level is 9, 3 and 1 (out of a range of [1, 255]) respectively. Clearly, link 6.1.2 Performance Metrics connectivity generally falls off with increasing distance, but We use the following metrics to compare the performance not uniformly though. Nodes geographically faraway may of different routing protocols: have excellent connectivity, whereas nodes nearby may have poor link quality. • End-to-End Reliability: number of unique packets reFrom the figure, we see that the network is sparse at power ceived at the base station divided by the number of level 1, where most nodes can only talk to a limited number packets originated. of nodes nearby. At power level 9, the density is fairly high since almost any two nodes can talk to each other with high • Number of Transmissions Per Packet (TXPP): T XP P probability. At power level 3, a node is able to reach many is the expected number of transmissions, including renodes in the network, and some links are reliable while some tries, required for delivering a packet from its source are not. Thus, power level 3 gives us a typical multi-hop to the base station. It is calculated as the total numnetwork (about 4-5 hops). We will conduct experiments at ber of transmissions divided by the total number of different power levels to study the impact of network density unique packets received at the base station. It reflects on the performance of routing protocols. the reliability of selected relay nodes, path optimality, throughput, and energy efficiency in routing. • End-to-End Latency: the time taken for a packet to be delivered from its source to the base station. Latency is a critical consideration in many mission-critical sensor networks such as those for security surveillance. • Duplicates: the number of duplicate packets found at all the nodes in the network. Duplicate packets are mostly due to ack loss. Duplicates incur extra energy consumption and introduce extra interference. • Hop Count: the average number of hops in the routes used in packet delivery.
6.1.3 Testbed We use the 7 × 7 grid testbed as discussed in Section 3.1 for the performance evaluation, and we set the mote at the left-bottom corner of the grid as the base station. Varying network density. The actual network density (or connectivity) in the testbed depends, to a great extent, on
6.1.4 Traffic Trace To mimic sensor network traffic pattern, we use both burstyevent traffic and periodic traffic. The event traffic pattern is based on a publicly available traffic trace [2] collected in a real-world intrusion detection sensor network. In the traffic trace, each node of a 7×7 grid, except for the base station, generates two packets denoting the start and the end of its local detection of an intrusion event. A total of 96 packets are generated each time the event occurs. For each experiment configuration (e.g., a fixed radio transmission power level) with the event traffic trace, we run 20 runs of the same experiments, with an interval of 3 minutes between two consecutive experiments. To reflect a typical traffic pattern in data-collection sensor networks, we also evaluate the performance of different routing protocols using a trace of periodic traffic. More specially, each node generates a packet every 30 seconds on average in the periodic traffic trace.
To improve packet delivery reliability, one common approach is to retransmit lost packets. That is, when a node sends a packet to its next-hop forwarder (or the base station), the node will keep transmitting the packet until an ACK is received or the packet has been transmitted up to a threshold number of times, which we call the maximum transmission count (MTC). It is usually difficult to determine a perfect value for MTC. Large MTC may introduce high overhead because of ACK loss, while small MTC may lead to low packet delivery reliability. In our experiments, MTC is set as 8 (a typical value that is also used in IEEE 802.15.4) unless explicitly mentioned otherwise.
0.23
6 0.68
0.97
0.53
0.97
0.78
0.82
0.75
0.025 0.82
0.9
5 0.95
0.7
0.63
0.57
0.63
0.85
0.93
0.1
0.2
0.97
4 0.68
0.97
0.82
0.68
0.72
0.85
0.85
0.95
0.85
0.075 0.17
0.9
3 0.93
0.97
0.8
0.93
0.85
0.93
0.88
1
0.97
0.97
0.97
0.25
0.15
21
1
0.97
0.97
0.93
0.7
0.6
0.97
1
0.025 0.95
0.7
1
11
1
1
0.8
1
0.88
0.9
0.95
3
1
5
1
6
0.9
0 SINK 0.97 0 1
0.68
3
0.95
4
1
5
0.82
6
6 0.9
0.95
0.15
1
0.13
5 0.93
0.13
0.25
0.13
41
1
0.65
3 0.93
0.97
2 0.88 1 0.93
0 SINK 1 0 1
In our study, we find out that the general observations are quite similar for experiments based on event traffic and those based on periodic traffic. Therefore, we focus on presenting results for experiments with event-traffic in this section, and we only briefly discuss some summary data for periodic traffic based experiments at the end of the section. For event traffic based experiments, we first present the results for networks of different densities, and then we present the impact of MTC on the performance of different routing protocols.
6.2.1 Dense Network: Transmission Power Level=9 Neighbor table management is very important in dense networks, since a node can only keep state information about a selected set of its neighbors. Therefore, besides ETX and ETF, we also study the performance of ETX-pre to understand the impact of proper neighbor table management. Table 3 shows the summary performance data for ETXReliability 66.88% 84.79% 94.84%
TXPP 5.55 3.69 1.78
Delay 0.096 0.160 0.095
Dup. 561 177 91
Hops 1.67 3.06 1.52
Table 3: Performance of ETF and ETX at power level 9. pre, ETX, and ETF respectively, and Figure 10 shows the packet delivery reliability from individual nodes in different routing protocols. We see that the performance of ETX-pre is quite low (even compared with ETX), and that the packet delivery ratios for some nodes (e.g., those in the middleupper part) are extremely low. After detailed data analysis, we find that most of the packet transmission failures are due to packets being directly sent from those nodes to the base station, even though those links are of low reliability. This is also part of the reasons why ETX-pre has lower average hop count than ETX. Looking deeper, we found that better potential links in ETX seem to be evicted from the neighbor table in the routing convergence process as a result of inappropriate neighbor table management. With the enhanced neighbor table management as described in Section 5.4, ETX has much better performance than ETX-pre. Therefore, we use the same enhanced neighbor table management mechanism in ETF. From Table 3, we see that, even though ETX seems to perform well at power level 9, it is still not as good as ETF. Compared with ETX, ETF improved the reliability from
2
0.95
4
0.05
0.17
2
0.93
ETF
6.2 Experimental Results
ETX-pre ETX ETF
ETX
ETX−pre
6.1.5 Maximum Transmission Count (MTC)
6 0.95
0.97
0.93
0.97
0.97
0.9
1
5 0.95
0.9
0.97
0.9
0.8
0.97
0.95
41
0.97
0.95
0.97
0.78
0.97
0.8
3 0.97
1
0.93
0.93
0.93
0.93
0.93
21
1
1
0.97
0.97
0.93
0.95
11
0.97
0.97
0.88
0.97
0.88
0.95
0.97
3
1
4
1
5
0.97
6
0 SINK 0.97 0 1
2
0.95
Figure 10: The packet delivery ratio when transmission power level is 9.
ETX ETF-NU ETF
Reliability 76.51% 82.50% 88.39%
TXPP 4.87 2.83 2.48
Delay 0.115 0.104 0.096
Dup. 467 336 197
Hops 2.08 2.13 2.02
Table 4: A comparison of reliability, TXPP, latency, duplicates and average hops at power level 3.
84.79% to 94.84%, with less than half of the TXPP required and even lower latency. ETF also has better performance in terms of duplicates and average hops. Recall that we have observed, in Section 3, that link(42 → 18) seems to be unidirectional at power level 9. We find that a fair number of packets from node 42 are successfully forwarded through link(42 → 18) in ETF. Yet in ETX, most packets from node 42 take the route of 42 → 17 → 0). As shown in Figure 10, accordingly, the base station only receives 68% of the packets from node 42 in ETX, even though it receives 95% of the packets from node 42 in ETF.
6.2.2 Regular Network: Transmission Power Level=3 Since the testbed at power level 3 mimics typical realworld sensor network connectivity, we discuss the results of this set of experiments in more detail. We also use power level 3 to investigate the impact of other factors such as MTC and traffic pattern later. To study whether ETF works without the explicit asymmetric-link discovery mechanism, we also measure the performance of ETX-NU when the power level is 3. A comparison of reliability, number of transmissions per packet, latency, duplicates and mean hops at power level 3 is given in Table 4. The reliability is 88.39% for ETF, 82.50% for ETF-NU, and only 76.51% for ETX in this scenario. As expected, ETF yields far fewer number of transmissions per packet, 2.48 compared to 4.87 with ETX, because it yields a better choice of forwarders. We also find that ETF-NU spends comparable TXPP (2.83), which indicates that ETF is more energy efficient that ETX, even when asymmetric-link discovery is not enabled, i.e., when links with extreme asymmetry (e.g., unidirectional links) are not used. (Note that links
TXPP 14.21 7.25
Delay 0.292 0.197
Dup. 999 945
Hops 7.23 4.39
Table 6: Performance of ETF and ETX at power level 1. Number of TXs per packet at power level 3
Reliability at power level 3 1
5
0.8
4
0.6 0.4
0.95
0.2
0.9
0
0.85
3 2 1 0
ETX_2 ETF_2 ETX_4 ETF_4 ETX_8 ETF_8
Mean Delay at power 3
ETX_2 ETF_2 ETX_4 ETF_4 ETX_8 ETF_8
Duplicates at power level 3
0.14
0.8
500
0.12
ETX ETF−NU ETF
0.7 0.65 0
5
10 Events
15
20
400
0.1
#Duplicates
0.75
Mean Delay (s)
Reliability
1
Reliability 56.51% 57.71%
#Transmissions
Event Reliability at power level 3
ETX ETF
reliability
with moderate asymmetry can still be detected and used in ETF-NU.) The latency in ETF and ETF-NU is slightly better than that in ETX, but would be much better if lost packets could be taken into account in some way. Again, ETF has much less duplicates than ETX. As to average hop count, ETX and ETF are comparable, and ETF-NU has a little more. But this achievement does not help ETX to improve the reliability and reduce the latency. Since the traffic pattern is derived from an intruder detection application, we are also interested in the event reliability that is calculated based on each event, as shown in Figure 11. As we can see,
0.08 0.06 0.04
initially, the reliability of ETF is around 72%. With the help of asymmetric links, it becomes better. Again, ETF-NU also outperforms ETX in this measurement. To understand the underlying reasons for the improved performance of ETF and ETF-NU, we analyze the properties of the links used in different protocols. Table 5 shows link reliability C.O.V. of reliability link length (feet)
ETX 70.4% 0.142 9.05
ETF-NU 72.1% 0.109 9.22
ETF 78.3% 0.107 9.90
Table 5: Quality of links used in routing. Here link reliability refers to the mean reliability of all the links used, C.O.V. refers to the coefficient of variation (i.e., standard deviation divided by mean) in link reliability and measures the stability of the used links, and link length refers to the mean length of the links used in routing. the mean reliability, coefficient of variation in reliability, and the mean length of the links used in different protocols. It is interesting to see that, even though the links used in ETF are longer than those in ETX, the links used in ETF are still more reliable and stable than those used in ETX. Thus exploiting asymmetric links in routing (via ETF-NU or ETF) can help find those long, reliable, and stable links in the network. By comparing ETF with ETF-NU, we can see that the explicit asymmetric-link discovery mechanism used in ETF also helps in identifying those links of extreme asymmetry (e.g., unidirectional links) and thus further improves the routing performance.
6.2.3 Sparse Network: Transmission Power Level=1 The routing performance at power level 1 is shown in Table 6. We see that the reliability of ETX and ETF are both low, mostly because the link quality at the lowest power level is extremely bad. Nonetheless, TXPP in ETF is only about
0
200 100
0.02
Figure 11: Comparison of event reliability at power level 3.
300
ETX_2 ETF_2 ETX_4 ETF_4 ETX_8 ETF_8
0
ETX_2 ETF_2 ETX_4 ETF_4 ETX_8 ETF_8
Figure 12: The impact of MTC at power level 3. The number following ETF /ETX is the value of MTC. half of that in ETX, and the improvement in latency is also substantial, showing the benefits of exploring asymmetric links even in sparse networks. Summary. From the discussions above and the data shown in Tables 3, 4, and 6, we see that, compared with ETX, ETF significantly improves the energy efficiency and reduces packet delivery latency irrespective of network density. ETF also improves packet delivery reliability, especially in regular to dense networks (e.g., at power levels 3 and 9). Note that current results of the TXPP does not include extra transmissions for asymmetry discovery in ETF. Although this number is much fewer than that of mass data transmissions, the TXPP in ETF would be a little bit more if the number of control packets are counted. Again, if the implementation puts the discovery information in the beacon packets, then no extra communication overhead is required.
6.2.4 Impact of MTC To study the impact of MTC on the performance of routing protocols, we measure and compare the performance of ETF and ETX when MTC is set to 2, 4, and 8 respectively. Since the change of MTC does not affect the mean hop count much, here we only present in Figure 12 the performance results in terms of reliability, TXPP, latency and duplicates. We see that the reliability of ETF is higher than that of ETX in all the three cases. Change of MTC has more impact on the performance ETX than that of ETF. This is because ETF uses dynamic retransmission thresholding according to link reliability. One interesting result is that ETX achieves 82.19% reliability when M T C = 4, while it performs worse with both higher and lower MTCs. This again suggests that it may well be difficult to determine a unanimous MTC in advance to fit all network conditions. Besides reliability, ETF substantially outperforms ETX in
terms of the number of transmissions per packet received at the base station and duplicates. As to the mean packet delivery latency, ETX is a little better than ETF, but this is mainly because more packets far away from the base station are received in ETF routing and they contribute to the increase of average latency.
6.2.5 Periodic Traffic In addition to the bursty-event trace, we have also evaluated ETF and ETX at power level 3 with periodic traffic, where each node reports an event every 30 seconds preceded by a random delay. We summarize the experimental results in Table 7. We see that the reliability of ETF is considerably better than that of ETX, increasing from 70.76% to 90.33%. The TXPP and average latency are lower for ETF, and the average hops is comparable for both. We have also observed an exception that ETF has more duplicates in this case. One reason is that far more packets have traversed along the path to the base station, which has yielded duplicates. Another reason could be that ACK loss occurred on the low quality direction of some asymmetric links exploited by ETF. However, the overall performance of ETF is much better than ETX with this periodic traffic pattern.
ETX ETF
Reliability 70.76% 90.33%
TXPP 2.86 2.03
Delay 0.081 0.075
Dup. 247 365
Hops 1.74 1.68
Table 7: Performance of ETF and ETX with periodic traffic at power level 3.
Based on the above experimental results, we have observed that exploiting asymmetric links via ETF substantially improves routing performance, even when the explicit asymmetric-link discovery mechanism is disabled.
7.
CONCLUDING REMARKS
Unlike existing work that tries to avoid asymmetric links, we have explored the benefits of exploiting asymmetric links in wireless networks. To this end, we have examined in detail the link asymmetry and the quality of synchronous acknowledgments based on testbed experiments. We have also proposed a one-way link metric ETF, and addressed the challenges of link asymmetry to routing protocol design by proposing the collaborative asymmetric-link discovery and the dynamic retransmission thresholding mechanisms. Despite the great deal of prior work in the context of link metrics, we believe that our work provides a unique one-way solution to the link estimation problem in wireless sensor networks. Through detailed experimental study in a high fidelity testbed, we find that exploiting asymmetric links (via ETF) significantly improves the performance of functions such as convergecast routing in sensor networks. Even though we have mainly focused on sensor networks in this paper, we believe that asymmetric links can also be exploited for performance optimization in other networks such as wireless mesh networks, and we will explore this potential opportunity in our future work. Note that so far we only look at convergecast traffic, whether our scheme is beneficial for routing problem in general needs further research. We will also explore how to take advantage of the high reliability of
synchronous ACKs in other routing paradigms such as opportunistic routing.
8. ACKNOWLEDGMENT We thank Bill Leal and Vinodkrishnan Kulathumani for comments on the manuscript, Mukundan Sridharan for help on the testbed experiments, and the anonymous reviewers for their thoughtful suggestions. This material is based upon work supported by the National Science Foundation under Grants No. 0520222 and 0341703.
9.[1] http://www.tinyos.net. REFERENCES [2] Traffic trace from a field sensor network. http://www.cs.wayne.edu/ ∼hzhang/group/publications/Lites-trace.txt. [3] Y. Afek and E. Gafni. Distributed algorithms for unidirectional networks. SIAM Journal on Computing, 23(6):1152–1178, 1994. [4] D. Aguayo, J. Bicket, S. Biswas, G. Judd, and R. Morris. Link-level measurements from an 802.11b mesh network. ACM SIGCOMM, 2004. [5] A. Arora and et al. A line in the sand: A wireless sensor network for target detection, classification, and tracking. Computer Networks (Elsevier), 46(5), 2004. [6] A. Cerpa, J. L. Wong, M. Potkonjak, and D. Estrin. Temporal properties of low power wireless links: Modeling and implications on multi-hop routing. CENS Technical Report 0044, 2005. [7] D. S. J. D. Couto, D. Aguayo, J. Bicket, and R. Morris. A highthroughput path metric for multihop wireless routing. ACM MobiCom, 2003. [8] D.Ganesan, D.Estrin, A.Woo, D.Culler, B.Krishnamachari, and S.Wicker. Complex behavior at scale: An experimental study of low-power wrireless sensor networks. Technical Report CS TR 02-0013, UCLA, 2002. [9] R. Draves, J. Padhye, and B. Zill. Comparison of routing metrics for static multi-hop wireless networks. ACM SIGCOMM, 2004. [10] E. Ertin and et al. Kansei: A testbed for sensing at scale. IEEE/ACM IPSN/SPOTS, 2006. [11] O. Gnawali, M. Yarvis, J. Heidemann, and R. Govindan. Interaction of retransmission, blacklisting, and routing metrics for reliability in sensor network routing. IEEE SECON, 2004. [12] K.-H. Kim and K. G.Shin. On accurate measurement of link quality in mulit-hop wireless mesh networks. ACM Mobicom, 2006. [13] D. Kotz, C. Newport, and C. Elliott. The mistaken axioms of wireless-network research. Technical Report TR2003-467, Dartmouth College, Computer Science, July 2003. [14] V. Ramasubramanian, R. Chandra, and D. Mosse. Providing a bidirectional abstraction for unidirectional ad hoc networks. IEEE INFOCOM, 2002. [15] R.Dube, C.Rais, K.Wang, and S.Tripathi. Signal stability based adaptive routing (ssa) for ad hoc mobile networks. IEEE Personal Communication, Feb. 1997. [16] S.Keshav. A control-theorectic approach to flow control. ACM SIGCOMMM, 1991. [17] K. Srinivasan, P. Dutta, A. Tavakoli, and P. Levis. Understanding the causes of packet delivery success and failure in dense wireless sensor networks. ACM SenSys, 2006. [18] F. Stann, J. Heidemann, R. Shroff, and M. Z. Murtaza. RBP: Robust broadcast propagation in wireless networks. ACM SenSys, 2006. [19] A. Woo, T. Tong, and D. Culler. Taming the underlying challenges of reliable multihop routing in sensor networks. ACM SenSys, 2003. [20] H. Zhang, A. Arora, and P. Sinha. Learn on the fly: Data-driven link estimation and routing in sensor network backbones. IEEE INFOCOM, 2006. [21] J. Zhao and R. Govindan. Understanding packet delivery performance in dense wireless sensor networks. ACM SenSys, pages 1–13, 2003.