Design validation for embedded arrays remains as a challenging problem in today's microprocessor design en- vironment. At Somerset, validation of array ...
On Logic and Transistor Level Design Error Detection of Various Validation Approaches For PowerPCTM �Microprocessor Arrays Li-C. Wang and Magdy S. Abadir
Jing Zeng
Somerset PowerPC Design Center Motorola, Inc., Austin, Texas
Somerset PowerPC Design Center IBM, Austin, Texas
Abstract Design validation for embedded arrays remains as a challenging problem in today's microprocessor design environment. At Somerset, validation of array designs relies on both formal veri cation and vector simulation. Although several methods for array design validation have been proposed and had great success [[5], [8], [9], [12]], little evidence has been reported for the e�ectiveness of these methods with respect to the detection of design errors. In this paper, we propose a way of measuring the e�ectiveness of di�erent validation approaches based on automatic design error injection and simulation. The technique provides a systematic way for the evaluation of the quality of various validation approaches at both logic and transistor levels. Experimental results using di�erent validation approaches on recent PowerPC microprocessor arrays will be reported.
1 Introduction Among various design blocks in a microprocessor, embedded arrays represent one of the most challenging parts for design validation. The arrays usually comprise large number of storage elements, together with complex timing and control logic that determine how they are used and updated. Usually, arrays are custom designed so that their performance can be optimized to the greatest extent. In general, these arrays comprise more than 50% of the onchip area and up to 80% of the total number of transistors [5]. In general, an array design can be represented by three di�erent views. They are: the high-level (or RTL) view, the gate-level view, and the transistor-level view. These views form the design data triangle. Each view on this triangle represents design data required for a particular set of tools and applications. The RTL view is the most abstract, in the sense that it is the high-level speci cation of a design, where all func� IBM
and PowerPC are trademarks of IBM Corporation in the United States, or other countries, or both
tionality is described using high-level constructs. For custom design blocks such as arrays, transistor-level schematics are manually drawn according to the RTL speci cation. Usually, the gate-level views of these custom blocks are generated from the RTL model directly, which are used for test generation. In the normal design ow, the RTL model for a module is rst derived. Extensive functional simulation at the full-chip level is carried out to verify the correctness of the RTL speci cation before the design is actually implemented. Then, various methods are applied to validate the correctness of these design views. These methods include: Simulation using manually generated test vectors, Simulation using tests generated by a commercial ATPG tool, Formal veri cation based on Symbolic Trajectory Evaluation, and Simulation using tests generated based on formal veri cation results. Each of the methods has been reported with success [[5], [8], [9], [12]]. However, not much has been done in order to quantify the completeness of each approach with respect to design error detection. In this paper, we will present a systematic way to evaluate the quality of a validation method, based on logic level as well as transistor level error injection and detection. This approach provides an answer to the question of how complete a particular validation approach is. Experimental results based on applying various validation methods to recent PowerPC microprocessor arrays will be analyzed and discussed.
2 Overview of Various Validation Approaches To validate the correctness of various design views, traditionally, vector simulation is used. This approach breaks down for arrays due to the exponentially large number of patterns required for exhaustive veri cation. Boolean equivalence checking is not completely suitable for arrays either because of the large number of storage elements and the complex timing scheme involved [7].
ATPG Based Test Vectors
One method that we have employed in the past with success to verify the equivalence between the gate level and
the transistor level views of a design relies on the use of test vectors generated by ATPG tools and then simulating these vectors on the transistor level view [5]. In order for ATPG tools to understand the array logic, proper gate level view is created. In the gate level view, arrays are modeled more like combinational circuits with transparent primitives, such as prede ned sequentially transparent RAMs. Such a modeling approach is limited in the sense that the behavior of some designs may fall beyond the modeling capacity of these prede ned primitives. If an array can be modeled properly and a high fault coverage can be obtained, ATPG tests do have the advantage that they cover almost all structural sites in a circuit. Since design errors associated with a particular site whose stuck-at faults have been detected will likely be fortuitously detected [1], high fault coverage test set can be e�ective for detecting design errors.
too many symbols are used in a single assertion. Usually, selected non-critical symbolic values such as those used on the data path are replaced with constant values in order to reduce overhead. Second, the completeness of assertion set is not guaranteed. Since the STE veri cation is as complete as the corresponding assertions, it is possible that a particular design error will be missed due to the incompleteness of the assertion set. Although STE can provide the most comprehensive veri cation for arrays, simulation based methods are still required for the following reasons. Designer generated tests provide perhaps the cheapest and fastest way for detecting errors in the early design cycle. In addition, because of the limitations of the switch level simulation model [2], delays and other detailed electrical properties (crosstalk, power, noise) are not veri ed during STE and hence, detailed simulation is required for further design validation.
Formal veri cation with Symbolic Trajectory Evaluation (STE) [11] provides another alternative for validation. In STE, a set of assertions are manually created for an array design. Assertions represent a set of high level properties for which the design should satisfy under normal operations. Therefore, assertions can be thought as the golden model view of a design, which will be proved to be equivalent to all other views under STE. The advantage of this scenario is that not only the equivalence between two views can be veri ed but also the correctness of RTL model can be checked again independently. Therefore, if there is any unexpected error left in the RTL model after the extensive functional simulation, the error can be captured during the STE veri cation process. STE [11] is a descendant of symbolic simulation [3]. At the core of symbolic simulation, Ordered Binary Decision Diagram (OBDD) [4] is used to e�ciently manipulate boolean functions. In STE, a circuit is speci ed in terms of a set of properties in a restricted temporal logic form. Properties are expressed by so-called assertions which are of the form \Antecedent =) Consequent" where both \Antecedent" and \Consequent" consist of a number of formulae. Formulae can be simple predicates such as \line A is `a"' (line A holds the symbolic value `a' at current time), or conjunctions of these simple predicates. Formulae can be applied with the next time operator in order to state the facts such as \line A remains `a' in the next time step." It is also possible to apply domain restriction so that \line A remains `a' when D is true" can be expressed. This simple logic in STE is su�cient for array veri cation purpose [[5] [8] [9]]. With STE, operations speci ed in the antecedent are symbolically simulated, and then conditions declared in the consequent are asserted. The assertion set represents a high level functional speci cation for a design. A Somerset in-house tool called VerSys built on top of Voss [10] is used to verify that all three views satisfy the same assertions. There are two major limitations on the STE method. First, for large design, the OBDD size can easily blow up if
Test generation based on STE assertion has been developed recently to combine the advantages of both ATPG method and STE approach. It has been shown that although \assertion tests" are generated without any structural information, they can achieve a higher stuck-at fault coverage than traditional ATPG tests due to the limitations of the ATPG tools on properly handling the arrays [12]. The basic idea is to replace the symbolic values used in the antecedent with a set of constant test vectors based on each condition speci ed in the consequent. The basic techniques include (details can be found in [12]) 1). replace a symbolic address comparison expression with address marching sequences, 2). replace a symbolic data comparison expression with data marching sequences, 3). replace stand-alone symbolic values with random vectors, 4). construct assertion decision tree and generate tests to cover all branches, and 5). construct control signal decision tree in order to generate tests to cover abnormal functional space. Note that assertion tests are well-suited to validate design and to debug errors since they are based on the functional properties/operations of the arrays. Since assertion tests do not exhaust all possible test space associated with an assertion, they are not as complete as the assertion. On the other hand, assertion tests do explore the abnormal functional space which is generally not considered by assertions, and hence provide additional check on the design. One thing to note is that assertion tests use no structural information of the design, and thus may not provide a complete coverage on all sites as a 100% stuck-at fault test set is able to.
STE Assertions
Assertion Based Test Vectors
3 Error Model and Error Injection None of the three approaches described earlier guarantees a complete validation. Stuck-at fault simulation can be used to provide some estimation of the quality of
ATPG tests and assertion tests. This involves using a separate fault simulator other than the logic simulator used for functional veri cation. For STE veri cation, since the underline symbolic simulator does not have the fault injection capability, it is di�cult to perform fault simulation under the STE engine. To evaluate the validation quality, we require a more systematic way which can be achieved with the existing logic simulator in use. We thus propose to use logic error design injection and simulation. This provides us a method to analyze the strength and weakness of various validation approaches, and hence quanti es how complete each approach is.
Design Errors in Gate Level Test View
Several design error models were developed at the logic level in [5]. These models include: Extra inverter, Gate Substitution, Extra wire, Extra gate, Missing gate, Wrong wire, etc. For the experiments, we will consider only the simple types of error described above. However, the framework can be extended to cover other types of design error models easily. add_in[1:log(n)]
Level Schematic View of a design. At the schematic level, designs usually contain hierarchy of modules within which both transistors and gates are used. Therefore, in addition to the gate level design errors described above, new types of hierarchical and transistor level design errors can be included. Wrong Strength: Transistors can be categorized into di�erent strength levels (as they are turned on) based on their sizes (widths). Changing a transistor strength from one level to another may result in di�erent circuit behavior. Wrong Transistor: Switch an n-type transistor to ptype with the same size or vice verse. Figure 2 illustrates the transistor level error models which are inspired by the gate level design error models. Although p-type transistors are shown in the Figure, similar error models apply for n-type transistors. Also note that missing transistor, missing connection, extra wire, and wrong wire error models can occur at transistor source and drain as well. Correct
box2: design error module
Incorrect
C S
D
C D
S
Wrong Strength (Size) Extra Transistor box2
box2
Incorrect
C
S
D
Decoder
Correct
C
C1
C2
S
D
S
D
C1 Missing Transistor
C S
S
D C
D1
D
S
D
D
X
S2
C
D2
S1
D2
D1
S2
D1
C1 S
S
D
D S1
To accurately model the real design errors, di�erent types of design errors are also injected in the Transistor
C2
C2 Wrong Wire
X
Design Errors in Transistor Schematic View
S1 Switch Controls
Modified Circuit
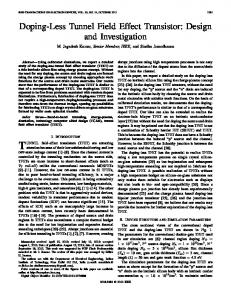
Since simulating all possible design errors is usually too expensive, a set of n , 1 design errors are inject randomly, where n is usually linearly proportional to the number of gates in a design. To inject n , 1 random errors, we modify the design in the following way. log(n) additional primary inputs are rst added to the design. These additional inputs are then decoded to select n , 1 errors, plus one case where no error is injected. Error injection is essentially controlled by a multiplexer, where either the good design or a faulty design is selected locally. Figure 1 shows the modi cation for the extra inverter error model. Thus with control input bus of width log(n), there are totally n possible input combinations where n , 1 can be used to select design errors. The modi ed design is then fed into a commercial logic simulator. Expected results from the original design are compared and if there is a mismatch, a detection is reported.
S2 D1
Missing Connection
S
Error Injection of an Extra Inverter
C2
S2
C S1
Figure 1:
D2
D2
C
design error module for extra inverter design error
box1
D
Wrong Transistor
C
box2
S
X
Extra Wire X C
S
S
D
Figure 2:
D
Additional Error Models at the Transistor Level
Correct
Incorrect Module A Instance 1
X
pin P
pin P
Correct
Module A Instance 1 X
Module A Instance 2 Y
Switch Inputs or Outputs
C
An Instance of a module
pin P
Module A Instance 2 Y
An Instance of a module
X
pin P
X
pin P
Y
pin Q
Y
pin Q
pin P
Switch Connections (Between Instances)
Figure 3:
Incorrect
Switch Connections (Within An Instance)
Hierarchical Error Models
Hierarchical Design Errors
As mentioned earlier, schematic design contains hierarchy. A module in the lower level of the hierarchy is usually instantiated multiple times inside a module at the higher
level. Two additional error types are possible during the instantiation of a module. (see Figure 3) In addition, some gate level error models can also be generalized to module level and used in a hierarchical design. These include Wrong Wire, Extra Wire, Missing Wire, Wrong Cell (For example, di�erent implementations of the same function), etc. C
Modified Result
Control to Activate Good Circuit
Control to Activate Error 1 (Wrong Transistor)
Original C D
S
X
D
S
Figure 4:
Control to Activate Error 2 (Wrong Wire)
Error Injection at the Transistor Level
3.1 Error Injection To inject errors at the transistor level, simply using a MUX design as before may not work properly. This is because a MUX designed at the gate level may change a weak signal at its input to be a strong signal at its output. To avoid such a situation, errors are injected and controlled by pass transistors which are given the largest width compared to all the transistors used in the original circuits so that when they are turned on, they do not change the transistor signal con guration in the original circuit. Figure 4 illustrates the idea. Note that with pass transistors multiple errors can be injected with one transistor easily. Also note that exactly one control should be 1 at a time, and when error is injected at other site, the \control to activate the good circuit" should be set to 1.
the design. Design error coverages are obtained for ATPG tests and for the assertion tests. Table 1 shows the stuck at fault coverage comparison between the two test sets, given that the fault coverage by assertion tests has been normalized to 1. Also shown is the error detection results of the two test sets. It is clear that the assertion tests outperform the ATPG tests. These results can be predicted from Table 1 since the design error models in use usually have a strong correlation to the stuck-at fault model [1]. Although it is not necessarily true, in general higher stuck-at fault coverage does imply a higher design error coverage. # of Tests Normalized SAF Results Errors Detected EXP I Errors Detected EXP II Table 1:
Normalized SAF Coverages and Error Detection
To further investigate the results, Figure 7 at the end of the paper shows the normalized fault coverage curves (with respect to the number of tests applied) for assertion tests and ATPG tests. Figure 8 shows the corresponding design error detection curves for EXP I. First observe that the shapes of the curves for stuckat faults are similar to those for design errors. Also can be seen is that ATPG tests are very e�ective for the rst 300 vectors, and then become relatively ine�ective for the remaining vectors. This is true for both stuck-at fault detection and the design error detection.
For the experiments, an eight-way set associative tag array design is selected. The control logic surrounding the memory core consists of around 5500 gates. Note that memory core and the address decoder are tested by BuiltIn Self Test (BIST) circuitry implementing certain marching algorithms [6]. ATPG tests are used to cover only the surrounding logic. Since memory core is constructed in a regular way and is usually not a major concern for validation purpose, design errors are injected only in the surrounding logic as well.
Gate Level Results
Two sets of 1023 design errors were randomly injected for the two experiments at the gate level, denoted as EXP I and EXP II. This creates 10 additional primary inputs to
Random Selected Addresses For Extra Read and 449 Write 472
1st Level Address Marching
1 Initial 63 Setup
64
448 609
4 Results
ATPG Assertion Tests 1263 682 0.8 1 728 965 809 932
473 Data Marching
Figure 5:
608
640
Tests From Other Assertions
641 Tests for Abnormal Behavior
682
Illustration of Assertion Vectors
To understand the behavior of the assertion tests, it is necessary to explain how those tests are generated rst. In Figure 5, assertion tests are divided into six di�erent blocks. The rst block is for setting the initial content of some of the array cells. Then, the next three blocks contain both address marching and data marching sequences which are generated for the two major assertions, Tag Store (write) and Tag Load (read). The fth block is for other assertions that treat the Tag as a static cache array. No marching is used here. Instead, random selected ad-
dresses are used. The last block contains tests from the control signal trees for all assertions in order to cover the abnormal functional space. It can be seen that address marching tests are less effective with respect to both stuck-at fault and design error detection. This is because no faults or errors were injected in the decoder circuitry, and hence, address marching tests which primary target on the decoder and memory cell faults are not of much use. On the other hand, all other blocks of tests are very e�ective and necessary for detecting both faults and design errors. From those curves, it is important to note that tests for abnormal functional space do detect unique faults and design errors, and hence cannot be ignored. Table 3 demonstrates the design error detection results by STE assertions. Note that in the Table an error may be detected multiple times by di�erent assertions. It is interesting to observe that these symbolic assertions do not outperform the assertion tests in number although the later are generated based upon the former. This is because the assertions considered here are constructed to verify the normal functional space only while assertion tests include vectors speci cally targeting on those abnormal space. Hence, a design error that changes the behavior of a circuit in the abnormal functional space will not be considered as a true design error by assertion veri cation. Note that assertions for design errors in the abnormal functional space can also be achieved. Assertions Store Load Others Total (EXP I) 282 758 373 964 340 929 (EXP II) 256 709
Table 5 presents the results for assertions. The results are consistent with the gate level results except that detection rates are substantially lower. Error Types Store Load Others Total Transistor 125 294 144 391 Hierarchical 134 312 178 487 Table 4:
Results of Error Detection by Assertions
4.1 Summary Figure 6 summarizes the comparison results in terms of the Venn diagrams.
Uniquely detected by assertions
Uniquely detected by assertions
(1)
(2)
ATPG (235) detected (728) (2)
(5)
Two sets of 511 errors (of di�erent types) are randomly injected, one for the transistor level design errors and the other for the hierarchical design errors described in Section 3.2. This requires adding 9 primary inputs as error injection controls. The errors were injected at the module level in the hierarchical schematic design of the tag array. Table 4 shows the comparison results between assertion tests and ATPG tests. The results demonstrate that assertion tests outperform ATPG tests consistently. Note that for transistor level design errors, the detection rate is substantially lower than the gate level cases. At the transistor level, many of the injected design errors are redundant. Error Types ATPG Assertion Tests Transistor 286 393 Hierarchical 424 491 Table 3:
Results of Error Detection at the Transistor Level
Undetected (89)
Undetected (57)
EXP I: Gate Level
Uniquely detected by both assertions and ATPG tests
EXP II: Gate Level
Uniquely detected by assertions (1) ATPG (3) detected (707)
Uniquely detected by both assertions and assertion tests
(167) (10)
Results of Error Detection by Assertions
Transistor Level Results
ATPG detected (118) (809)
Uniquely detected by assertion tests
Uniquely detected by assertion tests
Transistor + Hierarchical Design Error Detection
Table 2:
Uniquely detected by both assertions and assertion tests
Uniquely detected by both assertions and assertion tests
Figure 6:
Uniquely detected by assertion tests Undetected (134)
Summary of Error Detection
All design errors detected by the ATPG tests at the gate level were also detected by the assertion tests. However, this is not true for the stuck-at fault results shown in Table 1 and is not true for the case of transistor level/hierarchical design error either. For all cases, assertion tests and assertions together can detect all errors captured by ATPG tests. Unlike the ATPG process, generating the assertion tests is not time consuming [12]. Hence, assertion tests can be seen as an inexpensive and relatively e�ective validation method. Also note that for large arrays, STE usually requires a large amount of memory to store the OBDDs. Therefore, a more feasible validation approach for those arrays can be applying assertion tests rst and then, producing partial assertion (by reducing the number of symbols in use to reduce the OBDD size) to cover the remaining undetected errors. At the gate level, all undetected errors are redundant. This can be proved by using the ATPG tool or by manually showing that it is impossible to detect the errors. At
the transistor level, many errors can be shown redundant manually. Since the ATPG tool does not handle transistor level view, not all undetected errors can be proved to be redundant.
5 Conclusion In this paper, three di�erent validation approaches are investigated for their e�ectiveness with respect to design error detection. The results demonstrate that design error injection is a feasible approach to evaluate the quality of various validation approaches. By analyzing the undetected errors, the weakness of each method can be identi ed and improved. Our results indicate that assertion tests are relatively more e�ective and economical than the other two approaches. The STE assertions can be improved to detect more design errors if special assertions are included for all abnormal operations. However, no single method can consistently guarantee detection of all non-redundant errors.
Normalized SAF Coverages
0.9
0.7
0.5
"ATPG" "AsserTG"
63
Figure 7:
300
472 608 682 Number of Vectors Applied
1263
Normalized Stuck-at Fault Coverage Curves
0.9
Design Error Coverages
0.8
0.5
"ATPG-EXP-I" "AsserTG-EXP-I"
63
Figure 8:
300
472 608 682 Number of Vectors Applied
Error Coverage Curves (EXP I)
1263
References [1] Magdy S. Abadir, Jack Ferguson and Tomas E. Kirkland, Logic Design Veri cation via Test Generation, IEEE Transactions on Computer-Aided Design, Vol.7, No.1, January 1988. [2] Randal E. Bryant, A Switch-Level Model and Simulator For MOS Digital Systems, IEEE Transactions on Computers, Vol C-33, No. 2, February 1984, pp. 160-177. [3] Randal E. Bryant, Symbolic Simulation | Techniques and Applications, 27th Design Automation Conference, 1990. [4] Randal E. Bryant, Symbolic Boolean Manipulation with Ordered Binary Decision Diagrams, ACM Computing Surveys, Vol. 24, No. 3, Sep. 1992. [5] Neeta Ganguly, Magdy S. Abadir, and Manish Pandey, PowerPC Array Veri cation Methodology Using Formal Veri cation Techniques, International Test Conference, Washington DC., 1996. pp. 857-864. [6] C. Hunter, J. Slaton, J. Eno, R. Jessani, C. Dietz, The PowerPC603(tm) Microprocessor: An Array Built-In Self Test Mechanism, International Test Conference, 1994, pp. 388-394. [7] Charles H. Malley and M. Dieudonne, Logic Veri cation Methodology for PowerPC Microprocessors, 32nd Design Automation Conference, 1995, pp. 234-240. [8] Manish Pandey, Richard Raimi, Derek L. Beatty, and Randal E. Bryant, Formal Veri cation of PowerPCTM Arrays Using Symbolic Trajectory Evaluation, 33rd Design Automation Conference, Las Vegas, NV., 1996. [9] Manish Pandey, Richard Raimi, Randal E. Bryant, and Magdy S. Abadir Formal veri cation of Content Addressable Memories Using Symbolic Trajectory Evaluation, to appear in 34rd Design Automation Conference, 1997. [10] C,J. H. Seger Voss | A Formal Hardware Veri cation System: User's Guide, Technical Report 93-45, Department of Computer Science, University of British Columbia, 1993. [11] C,J. H. Seger and Randal E. Bryant, Formal Veri cation By Symbolic Evaluation of Partially-Ordered Trajectories, Formal Methods in System Design 6, 1995, pp. 147-189. [12] Li-Chung Wang, and Magdy S. Abadir, A New Validation Methodology Combining Test and Formal Veri cation for PowerPC TM Microprocessor Arrays, in International Test Conference, 1997.