Mathematics and Computer Science Department ... vious algorithm for optimal node splitting re- ... the first proposal for building an R-tree consists of sim-.
On Optimal Yvh
J. Garcia R.
Node Splitting Mario A. L6pez
for R-trees * Scott T. Leutenegger
Mathematics and Computer Science Department University of Denver, Denver, CO 80208-0189 {ygarcia,mlopez,leut}@cs.du.edu
optimal splits our method results in improvements of up to 120% over the leading standard.
Abstract The problem of finding an optimal bipartition of a rectangle set has a direct impact on query performance of dynamic R-trees. During update operations, overflowed nodes need to be split (bipartitioned) with the goal of minimizing resultant expected query time. The previous algorithm for optimal node splitting requires exponential time. One contribution of this paper is a polynomial time algorithm for finding optimal bipartitions for any objective function whose value depends exclusively on the bounding hyper-rectangles of the ensuing partitions. The algorithm runs in O(nd) time where d > 1 is the number of dimensions of the input. Experimental studies indicate that the use of optimal splits alone results in improvements of query performance of only between 5% and 15% when compared to other heuristics. Thus, a second contribution is to demonstrate the near optimality of previous split heuristics, a fact that suggests that research should focus on global rather than local optimization issues. Finally, we propose a new dynamic R-tree insertion method that uses a more global restructuring heuristic when processing node overflows. When coupled with
1
This work has been partially supported by the National Science Foundation under grant IRI-9610240 and by the Colorado Advanced Software Institute under grants m-96-05 and ‘IT-9706. Permission to copy without fee all or part of this material is granted provided that the copies are not made or distributed for direct commercial advantage, the VLDB copyright notice and the title of the publication and its date appear, and notice is given that copying is by permission of the Very Large Data Base Endowment. To copy othemise, or to republish, requires a fee and/or special permission from the Endowment. Proceedings New York,
of the 24th USA, 1998
VLDB
Conference
334
Introduction
A search for spatial objects that satisfy a given multidimensional query is one of the most frequent operations in areas related to spatial databases. Geographic information systems, computer-aided design, computer vision and robotics, temporal and scientific databases, and multi-keyed indexing for traditional databases are examples of such areas. R-trees [Gut841 were developed as an index structure that allows the efficient execution of multidimensional queries. Although this structure is based on (hyper-) rectangles with sides parallel to the axes, arbitrarily shaped objects can be handled by operating with their minimum bounding boxes. R-trees are dynamic data structures that can be updated incrementally. Efficient insertion and deletion algorithms are provided by Guttman [Gut84]. Thus, the first proposal for building an R-tree consists of simply inserting one record at a time until the input data is exhausted. Guttman’s insertion algorithm operates by identifying a leaf to host the new record and updating its ancestors accordingly. An insertion to an already full node is handled by creating a new sibling to the full node and partitioning the rectangles of the full node plus the new record into two sets which are then stored in the new and previously full node, respectively. Note that insertion of the new sibling may require further splits along the path of ancestors of the previously full node. Since splits are the sole mechanism for creating nodes, these splits shape the resulting R-tree and affect its future query performance. Other dynamic approaches have been proposed [BecSO, Kam94, Se187]. Guttman presented splitting algorithms with linear, quadratic, and exponential time complexity. He showed that the quadratic algorithm resulted in significantly better performance than the linear. Further-
more, he argued that the exponential algorithm was best, but due to its time complexity was not practical and hence only presented results for a limited number of small tests. One of the main contributions of this paper is the development of a polynomial time splitting algorithm that is provably optimal, i.e. equivalent to Guttman’s exponential algorithm, for a given objective function. Thus, we have reduced the complexity of the optimal splitting algorithm from exponential to O(nd), where d > 1 is the number of dimensions of the input data. In our experimental results we choose minimization of the expected number of node accessesas stated in [Kam93] (i.e., A + qz * L, + L, +pa,+ qz . qar* N, where A,LmL,,qz,q,, N axe the sum of areas, sum of node extents in x, y, extents of query in x,y and number of nodes respectively). Note that for point queries it is just the sum of areas. The other major contribution of this work is a new R-tree insertion scheme which we call SIBLINGSHIFT (or simply SHIFT). We couple the optimal split algorithm with our SHIFT insertion method and show that resultant query performance can be significantly superior (up to a factor of 2.2) to that of Hilbert R-tree (the current best dynamic algorithm) even though it results in a slower insertion operation (on average by a factor of 2). Furthermore, we show that using splitting algorithms based on sweep-line over coordinates per axis or Hilbert values with our SHIFT framework does not work as well as when our optimal split algorithm is used. The remainder of the paper is organized as follows. Background information on R-trees and descriptions of the algorithms considered are presented in Section 2. We introduce our proposed optimal splitting algorithm with its analysis in Section 3, and our new insertion method in Section 4. In Section 5 we describe our experimental methodology and present results for both real and synthetic data sets. We conclude in Section 6.
2
The R-tree
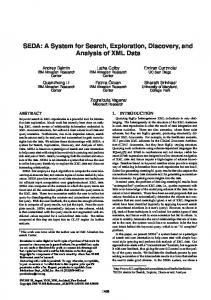
rectangle (MBR). The algorithms extend to higher dimensions in a straight forward manner, but to keep the exposition clear we only consider the 2-dimensional case. An R-tree node is allowed to hold between m and M (R,P) pairs. If the node is a leaf, R is the minimum bounding rectangle (MBR) of the actual database object pointed to by child pointer P. Otherwise, R is the MBR of all rectangles stored in the subtree pointed to by P. Note that: (a) rectangles at any level may overlap, (b) an R-tree created from a particular set of objects is not guaranteed to be unique and (c) every descending path in the tree is a sequenceof nested rectangles with the last one containing an actual database object. A query region Q is satisfied by retrieving and examining each rectangle that intersects Q at every level. A recursive procedure descending the tree from the root through possibly several paths suffices for this retrieval. To process a node, out of the rectangles it stores, those intersecting Q are retrieved. For non-leaf nodes, a recursive search is requested on child nodes of the retrieved rectangles. The retrieved rectangles of the leaf nodes are simply reported. For the rest of the paper we assume that exactly one node fits per disk page and the terms node and page will be used interchangeably. An example of the graphical layout of the input rectangles and the MBR boundaries as well as the Rtree node structure is shown in Figure 1. 2.2
Insertion
Algorithm
1. Choose the leaf L where to place new record R 2. if there is room in L for data item R insert it, otherwise split the entries in L with R into two
subsets, one will become the entries of a newly created leaf L’, and the other will remain as the only entries for L.
and Its Algorithms
3. Propagate MBR changes upward from L (and the MBR of L’ along with a pointer to L’ if a split
was done). 4. If the propagation resulted in a split of the root,
create a new root whose children are the result of the old root split.
The R-tree
An R-tree is a generalization of the B+-tree developed for efficient processing of intersection queries on spatial databases. R-trees keep a set of (hyper-) rectangles and allows the handling of arbitrarily shaped objects by representing each one with its minimum bounding
General
Guttman’s general insertion algorithm proceeds as follows:
In this section we provide an overview of the R-tree and include the original insertion algorithms proposed by Guttman. We then briefly describe the Hilbert R-tree dynamic insertion algorithm. Readers familiar with this background material should skip to section 3. 2.1
Guttman’s
The leaf is chosen recursively descending from the root to the branch with the subtree whose MBR needs the smallest area enlargement to include the new record. Ties are solved by choosing the smallest resulting MBR area. 335
is the MBR area increase to include the entry in the node. To finish the split, assign the entry with highest difference of assignment costs until entries exhaustion. The node where to place the entry is decided as it is for Linear. 3. Exponential: (Exhaustive) Generate all possible groupings and chose the best. 2.3
Figure 1: R-tree Example.
Input data are filled rectangles. Node MBRs boundaries are a little bigger to differentiate them. & is an example of a query region.
After insertion, changes are propagated to the root. First, the MBR in the parent’s entry for L is updated. In case that there was an split, either the MBR of L’ is inserted as a new entry in the parent if there is room, or an split is done with the parent node entries and the new MBR otherwise. Guttman proposed three ways to split a node, and differentiate them by their time complexity which were linear, quadratic, and exponential. The split procedure was trying to solve the bipartition of a set of rectangles with an minimum value for the sum of the areas of the MBRs of the ensuing parts. The three split algorithms are: 1. Linear: Chose two seeds, one for each resultant node, whose normalized distance in some dimension is greatest. For each remaining entry, assign it to the part that needs the least MBR area enlargement with ties being solved by the least MBR area, then the fewer entries, or any if no solution is found. 2. Quadratic: First, chose two seeds by considering all pairs of entries and determining the most wasteful if put together. The waste of grouping entries El and Ez is computed as the area of the MBR of El and Es minus the areas of El and Ez. The cost of assigning an entry to one node
The Hilbert
R-tree
Proposed by Kamel and Faloutsos in [Kam94], this is a data structure based on the R-tree and an ordering of the leaves imposed by the Hilbert value. The Hilbert value is the length of the fractal space filling Hilbert curve from the origin up to the point the value is to be computed of. In brief the R-tree internal nodes are augmented to hold the largest Hilbert value of its descendant leaves. Insertion algorithms are guided by these Hilbert values. As a result, the leaves are sorted by Hilbert value. Another addition in the Hilbert Rtree, is the idea of creation of new nodes (splits) only when s neighboring sibling are full and a new record is to be inserted in one of them. If s neighboring siblings are not full overflow entries are evenly distributed among all s “cooperative” siblings. In our implementation we used the 2-to-3 split as it is purported to be the best compromise in time versus space utilization. According to [Kam94], the Hilbert R-tree is currently the best dynamic R-tree variant.
3
The Bipartition
Algorithm
In this section, we begin by proving some basic results essential for the correctness of our algorithms. Then, we present the basic algorithm, analyze its complexity and modify it to derive a solution subject to the partitions having specific cardinalities. We simplify the presentation by discussing only the 2 dimensional case. Generalizations to higher dimensions are straightforward. For the rest of the paper, we use the notation in Table 1. The u-th defining value of a rectangle is simply the extreme value (i.e., maximum or minimum) of the u-th coordinate over all points contained in the rectangle. 3.1
Properties
of Optimal
Bipartitions
It is easy to see that the number of bipartitions of a set of n rectangles is exponential in n. However, many of the candidate bipartitons share the same pair of MBRs since the rectangles not touching the MBR boundary do not play a role in defining it. We show that for a cost function depending only on the MBRs the number of different MBR pairs is polynomial. Thus, in searching for an optimal bipartition, it suffices to consider only a polynomial number of them. 336
For example, f (A, B) = area(A) + area(B) and g(A, B) = perimeter(A) + perimeter(B) are both ex-
Table 1: Notation S
n 2dG G c u,R ; Y Y
tent monotone functions. Now, with the help of the following result, the number of MBR pairs to evaluate is only O(n2) when optimizing an extent monotone function.
set of input rectangles cardinality of S MBR of S MBRs from a bipartition of S rectangle’s uth defining value R’s uth defining value defining value for R’s min. X defining value for R’s max. X defining value for R’s min. Y defining value for R’s max. Y
Theorem 1 Let cost(Ro, RI) be an extent monotone bnction. It sufices to consider O(n2) pairs when finding a bipartition that minimizes the value of cost(., .).
Lemma 1 The number of different MBRs from subsets of a set of n rectangles is at most n4.
An MBR is defined by 4 values. Since there are n input rectangles, there are at most n different ways for selecting each of these values. 0 Accordingly, since a bipartition requires two MBRs, the total number of MBR pairs to evaluate is at most ng. We can now further reduce the number of candidate pairs.
Proof
Definition 1 Considering the notation in Table 1, RQ or RI is called an anchor MBR if it shares at least two of the defining values of R,. The values thus shared with R, are called anchoring defining values. Lemma 2 Every pair RQ, R1 of MBRs for a bipartition of S contains an anchor MBR and there are O(n2) different anchor MBRs. Proof Each of the four values defining R, has to be present in either & or RI. Therefore, at least one of (&, RI } has to share at least two of the four R, defining values. There are only ( : ) = 6 different ways for selecting a pair of R, defining values. For a fked pair of such values, only two other values are needed to complete the definition of an anchor MBR with only n choices for each value. Therefore, there are at most 6. n *n different anchor MBRs. 0 Since at least one MBR must be an anchor, the number of MBR pairs to evaluate is at most O(n2 en”). This number is even lower for particular cost functions, as shown below. Definition 2 Let A and B be rectangles. A function f (A, B) is said to be extent monotone if f increases monotonically with increases in either the x-extents or y-extents of either A or B. In other words f (A, B) increases whenever one of {CX,A - &,A, CY,A - c#,A, C&B - C&B, cy,g - Cy,B} ah increases.
337
Proof First we note that for a given MBR Z&-,,the optimal value for co&(&, RI) can be obtained from RQ and a RI that is the MBR of those input rectangles not totally contained in I$-,. This is obvious from the fact that any other RI will have a bigger extent and therefore, a higher co&(&, RI). Without loss of generality assume that & is an anchor MBR. It follows that only O(n2) values of RQ and hence O(n2) candidate MBR pairs need to be considered. 0 We note that our claims, suitably modified, also hold whenever f is not extent monotone but -f is. 3.2
The Basic Bipartition
Algorithm
The basic algorithm operates by going thru each of the O(n2) pairs of MBRs and remembering the one with the best value for the given extent monotone cost function. Once the two MBRs that provide the best cost are found, then each input rectangle is assigned to its corresponding MBR. Rectangles contained in the intersection of the best MBR pair are assigned following a given criteria (for example, to the MBR that has the least number of rectangles assigned so far). The basic algorithm is presented in Figure 2. We compute the MBR RI corresponding to an anchor MBR Ro as the the MBR of the input rectangles that are outside (even partially) of &. Definition 3 For a given Ro, Let C, be the u-th defining value of &. Let H be the open half-plane defined by C, and not containing &. the MBR complementary to & with respect to C, is defined as the MBR of the inpult rectangles intersecting H.
An example of the MBRs complementary wrt to all defining values of an MBR & is shown is Figure 3. Clearly, RI is just the MBR of the set of MBRs complementary to & with respect to each bounding value defining fi but not defining R,. The preprocessing step computes the complementary MBRs so that the computation of RI (wrt each anchor &) inside the triple loop of Figure 2 can be done in constant time. Since the outer loop performs O(1) iterations the total time is O(n”) as desired. When building the complementary MBRs, if the defining value C,, is Cx or Cy, i.e., a maximum (resp.
{Preprocessing} For each one u of {z, y, X, Y} Sort all the C,,s Incrementally build the MBR complementary wrt C,, as the MBR of previous C, in the ordering and said Chs rectangle (where previous is subject to the way the ordering is traverse). {Evaluate all relevant MBR pairs} For each pair {CU,CY} of R, defining values to consider (6 possible pairs) For each value of coordinate C, ( u differ from U and V ) For each value of coordinate C, ( where v differs from U,V, and u ) Let Ro be the rectangle {CU, Cv, C,,C,} If RQ is a proper MBR (i.e. each border is touched by at least one interior input rectangle) then Let R, be the MBR complementary to I& wrt C,, Let R, be the MBR complementary to Ro wrt C, Let RI be the MBR of & and & Remember &J, RI if cost(&, RI) is better than the optimal cost {classify input rectangles by optimal MBR pair} assign it to the MBR that For each input rectangle, it or to any in case of ambiguity.
Figure 2: The basic optimal
bipartition
totally
so far
contains
algorithm
C, or C,, i.e., a minimum) then the input list is traversed in descending (resp. ascending) order. Notice that the sorting step takes O(nlogn) time and the traversal is linear, so, the quadratic complexity of the whole bipartition algorithm holds. A simple generalization of this algorithm solves the optimal bipartition problem for any fixed d > 1 number of dimensions with running time of O(nd). The algorithm for d dimensions will iterate over d-tuples of rectangle defining values for each d-tuple of anchoring defining values. 3.3
R,
P 3
Ro
Figure 3: R, is the MBR complementary to Z&, wrt CX,Ro I and R, is so wrt CY,R,,. The values C%,R~ and CV,~,, are not considered values with R,.
since &
shares those
338
Imposing
Cardinality
Constraints
The previous (unconstrained) algorithm may result in partitions with very different cardinalities. Node splitting often requires partitions with roughly the same number of rectangles. We refer to this as a bipartition with cardinality constraint, where R,J (resp. RI) must contain a number of rectangles in a user specified range. A simple brute force approach that runs in O(n3) time would compute the cardinality of both Rc and RI with each iteration of the innermost loop of Figure 2. However, a few changes to the basic algorithm are sufficient to compute bipartitions with cardinality constraints while preserving the quadratic run-
I
1
I Figure 5: MBR R with 4.3,2, and 1 R, defining values. values. The cardinality of R is that of any of its corners which is not a corner of R,.
Three
Two values. We call a corner interior if it is strictly inside R, (i.e., not on the boundary of RB). If R haa an interior corner, its cardinality is that of said corner. Otherwise, the cardinality of R is the
sum of the cardinalities of any two (non-interior) corners of R in the same R, edge minus n. One value. Clearly R has two interior corners. Let P be a corner obtained as the point of intersection
Figure 4: For corner C+, Cy,z of rectangle 2 (upper left corner), Q is the MBR containing rectangles 2, 5 and 7. The corner cardinality is 5. Note that the z, Y corner of rectangle 3 is not counted as it is outside Q.
between the line through the two interior corners of R and the boundary of R,. The cardinality of R is simply the sum of the cardinality of its two interior corners minus the cardinality of P.
ning time. The first change we will need is to check that the range of cardinalities of Ro and RI are valid before evaluating their cost. We specify range since rectangles in Ro n RI can be assigned to either of & or RI. Notice that said test requires the cardinality of the intersection which is easily computed as the sum of both cardinalities minus n. horn now on we consider only the maximum cardinality of Ro and RI. To preserve the quadratic complexity, the cardinality test usesprecomputed information which we proceed to define: Defhition 4 Let R be an h4BR and (G,R, CV,R) one of the corners of R. Let Q be the rectangle defined by said corner and a corner of R, such that R fl Q = R. The corner cardinality of Q, denoted Card[C,,R, CV,~], is the number of input redangIe corners of the same orientation (e.g. top left) contained
in Q. Figure 4 illustrates how to compute Q and corner cardinality for the upper left corner of rectangle R = 2. Consider now the problem of computing the cardinality of R. We consider 5 cases depending on the number of defining values of R, shared by R (see Figure 5): That means that R = R,. Clearly, the cardinality of R is n and its pairing MBR has cardinality 0.
Four values.
339
No value. This caSecan be generated by the algorithm only if R’s pairing MBR is a four-values case containing all n input rectangles (Note that R is not an anchor MBR). So, the cardinality for this case is 0. Assuming that Card&, C,,] is available in constant time, the cardinalities of a pair &, RI can be obtained without affecting the time complexity of the basic bipartition algorithm (given in Figure 2) as long as any additional preprocessing does not exceed such running time. The addition to the preprocessing step that allows to have the cardinality of the corners available in constant time is presented in Figure 6 (to be done just after the original preprocessing). Again, previous0 is subject to the order of traversal. The ordering is traversed in such a way that the first value is the closest to the global corner diagonally opposed to the ‘one being filled up (for example, if the process is creating Card[C,, C,], then the first values correspond to the max C, and max C,). It suffices to have a series of linearly built cross references in order to know to which rectangle a given coordinate belongs to. The last addition to the preprocessing step imposes a quadratic complexity due to the double for loop of n elements each. That implies that the overall complexity for the bipartition algorithm still holds. One final modification to the basic algorithm concerns the classification of the input rectangles. The
For each pair u,v of possible corners indices (4 pairs) For each C, in the proper order Let count be zero For each c, in the proper order If c,, and c, belong to the same rectangle then increment Assign count to Card[C,,,C,,] If there is a previotu(c,) then Increment Card[C”, C,,] by Card[previous(C,), C,,] If there is a previow(c,) then decrement Card[previous(C,,), prewious(c,)]
Figure 6: Computing rectangles that are not in the intersection of the resulting MBRs should be done first. Each of these rectangles goes to the MBR that contains it. Then, the assignment of the rest of the input rectangles (the ones in the intersection of & and RI) should be done one at a time to either the MBR that contains the least number of assignments when possible or to any otherwise.
4
A High rithm
Utilization
Insertion
Algo-
In this section, we describe our insertion method for a dynamic R-tree. Then, we briefly explain the other two splitting algorithms aside from the optimal bipartition used in combination with our insertion method. Two orthogonal splitting issues impact search performance: (1) minimization of some objective function (such as area or perimeter) of the split algorithm and (2) node utilization. Previous work has shown that improving space utilization, i.e., maintaining a higher occupancy per node, can improve the resultant search performance. Thus, even if a split algorithm provides optimal splits with regards to the objective function, further improvements can be made by maintaining high node utilization. The Hilbert R-tree [Kam94] achieves improved node utilization by using 2-3 splitting. In addition to the split algorithm (local optimization), overall tree structure (global optimization) has The a significant impact on search performance. superior performance of packing algorithms [Rou85, Kam93, Leu97] is attributable to both better node occupancy and better tree structure. The dynamic Hilbert R-tree not only achieves good overall node utilization, but also improves overall tree structure by following the Hilbert order.
340
count
corners cardinality
We have devised a new dynamic algorithm incorporating improved node utilization and improved tree restructuring. Our new insertion algorithm, called SHIFT, only creates a new node if no sibling can be found to absorb one of the subsets created by a split. In addition, the SHIFT algorithm improves overall structure by heuristics designed to reorganize entries among siblings. The algorithm selects the insertion path by greedily choosing at each node the branch that optimizes a given cost function. (The objective function used in our experiments is the expected number of node accesses as described in [Kam93].) Furthermore, our algorithm differs from other solutions in the way that node overflows are handled. If a node is full, it is split into two sets. One set remains in the node and the other set, say set B, is inserted into one of the node’s siblings. The sibling is chosen so as to minimize the given objective function. If the chosen sibling can not accommodate the entire set B the sibling is likewise split. This continues until either a sibling that can accommodate the offered rectangle set is found or all siblings have been tried and failed. In the later case, a new node is created and an entry put in the parent node. This insertion into the parent node is handled recursively. We now describe in detail our approach for inserting into a full node. For simplicity, we use the same symbol to denote both a node as well as the set of rectangles stored in that node. Let E be a node into which we wish to insert a set of rectangles R. Initially R is a single rectangle, but, as discussed below, subsequent iterations may require the insertion of more than one rectangle. Let P be the parent of E (we discuss the root node later). Initially, flag E as dirty and all its siblings as clean. There are two cases to consider depending on whether or not E has enough
room for R. If E has no more than M - ]RI rectangles, add R to E and stop. Otherwise, split the rectangle set E U R using a splitting algorithm (e.g., optimal bipartition). This results in two rectangle sets, E, and Eb, one set to remain in node E, the other to be inserted into a sibling node. Among siblings of E, find the clean node F, (resp. Fb) whose cost increases the least when including E, (resp. Eb). Without loss of generality, assume that the cost of Fb increases less than that of F,, i.e., cost(MBR(F,UE,)) -cost(Fa) > cost(MBR(Fb U Eb)) - cost(&). Mark Fb’s entry as dirty. To complete this iteration and proceed with the next one, the entry for E is updated to be associated with E,, reset E to be the entry for Fb and reset R to Eb. Now repeat the splitting of the new E by inserting the new R into E. Continue until a node that can accommodate R is found, or all siblings have been tried and failed. Note that a true split (i.e. an increase in the number of entries of P) occurs only when no clean sibling of E is found to absorb R, in which case a new node is created for R. Also note that an overflow of the root node always results in a split since the root has no siblings. In the worst case, an insert into a full node could require M - 1 disk accesses(one for each sibling). However, our experimental results in Section 5 show that SHIFT insertions are on average 2 times slower than Hilbert insertions and never more than 2.86 times slower. This is because few insertions require splitting of the node. When a split is required it may require up to M - 1 disk accesses,but this cost is amortized across all insertions. Note that our method for dealing with overflow is orthogonal to the actual split algorithm used. Thus, we consider the following three combinations of SHIFT and splitting algorithm:
SHIFT-HILBERT and SHIFT-COORD. In addition, we evaluate the performance of Guttman’s insertion algorithm [Gut841 under two different splitting policies: Guttman’s quadratic splitting (GUT) and optimal splitting (OPT). 5.1
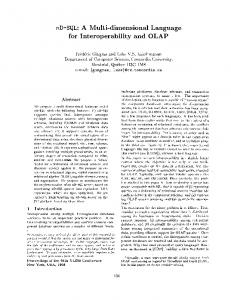
We implemented all R-tree algorithms, assuming the maximum number of M entries per node to be 100, and present results from both synthetic and real data. All data sets were normalized to fit within the unit square for ease of study. We consider the following data sets: TIGER: This is the Long Beach data set coming from the TIGER system of the U. S. Bureau of Census. This data set of 53,145 rectangles has been extensively used in past studies. VLSI: A CIF data set of 97,069 rectangles provided by Bell Labs from the design of a chip [Lop96]. Its highly skewed distribution makes this data set of particular interest. UNIF: This is a synthetically generated set of 50,000 squares with a uniform distribution of areas and center point locations. Rectangle area is uniformly distributed between 0 and 2 . a, where a = &. The lower-left corners are uniformly distributed within the unit square. The upper right corner is chosen to give the desired area and it is truncated by the boundaries of the unit square when it does not fit. CLUSTER: This synthetic data set is created by fixing rectangle locations, areas and aspect ratios (quotient of the smaller extent over the greatest) so as to make it irregular. The rectangle centers are generated beginning with a random number numReg (between 0 and 50) of rectangular regions with uniform distribution of areas (such that the overall sum is 1). Then, for each region, (]5O,OOO/numReg] - 1) points are uniformly distributed inside the region. A total of 50,000 points is completed with uniformly distributed locations over the entire unit square. A sample distribution is shown in Figure 7. Areas and aspect ratios are generated by uniform distributions. An additional uniformly distributed random variable was used to determine with equal probability whether the rectangle is wide or tall.
a SHIFT-COORD: The splitting is done by passing a sweep-line by each axis, and remembering the rectangle center value that provides the minimum sum of cost for the MBRs of the partitions left at each side of said value. l
l
5
SHIFT-HILBERT: Same as before, but Hilbert values are used instead of rectangle defining values. SHIFT-OPTIMAL:
Experimental
Using the optimal split.
Results
In this section we present our experimental methodology and the obtained results. Since Hilbert R-trees are the current state of the art in low dimensional R-trees, our main focus is on comparing four algorithms: Hilbert R-trees (HILB), SHIFT-OPTIMAL,
Methodology
As shown in [Leu98], the number of disk accesses given a specific buffer size is a more meaningful performance metric than number of nodes accessed. Thus, we implemented an LRU buffer used in conjunction 341
Table 2: Disk accesses for tiger data Method HILB GUT OPT
Figure 7: Regions of concentration
of points
with a raw disk partition, to prevent false buffering by the OS, and report the number of disk accessesfor various buffer sizes. Specifically, we consider buffer sizes of 10, 25, 50, and 100 pages. For the VLSI data set, this represents roughly l%, 2.5%, 5% and 10% of the final R-tree. For the other data sets, the corresponding percentages are 2%, 5%, 10% and 20%. Each presented data point is obtained from averaging 10,000 point queries uniformly distributed within the unit square. 5.2
Results
We first consider a comparison without the SHIFT heuristic. We compare Hilbert R-trees (HILB), Guttman’s quadratic (GUT), and Guttman’s insertion algorithm using optimal splitting (OPT). Different values of node utilization affect overall R-tree performance as previously shown in [BecSO].To address this we consider minimum node occupancies of 0,10,20,40, and 50% of M. Therefore, we used the full version of the optimal bipartition algorithm with cardinality constraints. In Table 2 we present results for the tiger longbeach data set. There is a column for each buffer size and a row for each method. For the OPT algorithm there is also a line for each node utilization considered. First, compare the number of disk access of the quadratic algorithm (GUT) with the optimal split algorithm with node utilization of 50% (OPT 0.5). In general there is very little’difference (less than 15%) in resultant query performance. Thus, there is little gain from optimal splitting. This is becausethe initial splits have a profound impact on final Rtree structure, and a specific split only considers one node, not the whole
m/M
25 0.7572 0.8754
50 0.6355 0.6555
0.5390 0.5464
0.50 0.40 0.20
10 1.0958 1.1921 1.0939 1.0131
0.7710 0.7161
0.6009 0.5652
0.5306 0.4934
0.9259
0.6467
0.5255
0.4598
0.10 0.00
0.9280 1.0277
0.6555 0.7191
0.5316 0.5481
0.4667 0.4749
100
tree. A split that is optimal for the node in question may actually cause global structure to be worse than a suboptimal split. These results indicate that optimal splitting of a node, a local optimization problem, does not necessarily improve global tree structure. Thus, improving overall tree structure is better done by other methods. Possible methods include increasing the amount of freedom during splitting by allowing under-filled nodes [BecSO], using packing algorithms [Rou85, Kam93, Leu97], or taking into consideration more global properties of the tree such as the forced reinserts of the R* tree [BecSO]and the Hilbert ordering structure of the Hilbert tree [Kam94], or the restructuring of our new SHIFT algorithm. To improve tree structure we first consider allowing under-filled nodes, thus allowing more split choices to be considered. Table 2 shows that query performance can be improved by lo-45%, but that the determining the “optimal” minimum utilization is not straight forward. Note, Beckmann et al suggest a minimum utilization of 40% works well in practice, but for the tiger data we have found a minimum of lo-20% works best. Thus, allowing more freedom in split choices, at the expense of worse node utilization can actually improve search performance. We now consider the opposite approach: increasing node utilization by using our SHIFT insertion framework. As a reminder, this policy not only improves node utilization, but also restructures sibling nodes by trying to find a new home for the newly split portion of the node. We first consider the relative insertion speed of the SHIFT family versus Hilbert R-trees. In Table 3 there is a row for each data set used in our experiments. The first and second columns are for the total number of node accessesperformed during the construction of the tree for SHIFT and HILB respectively. The last column, is the node accessratio of SHIFT over HILB. For SHIFT, we took the worst caseout of the three combinations of splitting algorithms (SHIFT-OPT, SHIFTHILB, SHIFT-COORD). SHIFT is never more than 2.86 times slower than HILB. Below we show that this slower insertion speed is justified by faster search 342
disk accessesthan the Hilbert R-tree. Next consider results for the VLSI data set. In Table 6 we see that SHIFT-OPTIMAL is best overall and requires up to 2.2 times fewer disk accessesthan Hilbert.
speeds. Table 3: Relative insertion speed
Table 6: Improvement
SHIFT-OPTIMAL
Table 7: Improvement
Table 4: Node utilization
algorithm HILB SHIFT-COORD SHIFT-HILBERT
data set 1 Shift ) Hilb ) Min 1 Min/Shift 1 Min/Hilb Tieer 1 580 1 628 1 539 1 0.9293 1 0.8582 VLSI 1043 1137 982 0.9415 0.8637 Unif 555 572 506 0.9117 0.8846 Cluster 545 579 506 0.9284 0.8739
Table 5: Improvement algorithm HILB SHIFT-COORD SHIFT-HILBERT SHIFT-OPTIMAL
for TIGER
(buffer size=lO)
size=lO)
~1
Since SHIFT is geared towards better node utilization, we compare the number of nodes in the R-trees built by SHIFT, HILB and a packing algorithm (MIN) which results in the minimum number of nodes needed for the tree. Those numbers corresponds to columns 1, 2, and 3 respectively in Table 4. Columns 4 and 5 are the ratios (column 3 / column 1) and (column 3 / column 2) respectively. The SHIFT framework achieves a better utilization than HILB.
Finally, we present the relative query improvement of SHIFT-OPTIMAL over SHIFT-HILBERT, SHIFTCOORD, and HILB as the ratio average of number of disk accessesof each algorithm over SHIFTOPTIMAL. The first rows are the ratio of each competing algorithm. The last row is the actual number of disk accessesfor SHIFT-OPTIMAL from which actual performance of each algorithm can be derived. We experimented with square queries with sides of length 0.0 (point query), 0.01, 0.1, and 0.3 generated in a manner similar to that for the UNIF data set. There is a column for each query side length. Choice of buffer size did not affect the relative performance so we only consider one buffer size for each experiment.
for VLSI (buffer
SHIFT-OPTIMAL
3.16
4.24
21.36
for UNIF (buffer
87.24
size=lOO)
Disk accesses ratio 0.01 0.1 0.3 1.00 1.02 1.02 1.05 1.15 1.17 1.27 1.16 1.09 Actual disk accestxa I 1 1.34 1 1.87 1 10.14 1 44.61 0.0 0.98 0.99 1.28
Next consider the UNIF data set. In Table 7 we see that SHIFT-OPTIMAL is slightly better than the other methods but there is not a significant difference. We surmise that the uniformity of the data set makes it easy for all of the methods to structure the tree effectively. Finally, consider the results in Table 8 for the CLUSTER data set. SHIFT-OPTIMAL requires 8% 45% fewer disk accessesthan Hilbert, but for point queries SHIFT-COORD is marginally better than SHIFT-OPIMAL. In general, SHIFT produces trees requiring significantly fewer disk accessesthan Hilbert. Furthermore, SHIFT-COORD works better than SHIFT-OPTIMAL for small queries and the reverse is true for large queries.
Disk accwes ratio 0.0 0.01 0.1 0.3 1.34 1.26 1.12 1.10 0.85 0.93 1.07 1.13 1.54 1 1.40 1 1.13 1 1.06 Actual disk accesses 0.82 1 1.33 [ 10.95 1 54.54
Table 8: Improvement
Consider first the TIGER data set results. In Table 5 we seethat SHIFT-COORD works best for small queries and SHIFT-OPTIMAL works best for larger queries. SHIFT-OPTIMAL requires 10% - 34% fewer 343
for CLUSTER
(buffer size=25)
6
Contributions
and Conclusions
In this paper we have made the following tions: l
l
l
l
l
l
[Leu97] contribu-
We have reduced the time complexity of optimal bipartition of a set of 2 dimensional rectangles (node splitting) from exponential to O(n2). The optimality is measured by a fairly general userdefined objective function.
Lopez, [Lop961
M.A., Janardan, R., Sahni S., “Efficient Net Extraction for Restricted Orientation Designs”, IEEE i?ansactions on Computer-Aided Design, vol. 15, no. 9, p. 1151-1159, September 1996.
We have generalized the O(n2) optimal bipartitioning algorithm to handle constraints of partition cardinality range (node utilization).
[Rou85]
We have generalized the optimal bipartitioning algorithm for a fixed number d > 1 of dimensions for which the complexity is O(n”).
Roussopoulos, N, Leifker, D., “Direct Spatial Search on Pictorial Databases Using Packed R-trees,“, Proc. ACM SIGMOD, May 1985.
[Se1871 Sellis, T., Roussopoulos, N., Faloutsos, C., “The Rf Tree: A Dynamic Index for Multidimensional Objects,” Proc. 13th International Conference on Very Large Databases, p. 507-518, September 1987 (VLDB-87).
We have provided empirical results which show that optimal splitting alone results in R-trees whose query performance is up to 15% better than Guttman’s quadratic algorithm. We have devised a new insertion framework called SHIFT and show that when SHIFT is combined with optimal splitting resultant trees provide up to 120% improvement relative to Hilbert R-trees. We have also shown that SHIFT works best when coupled with optimal bipartition instead of other splitting algorithms.
References [BecSO] Beckmann, N., Kriegel, H.P., Schneider, R., Seeger, B., “The R*-tree: an Efficient and robust Access Method for Points and Rectangles ;” Proc. ACM SIGMOD, p. 323-331, May 1990. [Gut841 Guttman, A., “R-trees: a Dynamic Index Structure for Spatial Searching,” Proc. ACM SIGMOD, p. 47-57, 1984. “On Packing [Kam93] Kamel, I., Faloutsos, C., Proc. 2nd International ConferR-trees”, ence on Information and Knowledge Management, p. 490-499, Arlington, VA, November 1993 (CKIM-93). “Hilbert R[Kam94] Kamel, I., Faloutsos, C., An improved R-tree Using Fractree: Conference on tals” , Proc. International Very Large Databases, 1994 (VLDB-94). [Leu98]
Leutenegger, S.T., Lopez, M.A., Edgington, J., “STR: A Simple and Efficient Algorithm for R-Tree Packing “, Proc. 13th International Conference on Data Engineering, p. 497-506, 1997 (ICDE97).
Leutenegger, S.T., Lopez, M.A., “The Effect of Buffering on the Performance of R-Trees”, Proc. 14th International Conference on Data Engineering, 1997 (ICDE97). 344