In recent years, privacy-preserving data mining has become an important ... amount of focus on privacy-preserving data collection and mining methods in recent.
On Static and Dynamic Methods for Condensation-Based Privacy-Preserving Data Mining Charu C. Aggarwal IBM T. J. Watson Research Center and Philip S. Yu IBM T. J. Watson Research Center
In recent years, privacy-preserving data mining has become an important problem because of the large amount of personal data which is tracked by many business applications. In many cases, users are unwilling to provide personal information unless the privacy of sensitive information is guaranteed. In this paper, we propose a new framework for privacy-preserving data mining of multi-dimensional data. Previous work for privacy-preserving data mining uses a perturbation approach which reconstructs data distributions in order to perform the mining. Such an approach treats each dimension independently and therefore ignores the correlations between the different dimensions. In addition, it requires the development of a new distribution-based algorithm for each data mining problem, since it does not use the multi-dimensional records, but uses aggregate distributions of the data as input. This leads to a fundamental re-design of data mining algorithms. In this paper, we will develop a new and flexible approach for privacy-preserving data mining which does not require new problem-specific algorithms, since it maps the original data set into a new anonymized data set. These anonymized data closely match the characteristics of the original data including the correlations among the different dimensions. We will show how to extend the method to the case of data streams. We present empirical results illustrating the effectiveness of the method. We also show the efficiency of the method for data streams. Categories and Subject Descriptors: H.2.8 [Database Management]: Database Applications General Terms: Databases, Privacy Additional Key Words and Phrases: Privacy, Data Mining, k-anonymity
1.
INTRODUCTION
Privacy-preserving data mining has become an important problem in recent years, because of the large amount of consumer data tracked by automated systems on the internet. The proliferation of electronic commerce on the world wide web has resulted in the storage of large amounts of transactional and personal information Author’s address: Charu C. Aggarwal and Philip Yu, IBM T. J. Watson Research Center, 19 Skyline Drive, Hawthorne, NY 10532, USA, { charu, psyu }@us.ibm.com Permission to make digital/hard copy of all or part of this material without fee for personal or classroom use provided that the copies are not made or distributed for profit or commercial advantage, the ACM copyright/server notice, the title of the publication, and its date appear, and notice is given that copying is by permission of the ACM, Inc. To copy otherwise, to republish, to post on servers, or to redistribute to lists requires prior specific permission and/or a fee. c 20YY ACM 0362-5915/20YY/0300-0001 $5.00
ACM Transactions on Database Systems, Vol. V, No. N, Month 20YY, Pages 1–0??.
2
·
Aggarwal and Yu
about users. In addition, advances in hardware technology have also made it feasible to track information about individuals from transactions in everyday life. For example, a simple transaction such as using the credit card results in automated storage of information about user buying behavior. In many cases, users are not willing to supply such personal data unless its privacy is guaranteed. Therefore, in order to ensure effective data collection, it is important to design methods which can mine the data with a guarantee of privacy. This has resulted in a considerable amount of focus on privacy-preserving data collection and mining methods in recent years [1; 2; 4; 6; 5; 9; 13; 14; 15; 25; 27]. A perturbation based approach to privacy-preserving data mining was pioneered in [2]. This technique relies on two facts: —Users are not equally protective of all values in the records. Thus, users may be willing to provide modified values of certain fields by the use of a (publically known) perturbing random distribution. This modified value may be generated using custom code or a browser plug in. —Data mining problems do not necessarily require the individual records, but only distributions. Since the perturbing distribution is known, it can be used to reconstruct aggregate distributions. This aggregate information may be used for the purpose of data mining algorithms. An example of a classification algorithm which uses such aggregate information is discussed in [2]. Specifically, let us consider a set of n original data values x1 . . . xn . These are modeled in [2] as n independent values drawn from the data distribution X. In order to create the perturbation, we generate n independent values y1 . . . yn , each with the same distribution as the random variable Y . Thus, the perturbed values of the data are given by x1 + y1 , . . . xn + yn . Given these values, and the (publically known) density distribution fY for Y , techniques have been proposed in [2] in order to estimate the distribution fX for X. An iterative algorithm has been proposed in the same work in order to estimate the data distribution fX . A convergence result was proved in [4] for a refinement of this algorithm. In addition, the paper in [4] provides a framework for effective quantification of the effectiveness of a (perturbation-based) privacy-preserving data mining approach. We note that the perturbation approach results in some amount of information loss. The greater the level of perturbation, the less likely it is that we will be able to estimate the data distributions effectively. On the other hand, larger perturbations also lead to a greater amount of privacy. Thus, there is a natural trade-off between greater accuracy and loss of privacy. Another interesting method for privacy-preserving data mining is the k-anonymity model [38]. In the k-anonymity model, pseudo-identifier fields are generalized or suppressed, so that any record in the database may correspond to any of at least k public records. The k-anonymity based transformation methods have further been explored in a number of papers exploring a number of effective algorithms [8; 22; 26]. It has also been shown [29] that the problem of optimal k-anonymization is NP-hard. ACM Transactions on Database Systems, Vol. V, No. N, Month 20YY.
On Static and Dynamic Methods for Condensation Based Privacy-Preserving Data Mining
1.1
·
Strengths and Weaknesses of the Perturbation Model
The perturbation approach works under the strong requirement that the data server is not allowed to learn or recover precise records. This strong restriction naturally also leads to some challenges. Since the method does not reconstruct the original data values but only distributions, new algorithms need to be developed which use these reconstructed distributions in order to perform mining of the underlying data. This means that for each individual data problem such as classification, clustering, or association rule mining, a new distribution based data mining algorithm needs to be developed. For example, the work in [2] develops a new distribution-based data mining algorithm for the classification problem, whereas the techniques in [15] and [36] develop methods for privacy-preserving association rule mining. While some clever approaches have been developed for distribution-based mining of data for particular problems such as association rules and classification, it is clear that using distributions instead of original records restricts the range of algorithmic techniques that can be used on the data. In the perturbation approach, the distribution of each data dimension is reconstructed independently. This means that any distribution based data mining algorithm works under an implicit assumption of treating each dimension independently. In many cases, a lot of relevant information for data mining algorithms such as classification is hidden in the inter-attribute correlations [32]. For example, the classification technique in [2] uses a distribution-based analogue of a singleattribute split algorithm. However, other techniques such as multi-variate decision tree algorithms [32] cannot be accordingly modified to work with the perturbation approach. This is because of the independent treatment of the different attributes by the perturbation approach. This means that distribution based data mining algorithms have an inherent disadvantage of loss of implicit information available in multi-dimensional records. It is not easy to extend the technique in [2] to reconstruct multi-variate distributions, because the amount of data required to estimate multi-dimensional distributions (even without randomization) increases exponentially1 with data dimensionality [37]. This is often not feasible in many practical problems because of the large number of dimensions in the data. The perturbation approach also does not provide a clear understanding of the level of indistinguishability of different records. For example, for a given level of perturbation, how do we know the level to which it distinguishes the different records effectively? In this paper, we introduce a condensation approach which constructs constrained clusters in the data set, and then generates pseudo-data from the statistics of these clusters. We refer to the technique as condensation because of its approach of using condensed statistics of the clusters in order to generate pseudo-data. The constraints on the clusters are defined in terms of the sizes of the clusters which are chosen in a way so as to preserve k-anonymity. This method has a number of advantages over the perturbation model in terms of preserving privacy in an 1 A limited level of multi-variate randomization and reconstruction is possible in sparse categorical data sets such as the market basket problem [15]. However, this specialized form of randomization cannot be effectively applied to a generic non-sparse data set because of the theoretical considerations discussed.
ACM Transactions on Database Systems, Vol. V, No. N, Month 20YY.
3
4
·
Aggarwal and Yu
effective way. In addition, since the approach works with pseudo-data rather than with modifications of original data, this helps in better preservation of privacy than techniques which simply use modifications of the original data. Furthermore, the use of pseudo-data no longer necessitates the re-design of data mining algorithms, since they have the same format as the original data. In contrast, when the data is constructed with the use of generalizations or suppressions, we need to re-design data mining algorithms to work effectively with incomplete or partially certain data. It can also be effectively used in situations with dynamic data updates such as the data stream problem. This is not the case for the work in [38] which essentially assumes that the entire data set is available a-priori. 1.2
Related Work
The problem of privacy-preserving data mining has found considerable attention in recent years because of recent concerns on the privacy of underlying data. Many recent papers on privacy have focussed on the perturbation model and its variants [1; 2; 36; 15; 21]. Methods for inference attacks in the context of the perturbation model have been discussed in [21]. A number of papers have also appeared on the k-anonymity model [8; 7; 19; 17; 18; 23; 29; 38; 40] recently. Other related works discuss the method of top-down specialization for privacy preservation [17; 18], and workload-aware methods for anonymization [24]. Some of the recent papers [8; 29] discuss the issue of optimal k-anonymity, and show theoretically and practically that the problem is computationally difficult. A related topic is that of privacypreserving data mining in vertically or horizontally partitioned data [13; 28]. In this case, we determine aggregate characteristics of the data which are distributed across multiple sites without exchanging explicit information about individual records. The key in many of these approaches is to reduce the communication costs as much as possible while retaining privacy. Another related work in [11] discusses transformation based methods to preserve the anonymity of the data. This is different from our technique which uses group-based pseudo-data generation in order to preserve anonymity. Other related techniques include those of privacy preservation with the use of pseudo-random sketches [31], the SuLQ framework [12], and methods for query auditing [33]. Some interesting work on micro-aggregation [16] constructs small groups of records for privacy preservation purposes. However, this work does not use pseudo-data for the purpose of anonymization. A method in [35] uses data swapping techniques for anonymization which swaps values across different records. This is somewhat similar to pseudo-data in the sense that the records generated are not present in the original data. However, our focus is to generate pseudo-data which match the original data distribution, while at the same time matching certain privacy-driven constraints in terms of the indistinguishability of the underlying records. This paper is an extended version of our earlier conference version of the paper in [6]. In comparison to the conference version, we have extended this paper in the following respects: —We have extended the approach to data streams. A variety of replacement policies have been studied together with their effects. We have also provided an experimental study of the effect of different replacement policies. Experimental ACM Transactions on Database Systems, Vol. V, No. N, Month 20YY.
On Static and Dynamic Methods for Condensation Based Privacy-Preserving Data Mining Record
Attribute1
Attribute2
Record
Attribute1
Attribute2
Data1 Data2 Data3
3.51 3.81 3.05
4.48 4.05 4.9
Synthetic1 Synthetic2 Synthetic 3
3.16 3.48 3.79
4.83 4.57 4.13
Data4 Data5 Data6
4.25 4.88 4.01
2.11 2.77 2.15
Synthetic4 Synthetic5 Synthetic6
4.56 4.12 4.35
2.45 2.05 2.27
Table I.
·
Example of real data corresponding to two groups with corresponding pseudo-data
results are provided for the data stream case. —We have proposed an algorithm for the extension of the method to categorical data sets in section 3.3. —We have extended the methodology for association rule mining and have provided experimental results for this extension. This is also useful to study the effectiveness of the method on categorical data. —We have provided a detailed discussion of how pseudo-data is generated in section 3.1. We have also discussed the advantages of using pseudo-data rather than the statistics directly. —We have provided a detailed discussion of possible attacks on the condensation approach. This explains why it is more difficult to perform a privacy attack with a condensation model, which works with pseudo-data rather than generalized records. This paper is organized as follows. In the next section, we will introduce the locality-sensitive condensation approach. We will first discuss the simple case in which an entire data set is available for application of the privacy-preserving approach. This approach will be extended to incrementally updated data sets in section 3. The empirical results are discussed in section 4. Finally, section 5 contains the conclusions and summary. 2.
THE CONDENSATION APPROACH
In this section, we discuss a condensation approach for data mining. This approach uses a methodology which condenses the data into multiple groups of pre-defined size. For each group, certain statistics are maintained. Each group has a size at least k, which is referred to as the indistinguishability level of that privacy-preserving approach. The greater the indistinguishability level, the greater the amount of privacy. At the same time, a greater amount of information is lost because of the condensation of a larger number of records into a single statistical group entity. We use the statistics from each group in order to generate the corresponding pseudodata. We define the indistinguishability level of a data set as follows: Definition 2.1. A pseudo-data set D′ generated from the original data set D is said to be k-indistinguishable, if every record X in D′ can be mapped to at least k records M (X) in D. The record X is generated from M (X) using a randomized algorithm which treats all records in M (X) symmetrically. Therefore, X is equally related to all records in M (X). ACM Transactions on Database Systems, Vol. V, No. N, Month 20YY.
5
6
·
Aggarwal and Yu
The approach can be applied to either static data sets, or more dynamic data sets in which data points are added incrementally. Our method shares a number of similarities to the k-anonymity model, but with a number of functional differences which work to the advantage of the method: (1) It works with pseudo-data rather than with modifications of the original data. As discussed later, this helps in better preservation of privacy. (2) It can be effectively used in situations with dynamic data updates such as the data stream problem. This is not the case for the work in [38] which essentially assumes that the entire data set is available a-priori. In particular, we will show how to extend the method to the case of data streams. Since the data stream problem has achieved greater prominence in recent years, the extensions of our work to the data stream case is very helpful in a variety of real applications. Each group of records is referred to as a condensed unit. The condensed unit is constructed using a clustering technique which will be described later. For example, consider the Table I in which we have two groups which contain 3 records each. We will use this as a running example to illustrate some of the results in our paper. Let G be a condensed group containing the records {X1 . . . Xr }. We assume that the dimensionality of the data is d. Let us also assume that the d dimensions for the record Xi are denoted by (x1i . . . xdi ). The following information is maintained about each group of records G: —For each attribute j, we maintain Pr the sum of corresponding values. The corresponding value is given by i=1 xji . We denote the corresponding first-order sums by F sj (G). The vector of first order sums is denoted by F s(G). —For each pair of attributes i and j, we maintain the Pr sum of the product of corresponding attribute values. This sum is equal to t=1 xit · xjt . We denote the corresponding second-order sums by Scij (G). The vector of second-order sums is denoted by Sc(G). —We maintain the total number of records in that group. This number is denoted by n(G). For example, consider a group containing the two dimensional elements (1, 1), (1, 0) and (0, 1). Then, the first order sums are (1, 1) + (1, 0) + (0, 1) = (2, 2). The second order sums are (12 + 12 + 02 , 12 + 1 · 0 + 0 · 1, 12 + 02 + 12 ) = (2, 1, 2). The number of data points in the group is 3. For the case of Table I, there are two groups containing three records each. The zeroth order statistics for each group is 3. The first order statistics for the two groups are (10.37, 13.43) and (13.14, 7.03) respectively. The second order statistics for the groups are (36.13, 46.1, 60.48) and (57.96, 31.1, 16.75) respectively, where the middle number corresponds to the symmetric non-diagonal element. We make the following simple observations: Observation 1: The mean value of attribute j in group G is given by F sj (G)/n(G). Observation 2: The covariance between attributes i and j in group G is given by Scij (G)/n(G) − F si (G) · F sj (G)/n(G)2 . Thus, the covariance matrix can be constructed from the group statistics. For Table I, the two covariance matrices are given by ([0.1465, −0.1614], [−0.1614, 0.1806]), ACM Transactions on Database Systems, Vol. V, No. N, Month 20YY.
On Static and Dynamic Methods for Condensation Based Privacy-Preserving Data Mining
·
and ([0.2019, 0.1576], [0.1576, 0.1369]). The method of group construction is different depending upon whether an entire database of records is available or whether the data records arrive in an incremental fashion. We will discuss two approaches for construction of class statistics: —When the entire data set is available and individual subgroups need to be created from it. —When the data records need to be added incrementally to the individual subgroups. The broad problem of condensation-based privacy-preserving data mining is that of creating groups of records such that each of them represents a tight cluster of data points, and such that each cluster contains at least k data points. We would like to minimize an objective function W (·) which measures average tightness within the clusters. An example of such an objective function could be the average intra-cluster distance between the data points, or the average centroid radius of the clusters. Problem 2.1. (Condensation Problem) For a given database D, partition it into s = ⌊N/k⌋ groups {C1 . . . Cs } of at least k data points each, so that the objective function W (C1 . . . Cs ) is minimized.
We note that this is an instance of the balanced clustering problem, which is NPhard [10; 34]. In [34] it has been shown that the problem is NP-hard even for k = 3 for minimizing the intra-cluster distance. Observation 2.1. The condensation problem is NP-hard.
Therefore, we design a heuristic solution which is almost linear in the number of data points in terms of time complexity. The algorithm for creation of subgroups from the entire data set is a straightforward iterative approach. In each iteration, a record X is sampled from the database D. The closest (k − 1) records to this individual record X are added to this group. Let us denote this group by G. The statistics of the k records in G are computed. Next, the k records in G are deleted from the database D, and the process is repeated iteratively, until the database D is empty. We note that at the end of the process, it is possible that between 1 and (k − 1) records may remain. These records can be added to their nearest sub-group in the data. Thus, a small number of groups in the data may contain larger than k data points. The overall algorithm for the procedure of condensed group creation is denoted by CreateCondensedGroups, and is illustrated in Figure 1. We assume that the final set of group statistics are denoted by H. This set contains the aggregate vector (Sc(G), F s(G), n(G)) for each condensed group G. 2.1
Anonymized-data construction from Condensation Groups
We note that the condensation groups represent statistical information about the data in each group. This statistical information can be used to create anonymized data which have similar statistical characteristics to the original data. This is achieved by using the following method: —A d ∗ d co-variance matrix C(G) is constructed for each group G. The ijth entry of the co-variance matrix is the co-variance between the attributes i and j of the set of records in G. ACM Transactions on Database Systems, Vol. V, No. N, Month 20YY.
7
8
·
Aggarwal and Yu
Algorithm CreateCondensedGroups(Indistinguish. Lvl.: k, Database: D); begin while D contains at least k points do begin Randomly sample a data point X from D; G = {X}; Find the closest (k − 1) records to X and add to G; for each attribute j compute statistics F sj (G); for each pair of attributes i, j compute Scij (G); Set n(G) = k; Add the corresponding statistics of group G to H; D = D − G; end; Assign each remaining point in D to the closest group and update the corresponding group statistics; end return(H); end
Fig. 1.
Creation of Condensed Groups from the Data
—The eigenvectors of this co-variance matrix are determined. These eigenvectors are determined by decomposing the matrix C(G) in the following form: C(G) = P (G) · ∆(G) · P (G)T
(1)
The columns of P (G) represent the eigenvectors of the covariance matrix C(G). The diagonal entries λ1 (G) . . . λd (G) of ∆(G) represent the corresponding eigenvalues. Since the matrix is positive semi-definite, the corresponding eigenvectors form an ortho-normal axis system. This ortho-normal axis-system represents the directions along which the second order correlations are removed. In other words, if the data were represented using this ortho-normal axis system, then the covariance matrix would be the diagonal matrix corresponding to ∆(G). Thus, the diagonal entries of ∆(G) represent the variances along the individual dimensions. We can assume without loss of generality that the eigenvalues λ1 (G) . . . λd (G) are ordered in decreasing magnitude. The corresponding eigenvectors are denoted by e1 (G) . . . ed (G). In order to re-construct the anonymized data for each group, we assume that the data within each group is independently and uniformly distributed along each eigenvector with a variance equal to the corresponding eigenvalue. The statistical independence along each eigenvector is an extended approximation of the second-order statistical independence inherent in the eigenvector representation. This is a reasonable approximation when only a small spatial locality is used. Within a small spatial locality, we may assume that the data is uniformly distributed without substantial loss of accuracy. The smaller the size of the locality, the better the accuracy of this approximation. The size of the spatial locality reduces when a larger number of groups is used. Therefore, the use of a large number of groups leads to a better overall approximation in each spatial locality. On the other hand, the use of a larger number of groups also reduced the number of points in each group. While the use ACM Transactions on Database Systems, Vol. V, No. N, Month 20YY.
On Static and Dynamic Methods for Condensation Based Privacy-Preserving Data Mining
·
Algorithm DynamicGroupMaintenance(Database: D, IncrementalStream: S, IndistinguishabilityLevel: k) begin H = CreateCondensedGroups(k, D); for each data point X received from incremental stream S do begin Find the nearest centroid in H to X; Add X to corresponding group statistics M; if n(M) = 2 · k then (M1 , M2 ) = SplitGroupStatistics(M, k); Delete M from H; Add M1 to H; Add M2 to H; end end Fig. 2.
Overall Process of Maintenance of Condensed Groups
of a smaller spatial locality improves the accuracy of the approximation, the use of a smaller number of points affects the accuracy in the opposite direction. This is an interesting trade-off which will be explored in greater detail in the empirical section. For the case of Table I, the eigenvectors for the first group are [−0.669, 0.743] and [−0.669, −0.743], with eigenvalues 0.3258 and 0.0013. Therefore, the data is mostly distributed along the straightline corresponding to the first eigenvector. The corresponding synthetic data is also generated using the uniform distribution along this straight line. This is illustrated on the right hand side corresponding to Table I. We note that the procedure for creation of the condensed groups is quite fast, since it requires O(g) distance operations for each data point, where g is the total number of groups. Each update to the group statistics requires O(d2 ) time. Furthermore, the creation of the final set of eigenvectors and pseudo-data generation requires O(d2 ) time. Therefore, the total time complexity is O(d · g · N + d2 · N ). By substituting g = N/k, we obtain the final complexity as O(d · N 2 /k + d2 · N ). 2.2
Locality Sensitivity of Condensation Process
We note that the error of the simplifying assumption increases when a given group does not truly represent a small spatial locality. Since the group sizes are essentially fixed, the level of the corresponding inaccuracy increases in sparse regions. This is a reasonable expectation, since outlier points are inherently more difficult to mask from the point of view of privacy preservation. It is also important to understand that the locality sensitivity of the condensation approach arises from the use of a fixed group size as opposed to the use of a fixed group radius. This is because fixing the group size fixes the privacy (indistinguishability) level over the entire data set. At the same time, the level of information loss from the simplifying assumptions depends upon the characteristics of the corresponding data locality. ACM Transactions on Database Systems, Vol. V, No. N, Month 20YY.
9
10
·
Aggarwal and Yu
Algorithm SplitGroupStatistics(GroupStatistics: M, GroupSize: k); begin Determine covariance matrix C(M); { The j, kth entry of the covariance matrix is determined using the formula Cjk (M) = Scjk (M)/n(M) − F sj (M) · F sk (M)/n(M)2 ; } Determine eigenvectors e1 (M) . . . ed (M) with eigenvalues λ1 (M) . . . λd (M); { We express C(M) = P (M) · ∆(M) · P (M)T Here ∆(M) is a diagonal matrix; } { Without loss of generality we assume that λ1 (M) ≥ . . . ≥ λd (M); } n(M1 ) = n(M2 ) = k; √ F s(M1 ) = F s(M)/n(M) + e1 (M) · 12 · λ1 /4; √ F s(M2 ) = F s(M)/n(M) − e1 (M) · 12 · λ1 /4; Construct ∆(M1 ) and ∆(M2 ) by dividing the diagonal entry λ1 of ∆(M) by 4; P (M1 ) = P (M2 ) = P (M); C(M1 ) = C(M2 ) = P (M1 ) · ∆(M1 ) · P (M1 )T ; for each pair of attributes i, j do begin Scij (M1 ) = k · Cij (M1 ) + F si (M1 ) · F sj (M1 )/k; Scij (M2 ) = k · Cij (M2 ) + F si (M2 ) · F sj (M2 )/k; end; end Fig. 3.
Splitting Group Statistics (Algorithm)
b
a
+
Split Point
a/2 *X
+
New centroids
Fig. 4.
a/2
Splitting Group Statistics (Illustration)
ACM Transactions on Database Systems, Vol. V, No. N, Month 20YY.
On Static and Dynamic Methods for Condensation Based Privacy-Preserving Data Mining
3.
·
MAINTENANCE OF CONDENSED GROUPS IN A DYNAMIC SETTING
In the previous section, we discussed a static setting in which the entire data set was available at one time. In this section, we will discuss a dynamic setting in which the records are added to the groups one at a time. In such a case, it is a more complex problem to effectively maintain the group sizes. Therefore, we make a relaxation of the requirement that each group should contain k data points. Rather, we impose the requirement that each group should maintain between k and 2 · k data points. As each new point in the data is received, it is added to the nearest group, as determined by the distance to each group centroid. As soon as the number of data points in the group equals 2 · k, the corresponding group needs to be split into two groups of k points each. We note that with each group, we only maintain the group statistics as opposed to the actual group itself. Therefore, the splitting process needs to generate two new sets of group statistics as opposed to the data points. Let us assume that the original set of group statistics to be split is given by M, and the two new sets of group statistics to be generated are given by M1 and M2 . The overall process of group updating is illustrated by the algorithm DynamicGroupMaintenance in Figure 2. As in the previous case, it is assumed that we start off with a static database D. In addition, we have a constant stream S of data which consists of new data points arriving in the database. Whenever a new data point X is received, it is added to the group M, whose centroid is closest to X. As soon as the group size equals 2 · k, the corresponding group statistics needs to be split into two sets of group statistics. This is achieved by the procedure SplitGroupStatistics of Figure 3. In order to split the group statistics, we make the same simplifying assumptions about (locally) uniform and independent distributions along the eigenvectors for each group. We also assume that the split is performed along the most elongated axis direction in each case. Since the eigenvalues correspond to variances along individual eigenvectors, the eigenvector corresponding to the largest eigenvalue is a candidate for a split. An example of this case is illustrated in Figure 4. The logic of choosing the most elongated direction for a split is to reduce the variance of each individual group as much as possible. This ensures that each group continues to correspond to a small data locality. This is useful in order to minimize the effects of the approximation assumptions of uniformity within a given data locality. We assume that the corresponding eigenvector is denoted by e1 and its eigenvalue by λ1 . Since the variance of the data along e1 is λ1 , then √ the range (a) of the corresponding uniform distribution along e1 is given2 by a = 12 · λ1 . The number of records in each newly formed group is equal to k since the original group of size 2 · k is split into two groups of equal size. We need to determine the first order and second-order statistical data about each of the split groups M1 and M2 . This is done by first deriving the centroid and zero (second-order) correlation directions for each group. The values of F si (G) and Scij (G) about each group can also be directly derived from these quantities. We will proceed to describe this derivation process in more detail. 2 This
calculation was done by using the formula for the standard deviation p of a uniform distribution with range a. The corresponding standard deviation is given by a/12. ACM Transactions on Database Systems, Vol. V, No. N, Month 20YY.
11
12
·
Aggarwal and Yu
Let us assume that the centroid of the unsplit group M is denoted by Y (M). This centroid can be computed from the first-order values F s(M) using the following relationship: Y (M) = (F s1 (M), . . . F sd (M))/n(M)
(2)
As evident from Figure 4, the centroids of each of the split groups M1 and M2 are given by Y (M) − (a/4) · e1 and Y (M) + (a/4) · e1 respectively. √ Therefore, the new centroids of the groups M and M are given by Y (M) − ( 12 · λ1 /4) · e1 and 1 2 √ Y (M) + ( 12 · λ1 /4) · e1 respectively. The first-order statistics can be explicitly computed by multiplying each of the computed centroids with n(M1 ) = n(M2 ) as suggested in Equation 2. It now remains to compute the second-order statistical values. This is slightly more tricky. Once the co-variance matrix for each of the split groups has been computed, the second-order aggregate statistics can be derived by the use of the covariance values in conjunction with the centroids that have already been computed. Let us assume that the ijth entry of the co-variance matrix for the group M1 is given by Cij (M1 ). Then, from Observation 2, it is clear that the second-order statistics of M1 may be determined as follows: Scij (M1 ) = k · Cij (M1 ) + F si (M1 ) · F sj (M1 )/k
(3)
Since the first-order values have already been computed, the right hand side can be substituted, once the co-variance matrix has been determined. We also note that the eigenvectors of M1 and M2 are identical to the eigenvectors of M, since the directions of zero correlation remain unchanged by the splitting process. Therefore,for each i, such that 1 ≤ i ≤ d, we have: ei (M1 ) = ei (M2 ) = ei (M)
(4)
The eigenvalue corresponding to e1 (M) is equal to λ1 /4 because the splitting process along e1 reduces the corresponding variance by a factor of 4. All other eigenvectors remain unchanged. Let P (M) represent the eigenvector matrix of M, and ∆(M) represent the corresponding diagonal matrix. Then, the new diagonal matrix ∆(M1 ) = ∆(M2 ) of M1 can be derived by dividing the entry λ1 (M) by 4. Therefore, we have: λ1 (M1 ) = λ1 (M2 ) = λ1 (M)/4
(5)
The other eigenvalues of M1 and M2 remain the same. Therefore, for each i such that 1 ≤ i ≤ d, we have: λi (M1 ) = λi (M2 ) = λi (M)
(6)
Thus, the co-variance matrices of M1 and M2 may be determined as follows: C(M1 ) = C(M2 ) = P (M1 ) · ∆(M1 ) · P (M1 )T
(7)
Once the co-variance matrices have been determined, the second order aggregate information about the data is determined using Equation 3. We note that even though the covariance matrices of M1 and M2 are identical, the values of Scij (M1 ) and Scij (M2 ) will be different because of the different first-order aggregates substituted in Equation 3. The overall process for splitting the group statistics is illustrated in Figure 3. ACM Transactions on Database Systems, Vol. V, No. N, Month 20YY.
On Static and Dynamic Methods for Condensation Based Privacy-Preserving Data Mining
·
One potentially challenging case is one in which a newly entering record is far away from all the currently existing groups. In such a case, the sizes of the groups may increase. While it may be tempting to create a new group containing this record, this is not necessarily advisable since the record is potentially an outlier. Deletions. The method can also be extended to handle deletions approximately. This is because the group identity of a data point at deletion cannot be known exactly. For practical purposes, we subtract the data point from the group statistics of the closest current group. However, before performing this deletion, we multiply each group statistic by (r + 1)/r, where r is the total number of data points in the group. In such a case, the group continues to have r pseudo-points even after the deletion. This is necessary in order to maintain the privacy of the group. The pseudo-data from that group needs to be completely re-generated after the deletion. 3.1
Application of Methodology for Pseudo-data Generation
The statistics in the condensed groups can be used to generate pseudo-data for a variety of data mining algorithms. The pseudo-data is generated by using the assumption that the data along each eigenvector is independently distributed with a uniform distribution. Therefore, for each group, we generate data along the eigenvector ei independently using a uniform distribution. The variance of the uniform distribution is given by λi . The number of points generated for a given group is equal to the number of points from which the group was generated. However, we note that for aggregation based data mining algorithms, it is not necessary to maintain the same number of points. As long as the number of data points generated from each group is proportional to the number of points in the original data, the overall statistical behavior of the data set is preserved. We note that we have used two approximations in the generation of the pseudodata. The first approximation is the use of a uniform distribution along each eigenvector. This approximation is reasonable as long as it is used within a small data locality, in which it may be assumed that the density distribution does not vary significantly. The second assumption is the use of independence along each eigenvector. We note that while the data along each eigenvector are not statistically independent, the second-order covariances are indeed zero. Therefore, this assumption only ignores the higher order correlations. Furthermore, we note that this approximation is done only within the small locality of a given group. Therefore, higher order correlations are indeed preserved for the entire data set. In fact, when the granularity of representation is very high, the higher order statistics is preserved very accurately. We will discuss this point in some detail in later sections, and also present some experiments clarifying this point. For the dynamic case, we generate a single pseudo-point for each incoming data point. While the group statistics are constantly updated, the eigenvector statistics are updated only once every few data points. In all our tests, we updated the statistics every 100 data points. This ensures excellent efficiency with minimal loss in quality. 3.1.1 Use of Statistics versus Pseudo-data: Privacy Implications and comparison to k-anonymity model. We note that we have chosen to generate pseudo-data rather than the direct use of condensed group statistics. A natural possibility arises ACM Transactions on Database Systems, Vol. V, No. N, Month 20YY.
13
14
·
Aggarwal and Yu
in terms of designing data mining algorithms to work with group statistics rather than pseudo-data. This turns out to be undesirable for two reasons: • The use of condensed group statistics requires the design of data mining algorithms which work with statistical representations of the data. Direct use of pseudo-data allows direct use of current algorithms. • A more important reason for not keeping group statistics is to avoid the possibility of adversarial attacks. We note that the storage of the covariance matrix provides enough information to find out sensitive information about the points in the underlying group. For example, consider a case when the anonymity level k is less than the dimensionality d. In such a case, all points in a group lie on a hyperplane with dimensionality at most (k − 1). By using this hyperplane in conjunction with publicly available records, it may be possible to infer the exact identities of the records within the group. The application of pseudo-data is very useful in this respect. This is because one does not know in advance which set of k pseudo-points are generated from the same group. This is also helpful in protecting the values of the sensitive attributes. One of the possible attacks on k-anonymity based transformation methods is one in which the k records for a given group have the same set of sensitive attributes. In vanilla k-anonymity based transformation methods [38], the records are modified representations of the true data. This allows us to reconstruct the groups accurately by finding records which are indistinguishable on certain attributes. In the case of condensation, it is not possible to know which pseudo-points belong to the same group, unless the individual groups have zero variance across all dimensions. Even in such cases, the group identity can be masked by adding additional noise. We note that the method of ℓ-diversity [30] is an alternative way to address some of the above-mentioned issues, though the use of pseudo-data provides much more flexibility in adding noise to the data. In order to further increase the level of privacy, it is possible to use a number of variations on our method both during clustering and synthetic data generation. We enumerate these variations for further research on this method. We note that some of these variations are also applicable to standard k-anonymity based transformation methods. (1) One can add additional constraints during clustering to ensure that the sensitive attributes have some variation. This addresses the issues discussed in [30]. This kind of approach can be used with general k-anonymity based transformation methods as well as condensation. (2) It is not necessary to use the same number of points for a given pseudo-group as the number of points the corresponding statistics represents. This is true as long as proportionality is maintained across different groups. This also adds an additional level of privacy to the pseudo-data. (3) We can add additional noise during generation of pseudo-points. The addition of even a small amount of noise makes identification of points within a pseudogroup more difficult. This is because the corresponding hyperplane constructed from the pseudo-points of a true group no longer passes through the true data points. For the dynamic case, we assume that the adversary is not allowed free access to the data set after each update. Rather, the additional pseudo-data is released after ACM Transactions on Database Systems, Vol. V, No. N, Month 20YY.
On Static and Dynamic Methods for Condensation Based Privacy-Preserving Data Mining
·
each set of g · k updates, where g is the number of groups and k is the anonymity level. This provides additional protection on the temporal sequence of the updates. 3.2
Application to Fast Data Streams
While the above description is quite useful to the problem of dynamic privacypreserving data mining, we may need to apply the method to fast data streams. The privacy concerns are similar to those of static and dynamic databases, but the key issue in fast data streams is that it is desirable to be efficient in processing a large volume of the data at the server end. We further note that in the case of data streams, it cannot be assumed that a data point will be available for re-computation of group statistics. We have also assumed this for the case of dynamic databases, and this is even more true for the data stream case since enough space is not available to store the entire data. This is also true of anonymized group statistics, since an unlimited data stream will also create group statistics which grow in an unlimited way. An example of a stream application would be an online personalization application at an electronic commerce web site. It may be desirable to use the transaction information for predictive modeling. However, the customers are not always comfortable with the use of their transaction data for mining purposes. In such cases, it may be desirable to not use the true customer transactions, but work with pseudo-data generated from group statistics. One issue which arises in the case of data streams is whether privacy is violated if pseudo-points are released individually. Note that if we had released the covariance statistics after each data point, it may be possible to infer the incoming data point by appropriate subtraction of the historical covariance statistics from current statistics. However, each released pseudo-points is random and only reflects the overall behavior of its group in a probabilistic way. This provides greater protection from a privacy point of view. The probabilistic nature of the release limits the attacker’s ability to use the identity and statistics of the group from which the data point is generated. A few additional modifications are required to apply the method to the case of data streams. We note that a constant group size effectively means that the number of clusters keep increasing over time. This is an unsustainable situation for a possibly infinite data stream. Therefore, a mechanism needs to be defined which can only store a fixed number of groups from the data stream. This fixed number of groups is defined by the buffersize in the data. The fixed buffer size defines the maximum number of groups for which the statistics can be maintained simultaneously. When new data points arrive, they are added to their closest current group. In some cases, the addition of a data point to a group causes it to exceed the pre-defined group size. In such a case, we apply the split operation to that group. Whenever a group splits, we need to drop one of the clusters in the data. This cluster is defined by the most stale group in the data. The most stale group is defined as the least recently updated group from the data set. The reason for removing the most stale group from the set is to ensure that the most recent data is stored, when a limited amount of storage is available. In order to achieve this goal, we also maintain the temporal update information for each group. This is defined as the last time that the group was updated. Whenever a group splits, the temporal update information is the same as the current ACM Transactions on Database Systems, Vol. V, No. N, Month 20YY.
15
16
·
Aggarwal and Yu
time stamp. At the initial stages of the algorithm, the splitting process does not lead to the removal of any group from the data. This is because the buffer size may not be full at the initial stage. As the algorithm progresses, the buffer is filled and each split leads to a replacement of the least recently updated group. We note that such a process also keeps the group statistics relatively fresh from a temporal point of view. This leads to a more effective solution for most data mining problems, since temporal locality is usually desirable for data mining applications. In cases in which the buffer size available is not a constraint, it may even be possible to support certain window sizes from a freshness point of view. We note that for some applications, other criteria may be more important for retaining the groups. In such cases, the replacement policy needs to be designed with the application in mind. We note that the data stream algorithm maintains O(d2 ) statistics which need to be maintained. In order to improve the efficiency of statistics maintenance, we reduce the rate at which the entries are updated. We only keep the first-order and zero-th order statistics current. This is because the first and zeroth order statistics are more critical for maintaining accuracy. Thus, for a d-dimensional data set, only (d + 1) entries are updated for every data point. The remaining O(d2 ) entries are only updated after d points are added to a group (or its split descendent). This means that on the average O(d) operations are required to update the second-order statistics as well. Thus, the second-order statistics are constructed by using only a sample of size 1/d from the data stream. On the other hand, the first-order and zero-th order statistics use the entire stream. Correspondingly, whenever the second-order statistics are used, they are pro-rated by factor of d. A second point is that of effective generation of eigenvectors by the algorithm. Since the process of eigenvector generation can be expensive, we do not perform the computations every iteration. Rather, the eigenvector computations are performed only whenever the second-order statistics for a group is updated. Furthermore, the eigenvector update operation need not be performed for every update operation. Rather, we perform the re-computation only every Cgap update operations of the second-order statistics. The value of Cgap thus determines the level of staleness we are willing to allow in order to gain better computational efficiency. A choice of Cgap = 1 represents exact computations. This set of eigenvectors are then stored to generate the pseudo-data until an update to the eigenvectors takes place. This effectively means that the eigenvector computations are only performed every time Cgap · d data points have been added to a group. Therefore, the eigenvector used is slightly stale from the perspective of pseudo-data generation. In practice, a group may split a few times before the eigenvectors are updated. We note however that the first-order statistics are always current, and therefore, the centroid of a given group is always current. The current centroid derived from the first-order statistics is used for pseudo-data generation. Therefore, a mixture of current and (slightly) stale statistics is used for pseudo-data generation. Our experimental results will show that the sampling approach reduces the effectiveness of the approach slightly. The pseudo-data from the stream is generated every time a new point is received. For each new point which is received, it is first used to update the statistics of the corresponding group. Then a pseudo-point from that group is generated using the ACM Transactions on Database Systems, Vol. V, No. N, Month 20YY.
On Static and Dynamic Methods for Condensation Based Privacy-Preserving Data Mining
·
method discussed in the previous section. Because of the use of a lazy update process, the method turns out to be quite efficient in practice. As we will see in the empirical section, this technique is capable of processing thousands of data points per second. Such real time capability is important in a number of practical applications. The reason for the choice of the LRU replacement policy is because of its adaptation from well known caching policies. The overall effect of these policies is to ensure that the set of statistics retained are biased towards the most recently received data points. In the case of a data stream, the behavior of the data shows temporal locality. This means that the data may often evolve in such a way that recent data is more valuable than earlier data. Therefore, it is important to execute the policy in such a way that temporal locality is retained. In order to improve the temporal locality, it is possible to use an LRU-m policy in which the average time stamp of the last m data points is used. Thus, we remove the group for which the average time stamp of the last m data points was the least recent. In the event that the group contains fewer than m data points, we use the average time stamp of all points in the group. In general, we found that the LRU policy was almost comparable to the LRU-m policy, and therefore it was preferable to use the LRU policy for ease in implementation. Another possible replacement policy is that of random replacement. This can be effective when the data does not evolve at all. This is rarely the case in practice. Our experimental results will show that while the random policy can often be effective, it can sometimes provide poor results. This typically happens when there are sudden changes in the behavior of the data stream. 3.3
Extensions to Categorical Case
In this section, we will discuss how to extend the algorithm to categorical data sets. In categorical data, each attribute is discrete, and takes on one of a number of values. The basic algorithm for the categorical case is similar except that we need to re-design the nature of the first and second-order statistics, and also design methods for generating the pseudo-data from this set of statistics. First, we will discuss the statistics stored for the categorical case. Let us assume that the ith attribute contains qi different discrete values. Let us assume that the qi possible attribute values of the ith attribute are denoted by v(i, 1) . . . v(i, qi ). In this case, the statistics maintained are as follows: —The second-order statistics between the dimensions i and j contains the cooccurrence frequency distribution for various pairs of categorical values. Thus, for each of the qi · qj pairs we maintain the frequency of occurrence. —The first-order statistics for dimension i contains the frequency for different categorical values of dimension i. This corresponds to a histogram with qi bins for dimension i. —The number of points in the group are maintained in the zeroth order statistics. We note that this set of statistics also maintains the additivity property, as in the quantitative case. Therefore, all algorithms for static, dynamic, and stream based privacy preservation can be applied to the categorical case as well. The only difference is in terms of computation of the distance function of a categorical record to ACM Transactions on Database Systems, Vol. V, No. N, Month 20YY.
17
18
·
Aggarwal and Yu
the centroid of a given set of points. More generally, we will define the methodology for finding the distance between two sets of histograms. We note that the centroid of a set of points is defined in terms of the first-order statistics. The first-order statistics defines a histogram of frequencies for each attribute. By normalizing this histogram with the number of data points, it is possible to obtain the histogram in terms of relative frequency. The distance between two histograms is defined as the Manhattan distance between the relative frequencies of the corresponding attribute values. The distance between two categorical centroids is defined as the average histogram distance over all attributes. This is easy to compute from the stored statistics. The final difference is that of computation of the pseudo-data for the categorical case. Instead of using eigenvectors for computation of categorical values, we use the second-order statistics more directly for generation of the pseudo-data. In order to do so, the attributes are generated in random order with successive use of the second-order information in order to determine the conditional probability of generation of new attribute values, given the old ones. Let us assume that the attributes are ordered i1 . . . id ∈ {1 . . . d}. The value of the first attribute i1 is picked randomly using the first-order values. Specifically, we use the frequency histogram of the different attribute values for i1 , and then pick the value at random with probability proportional to that defined by the histogram. Let us assume that the value picked is v(i1 , p1 ). Next, we pick the second-order values for attribute pair (i1 , i2 ) which only correspond to the attribute value v(i1 , p1 ) for i1 . Out of the ki1 ∗ ki2 such second-order values, there are ki2 such values which correspond to the instantiation v(i1 , p1 ). Then the conditional probability P (i2 |i1 = v(i1 , p1 )) is estimated as the relative frequency histogram constructed out of the ki2 second-order values. By sampling with probability proportional to this relative frequency histogram, we determine the value v(i2 , p2 ) for attribute i2 . The iterative generation of general values of ir is more complicated. We note that only a heuristic estimation of the probability values is possible since we do not keep the higher order information. However, since we keep the second-order information for all pairs of attributes, this turns out to be sufficient to generate the remaining attributes quite accurately. Therefore, we generate the (r−1) possible relative frequency histograms corresponding to the conditional probabilities P (ir |i1 = v(i1 , p1 )) . . . P (ir |ir−1 = v(ir−1 , pr−1 )) and determine the average of these histograms. The value of the attribute ir is determined by probability sampling of values of ir from this averaged histogram. The use of averages ensures that even when one or more attributes of a record has a unique value, the overall generation will result in a non-unique record. We also note that it is always possible to add further noise to the first-order and second-order values in order to reduce the risk of identification. An important point to note is that even though we are using only second-order statistics to generate the pseudo-data, this approximation is done only within a group. This has important implications to the approximation of higher order correlations at a global level. In practice, since a group represents only a small clustered data locality, a particular group is extremely biased for or against different itemsets. For example, a particular anonymized group may contain a particular frequent pattern in all of its transactions, but may not contain another frequent pattern at all. ACM Transactions on Database Systems, Vol. V, No. N, Month 20YY.
On Static and Dynamic Methods for Condensation Based Privacy-Preserving Data Mining
·
In such cases, the pseudo-data also accurately represents the higher order itemset behavior, when averaged over the entire data set. The amount of higher order information retained depends upon the granularity of the condensation process. In the extreme case, when each group contains exactly one transaction, all higher order information is retained since the generated data is identical to the original data. Thus, the level of higher order information retention also follows the same tradeoff between privacy and accuracy. Our experimental results show that the use of data locality in the condensation process is powerful enough to retain much of the higher order correlations even when second-order statistics are not used. Thus, it is not necessary to use correlation statistics at the local level in order to retain them at the global level. In the experimental section, we will test the behavior of an association rule algorithm on the pseudo-data. We will show that the pseudo-data can accurately maintain the support counts of not just the 2-itemsets, but also the higher order itemsets. 4.
EMPIRICAL RESULTS
All experiments were tested on an AIX 5.1.0.0 system with 375 MHz CPU, 2GB main memory, and a 33.875 GB hard drive. The experiments were implemented with the use of C ++ software. Since the aim of the privacy-preserving data mining process was to create a new perturbed data set with similar data characteristics, it is useful to compare the statistical characteristics of the newly created data with the original data set. Since the proposed technique is designed to preserve the covariance structure of the data, it would be interesting to test how the covariance structure of the newly created data set matched with the original. If the newly created data set has very similar data characteristics to the original data set, then the condensed data set is a good substitute for privacy-preserving data mining algorithms. For each dimension pair (i, j), let the corresponding entries in the covariance matrix for the original and the perturbed data be denoted by oij and pij . In order to perform this comparison, we computed the statistical coefficient of correlation between the pairwise data entry pairs (oij , pij ). Let us denote this value by µ. When the two matrices are identical, the value of µ is 1. On the other hand, when there is perfect negative correlations between the entries, the value of µ is −1. The anonymization method is the first of its kind which uses pseudo-data to achieve indistinguishability. Therefore, we will test the technique with respect to the original classification accuracy of a number of different classification algorithms and data sets. We tested the data generated from the privacy-preserving condensation approach on the classification problem. Specifically, we tested the accuracy of a simple k-nearest neighbor classifier with the use of different levels of privacy. The value of k used was 1 in each case. The level of privacy is controlled by varying the sizes of the groups used for the condensation process. The training pseudo-data is constructed by using separate condensation on the different classes. Thus, separate groups are constructed from records belonging to different classes, in order to create class-specific sets of condensed groups. We note that the anonymization needs to be performed differently for each classification problem; for example, the use of a different class variable requires a different anonymization process. The pseudo-data ACM Transactions on Database Systems, Vol. V, No. N, Month 20YY.
19
20
·
Aggarwal and Yu Data Set
Size of Training
Dimensionality
Ionosphere Ecoli Pima Abalone
251 236 668 4177
34 7 8 7
Table II.
Running Time 0.5 0.2 0.7 4.7
sec. sec. sec. sec.
Size of Data Sets with Dimensionality and Running Times
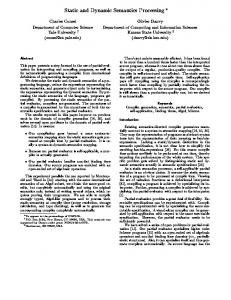
for a class is generated from the groups corresponding to the same class. These pseudo-records can be used in conjunction with any kind of classifier such as a kNN classifier or a C4.5 classifier. The test data records used were the true records for classification purposes. The results show that the technique is able to achieve high levels of privacy without noticeably compromising classification accuracy. In fact, in many cases, the classification accuracy improves than that over the baseline classifier. A number of real data sets from the UCI machine learning repository3 were used for the testing. The specific data sets used were the Ionosphere, Ecoli, Pima Indian, and the Abalone Data Sets. Except for the Abalone data set, each of these data sets correspond to a classification problem. In the Abalone data set, the aim of the problem is to predict the age of Abalone, which is a regression modeling problem. For this problem, we continued to treat it as a classification problem, and the classification accuracy measure used was the percentage of time that the age was predicted exactly. The original data set was divided into the training and the test data repeatedly using a bootstrap methodology. In each case, we used a sample of 100 data points from the full data in order to construct the test data, and computed the accuracy over the test data only. We averaged the results over 10 bootstraps. The results on classification accuracy for the Ionosphere, Ecoli, Pima Indian, and Abalone data sets are illustrated in Figures 5(a), 6(a), 7(a) and 8(a) respectively. In each of the charts, the average group size is plotted on the X-axis. The minimum group size k (or indistinguishability level) is typically closely related to this value and is only slightly below the average group size. On the Y-axis, we have plotted the classification accuracy of the nearest neighbor classifier, when the condensation technique was used. Three sets of results have been illustrated on each graph: —The accuracy of the nearest neighbor classifier when static condensation was used. In this case, the static version of the algorithm was used in which the entire data set was used for condensation. —The accuracy of the nearest neighbor classifier when dynamic condensation was used. In this case, the data points were added incrementally to the condensed groups. —We note that when the group size was chosen to be one for the case of static condensation, the result was the same as that of using the classifier on the original data. Therefore, a horizontal line (parallel to the X-axis) is drawn in the graph which shows the baseline accuracy of using the original classifier. This horizontal line intersects the static condensation plot for a groups size of 1. In Table II, 3 http
: //www.ics.uci.edu/˜mlearn
ACM Transactions on Database Systems, Vol. V, No. N, Month 20YY.
On Static and Dynamic Methods for Condensation Based Privacy-Preserving Data Mining
·
IONOSPHERE DATA SET (1−NEAREST NEIGHBOR) 1
0.95
CLASSIFICATION ACCURACY
0.9
0.85
0.8
0.75
0.7
0.65
0.6 ACCURACY (STATIC CONDENSATION) ACCURACY (DYNAMIC CONDENSATION)
0.55
ACCURACY (ORIGINAL DATA) 0.5
0
5
10
15
20 25 30 AVERAGE GROUP SIZE
35
40
45
50
(a) IONOSPHERE DATA SET (STATISTICAL COMPATIBILITY) 1
COVARIANCE COMPATIBILITY COEFFICIENT
0.95
0.9
0.85
0.8
0.75
0.7
0.65
0.6
COMPATIBILITY COEFF. (STATIC CONDENSATION) COMPATIBILITY COEFF. (DYNAMIC CONDENSATION)
0.55
0
5
10
15
20 25 AVERAGE GROUP SIZE
30
35
40
45
(b) Fig. 5.
(a) Classifier Accuracy and (b) Covariance Compatibility (Ionosphere)
we have illustrated the data set sizes and dimensionalities for all data sets which were tested above. The data set sizes do not include the points which were used for testing. These data sets are relatively small, which are more difficult from a privacy point of view, but easier from a computational point of view. Later, in Figure 11, we will examine the more difficult case for data streams. In each case, we note that the pseudo-data generation process required under a second to execute. This shows the relatively high efficiency of the procedure. An interesting point to note is that when dynamic condensation is used, the result of using a group size of 1 does not correspond to the original data. This is because of the approximation assumptions implicit in the splitting algorithm of the dynamic condensation process. Specifically, the splitting procedure assumed a uniACM Transactions on Database Systems, Vol. V, No. N, Month 20YY.
21
22
·
Aggarwal and Yu ECOLI DATA SET (1−NEAREST NEIGHBOR) 1 ACCURACY (STATIC CONDENSATION) ACCURACY (DYNAMIC CONDENSATION) ACCURACY (ORIGINAL DATA)
0.95
CLASSIFICATION ACCURACY
0.9
0.85
0.8
0.75
0.7
0.65
0.6
0.55
0.5
0
5
10
15 AVERAGE GROUP SIZE
20
25
30
(a) ECOLI DATA SET (STATISTICAL COMPATIBILITY) 1.005 COVARIANCE COMPATIBILITY COEFF. (STAT. COND.) COVARIANCE COMPATIBILITY COEFF. (DYN. COND.)
COVARIANCE COMPATIBILIY COEFFICIENT
1
0.995
0.99
0.985
0.98
0.975
0.97
0.965
0.96
0
5
10 15 AVERAGE GROUP SIZE
20
25
(b) Fig. 6.
(a) Classifier Accuracy and (b) Covariance Compatibility (Ecoli)
form distribution of the data within a given condensed group of data points. Such an approximation tends to lose its accuracy for very small group sizes. However, it should also be remembered that the use of small group sizes is not very useful anyway from the point of view of privacy preservation. Therefore, the behavior of the dynamic condensation technique for very small group sizes is not necessarily an impediment to the effective use of the algorithm, but it does guide the range of sizes in which it is useful. One of the interesting conclusions from the results of Figures 5(a), 6(a), 7(a) and 8(a) is that the static condensation technique often provided better accuracy than the accuracy of a classifier on the original data set. The effects were particularly pronounced in the case of the ionosphere data set. As evident from Figure 5(a), the ACM Transactions on Database Systems, Vol. V, No. N, Month 20YY.
On Static and Dynamic Methods for Condensation Based Privacy-Preserving Data Mining
·
PIMA INDIAN DATA SET (1−NEAREST NEIGHBOR) 1 ACCURACY (STATIC CONDENSATION) ACCURACY (DYNAMIC CONDENSATION) ACCURACY (ORIGINAL DATA)
0.95
CLASSIFICATION ACCURACY
0.9
0.85
0.8
0.75
0.7
0.65
0.6
0.55
0.5
0
10
20
30 40 AVERAGE GROUP SIZE
50
60
70
60
70
(a) PIMA INDIAN DATA SET (STATISTICAL COMPATIBILITY) 1
COVARIANCE COMPATIBILITY COEFFICIENT
0.95
0.9
0.85
0.8
0.75 COVARIANCE COMPATIBILITY COEFF. (STAT. COND.) COVARIANCE COMPATIBILITY COEFF. (DYN. COND.) 0.7
0
10
20
30 40 AVERAGE GROUP SIZE
50
(b) Fig. 7.
(a) Classifier Accuracy and (b) Covariance Compatibility (Pima Indian)
accuracy of the classifier on the statically condensed data was higher than the baseline nearest neighbor accuracy for almost all group sizes. The reason for this was that the process of condensation affected the data in two potentially contradicting ways. One effect was to add noise to the data because of the random generation of new data points with similar statistical characteristics. This resulted in a reduction of the classification accuracy. In some cases, the classification accuracy improved over that of a baseline classifier. This improvement was sometimes quite significant. For example, in the case of the ionosphere data set, the maximum improvement over the baseline had a tstatistic of 1.89. One possible explanation is that the aggregate statistics of each cluster of points often mask the effects of a particular anomaly in it. This results in ACM Transactions on Database Systems, Vol. V, No. N, Month 20YY.
23
24
·
Aggarwal and Yu ABALONE DATA SET (1−NEAREST NEIGHBOR) 0.5 ACCURACY (STATIC CONDENSATION) ACCURACY (DYNAMIC CONDENSATION) ACCURACY (ORIGINAL DATA)
0.45
CLASSIFICATION ACCURACY
0.4
0.35
0.3
0.25
0.2
0.15
0.1
0.05
0
0
10
20
30 40 AVERAGE GROUP SIZE
50
60
70
60
70
(a) ABALONE DATA SET (STATISTICAL COMPATIBILITY) 1.004 COVARIANCE COMPATIBILITY COEFF. (STAT. COND.) COVARIANCE COMPATIBILITY COEFF. (DYN. COND.)
COVARIANCE COMPATIBILITY COEFFICIENT
1.002
1
0.998
0.996
0.994
0.992
0.99
0
10
20
30 40 AVERAGE GROUP SIZE
50
(b) Fig. 8.
(a) Classifier Accuracy and (b) Covariance Compatibility (Abalone)
a more robust classification model. We note that the effect of anomalies in the data are also observed for a number of other data mining problems such as clustering [20]. While this paper studies classification as one example, it would be interesting to study other data mining problems as well. 4.1
Dynamic Classification
The use of dynamic classification also demonstrated some interesting results. While the absolute classification accuracy was not quite as high with the use of dynamic condensation, the overall accuracy continued to be almost comparable to that of the original data for modestly sized groups. The difference between the static and dynamic methods was often quite significant. For example, the maximum difference ACM Transactions on Database Systems, Vol. V, No. N, Month 20YY.
On Static and Dynamic Methods for Condensation Based Privacy-Preserving Data Mining
·
between the static and dynamic condensation methods was achieved at a group size of about 20 in Figure 5(a). At this point the paired t-test shows a statistic of 6.79 which suggests a high level of statistical difference. In the case of the Ecoli data set in Figure 6(a), the curves for the static and dynamic cases were overlapping across the spectrum, except for the initial part with anonymity level less than 15. The maximum difference between the two methods was achieved for a group size of 10, and corresponds to a t-statistic of 3.81. The comparative behavior of the static and dynamic condensation methods is because of the additional assumptions used in the splitting process of the latter. We note that the splitting process uses a uniform distribution assumption within a particular locality (group). While this is a reasonable assumption for reasonably large group sizes within even larger data sets, the assumption does not work quite as effectively when either of the following is true: —When the group size is too small, then the splitting process does not estimate the statistical parameters of the two split groups quite as robustly. —When the group size is too large (or a significant fraction of the overall data size), then a set of points can no longer be said to represent a locality of the data. Therefore, the use of the uniformly distributed assumption for splitting and regeneration of the data points within a group is not as robust in this case. These results are reflected in the behavior of the classifier on the dynamically condensed data. In many of the data sets, the classification accuracy was sensitive to the size of the group. While the classification accuracy reduced up to the use of a group size of 10, it gradually improved with increasing group size. In most cases, the classification accuracy of the dynamic condensation process was comparable to that on the original data. Furthermore, the accuracy of the classifier on the static and dynamically condensed data was somewhat similar for modest group sizes between 25 to 50. One interesting result which we noticed was for the case of the Pima Indian data set. In this case, the classifier worked more effectively with the dynamic condensation technique as compared to that of static condensation. The reason for this was that the data set seemed to contain a number of classification anomalies which were removed by the splitting process in the dynamic condensation method. Thus, in this particular case, the splitting process seemed to improve the overall classification accuracy. The maximum difference between the static and the dynamic methods was achieved for a group size of about 10. At this point the t-statistic for the difference between the static and dynamic methods was about 3.05. Another interesting behavior of the data set was that the accuracy of the static method first increased from 5 to 30 (with t-statistic difference of 4.12), and then reduced from 30 to 60 with t-statistic difference of 3.65. While it is clear that the effects of the condensation process on classification tends to be data specific, it is important to note that the accuracy of the condensed data is quite comparable to that of the original classifier. One observation that we make is that many off-the-shelf classifiers do not behave well with skewed data sets. This is because simple classifiers such as reporting the majority class are quite accurate for the case of skewed data sets. In many cases, such accuracies can be higher than those of off-the-shelf classifiers. However, for the data sets used in the paper, the classification accuracies of the algorithms ACM Transactions on Database Systems, Vol. V, No. N, Month 20YY.
25
26
·
Aggarwal and Yu
1
CLASSIFICATION ACCURACY
0.9
0.8
0.7
0.6
ACCURACY (STATIC CONDENSATION)
0.5
ACCURACY (DYNAMIC CONDENSATION) ACCURACY (ORIGINAL DATA) 0.4
0
100
200
300
400 500 600 AVERAGE GROUP SIZE
700
800
900
1000
900
1000
(a) 1
CLASSIFICATION ACCURACY
0.9
0.8
0.7
0.6
0.5
ACCURACY (STATIC CONDENSATION) ACCURACY (DYNAMIC CONDENSATION) ACCURACY (ORIGINAL DATA)
0.4
0
100
200
300
400 500 600 AVERAGE GROUP SIZE
700
800
(b) Fig. 9. (a) Classifier Accuracy: NN Classifier and (b) Classifier Accuracy: C4.5 (Forest Cover Data Set)
Data Set
p-NN p = 8
C4.5
CBA (Rule Based)
Ionosphere Ecoli Pima Abalone
86.3,86.1,85.4 82.7,83.1,81.0 73.5,72.9,73.1 19.8,20.3,19.2
85.9,85.3,85.6 83.1,82.2,80.3 70.5,71.1,68.4 21.3,21.4,20.7
86.2,85.7,85.9 83.0,82.1,82.0 71.2,70.5,70.1 21.7,21.1,20.6
Table III. Effectiveness of Different Classifiers with minimum group size (indistinguishability level) k = 10 (Original, Static, Dynamic) ACM Transactions on Database Systems, Vol. V, No. N, Month 20YY.
On Static and Dynamic Methods for Condensation Based Privacy-Preserving Data Mining
·
used are significantly higher than those of simple classifiers such as the majority classifier. For example, for the case of abalone, which is the most skewed data set, the majority class classifier had an accuracy of 16.4%. On the other hand, the nearest neighbor classifier had an accuracy of about 19%. Other classifiers reported in Table III had accuracies higher than 20%.
4.2
Preservation of Covariance Characteristics
We also compared the covariance characteristics of the data sets. The results are illustrated in Figures 5(b), 6(b), 7(b) and 8(b) respectively. It is clear that in each data set, the value of the statistical correlation µ was almost 1 for each and every data set for the static condensation method. In most cases, the value of µ was larger than 0.98 over all ranges of groups sizes and data sets. While the value of the statistical correlation reduced slightly with increasing group size, its relatively high value indicated that the covariance matrices of the original and perturbed data were virtually identical. This is a very encouraging result since it indicates that the approach is able to preserve the inter-attribute correlations in the data effectively. The results for the dynamic condensation method were also quite impressive, though not as accurate as the static condensation method. In this case, the value of µ continued to be very high (> 0.95) for two of the data sets. For the other two data sets, the value of µ reduced to the range of 0.65 to 0.75 for very small group sizes. As the average group sizes increased to about 20, this value increased to a value larger than 0.95. We note that in order for the indistinguishability level to be sufficiently effective, the group sizes also needed to be at least 15 or 20. This means that the accuracy of the classification process is not compromised in the range of group sizes which are most useful from the point of view of condensation. The behavior of the correlation statistic for dynamic condensation of small group sizes is because of the splitting process. It is a considerable approximation to split a small number of discrete points using a uniform distribution assumption. As the group sizes increase, the value of µ increases because of the robustness of using a larger number of points in each group. However, increasing group sizes beyond a certain limit has the opposite effect of reducing µ (slightly). This effect is visible in both the static and dynamic condensation methods. The second effect is because of the greater levels of approximation inherent in using a uniform distribution assumption over a larger spatial locality. We note that when the overall data set size is large, it is more effectively possible to simultaneously achieve the seemingly contradictory goals of using the robustness of larger group sizes as well as the effectiveness of using a small locality of the data. This is because a modest group size of 30 truly represents a small data locality in a large data set of 10000 points, whereas this cannot be achieved in a data set containing only 100 points. We note that many of the data sets tested in this paper contained less than 1000 data points. These constitute difficult cases for our approach. Yet, the condensation approach continued to perform effectively both for small data sets such as the Ionosphere data set, and for larger data sets such as the Pima Indian data set. In addition, the condensed data often provided more accurate results than the original data because of removal of anomalies from the data. ACM Transactions on Database Systems, Vol. V, No. N, Month 20YY.
27
28
4.3
·
Aggarwal and Yu
Larger Groups Sizes
We also tested the effectiveness for the case of large condensation group sizes for the larger data sets, and the use of other classifiers than the NN classifier. In Figure 9(a) and (b), we have illustrated the effect of using large group sizes on the forest cover data set. We used two different classifiers: namely the nearest neighbor classifier and the C4.5 classifier. In this case, the group sizes are allowed to extend all the way up to 1000. The trend in the figure shows that the accuracy levels off with increasing group size. This is true for both the classifiers illustrated in Figures 9(a) and 9(b). In Table III, we have illustrated the behavior of the approach for different data sets and classifiers. We have used a 8-nearest neighbor classifier, the association based classification algorithm (CBA), and C4.5. For each entry in the Table, we have illustrated three values corresponding to the accuracy on the original data, the statically perturbed data and the dynamically perturbed data respectively. The value of the minimum anonymity level was 10 in each case. We see that the classification accuracy results after the privacy transformation are comparable to those on the original data set. In some cases, the accuracies on the transformed data are even higher than those on the original data. This shows that the results are not only robust to increasing group size, but they also work well with other kinds of classifiers. In a later section, we will also show the effectiveness of the method for other kinds of problems such as association rule mining. 4.4
Effectiveness and Efficiency Results for Data Streams
In this section, we will illustrate some efficiency results for the case of data streams. The real data sets were some of the larger sets from the UCI machine learning repository. We used the KDD Cup 1999 data set for network intrusion detection, and the forest cover data set. In each case, we have illustrated the accuracy of classification using three techniques. We note that the stream classification method had a number of approximations over and above the dynamic classification method. The results for the Network Intrusion data set are illustrated in Figure 10(a), and the results for the forest cover data set are illustrated in Figure 10(b). The buf f ersize used was 20 and the group size used was 30. The value of Cgap used was 500. We groups size was chosen at the larger end of the spectrum in order to test the behavior for higher anonymity levels. We note that a small buffersize were intentionally picked so that the algorithm could be executed in a small amount of storage. This provides effectiveness results for conservative storage scenarios. The value of Cgap was related to the buffersize and the number of groups. Specifically, the value of Cgap was chosen to be about 20% smaller than buggersize ∗ groupsize = 600. This ensures that the eigenvectors are updated only when a sufficient number of data points have arrived in order to approximately replace the data points represented in the previous set of groups. The progression of the data stream is illustrated on the X-axis, and the classification accuracy is illustrated on the Y-axis. The label “StreamGen (Exact)” corresponds to the case when the eigenvectors are computed in each iteration. The label “StreamGen (Approx)” corresponds to the case in which the eigenvectors are computed every Cgap iterations. The k-nearest neighbor was executed using all points arrived up to now, but not including the test point. The classification accuracy is computed on the last window of 1000 data points. ACM Transactions on Database Systems, Vol. V, No. N, Month 20YY.
On Static and Dynamic Methods for Condensation Based Privacy-Preserving Data Mining
·
100 ORIGINAL DATA STREAM GEN. (EXACT) STREAM GEN. (APPROX.)
ACCURACY
95
90
85
0.4
0.8 1.2 1.6 PROGRESSION OF STREAM (NO. OF POINTS)
2 5
x 10
(a) 100 ORIGINAL DATA STREAM GEN. (EXACT) STREAM GEN. (APPROX.) 95
ACCURACY
90
85
80
75
0.32
0.64 0.96 1.28 1.6 PROGRESSION OF STREAM (NO. OF POINTS)
5
x 10
(b) Fig. 10. Classifier Accuracy with Data Stream Progress (a) Network Intrusion Data Set (b) Forest Cover Data Set
In each case, it turns out that the classification accuracy degraded only slightly because of the privacy-preservation process. Furthermore, the use of approximations for second-order statistics turned out to be quite effective in practice. The t-statistic difference between the exact and approximate methods was 1.81. The absolute degradations in accuracy are typically fairly small, and are typically less than the variations across the progression of the data stream. This is because the eigenvectors did not change significantly unless a sufficient number of new points are received. In Figure 11, we have illustrated the rate of processing of the different streams for the same choice of parameters. These were the same parameter settings for the accuracy results. On the X-axis, we have illustrated the progression of the data stream, and the Y-axis illustrates the rate of processing for the latest stream ACM Transactions on Database Systems, Vol. V, No. N, Month 20YY.
29
·
30
Aggarwal and Yu
5000
PROCESSING RATE (POINTS/SECOND)
4500
4000
3500 FOREST COVER DATA SET 3000
NETWORK INTRUSION DATA SET
2500
2000
1500
1000
0
1
2
3 4 5 6 7 PROGRESSION OF STREAM (NO. OF POINTS)
Fig. 11.
8
9
10 4
x 10
Efficiency of Stream Mining Algorithm
segment. We note that the results on the forest cover data set were much more efficient since the 10 (continuous) variables were used. On the other hand, the network intrusion data set had 34 dimensions, and therefore a larger number of updates were required for each data point. In all cases, more than thousands of data points were processed per second. This shows that the method is a efficient and practical technique for very fast data streams. 4.4.1 Choice of Replacement Policy. The results of the previous section discuss the use of a vanilla LRU policy. In this section, we will discuss the effect of the replacement policy on the stream mining algorithm. We tested three different replacement policies (1) The LRU policy (2) The LRU-m policy with m = 5 (3) The random replacement policy. The results for the network intrusion and forest cover data sets are presented in Figures 12(a) and (b). The same choice of parameters was used as in the previous cases. The interesting observation is that both the LRU policies perform more effectively than the random replacement policy. The LRU-m policy is only marginally superior to the LRU policy. The results on the data sets show that the LRU policy is slightly superior to the LRU-m policy in most cases, but in a few cases, the LRU policy happened to be slightly better. Therefore, we chose the LRU policy because of its ease in implementation. While the random replacement policy was also reasonably good on the average, it sometimes performed quite poorly. This was especially the case when the network intrusion data set was used. This is because of the fact that there are often sudden changes in the network intrusion data stream. In such cases, the random replacement policy performed quite poorly. We note that the effectiveness of the LRU-type replacement policies depends upon temporal locality. In cases, where there is no temporal locality, any of the techniques can be more or less effective. For example, when we used a randomized order of arrival of the data points for the Forest Cover Data Set, the effectiveness of different replacement policies varied at different points in the data stream. The results are illustrated in Figure 12(c). ACM Transactions on Database Systems, Vol. V, No. N, Month 20YY.
On Static and Dynamic Methods for Condensation Based Privacy-Preserving Data Mining
·
100 RANDOM LRU−m LRU
ACCURACY
95
90
85
0.4
0.8 1.2 1.6 PROGRESSION OF STREAM (NO. OF POINTS)
2 5
x 10
(a) 100 RANDOM LRU−m LRU 95
ACCURACY
90
85
80
75
0.32
0.64 0.96 1.28 1.6 PROGRESSION OF STREAM (NO. OF POINTS)
5
x 10
(b) 80 RANDOM LRU−m LRU 75
ACCURACY
70
65
60
55
50
45
0.32
0.64 0.96 1.28 1.6 PROGRESSION OF STREAM (NO. OF POINTS)
5
x 10
(c) Fig. 12. Effect of Replacement Policy (a) Network Intrusion Data Set (b) Forest Cover Data Set (c) Forest Cover Data Set (Randomized Order) ACM Transactions on Database Systems, Vol. V, No. N, Month 20YY.
31
32
·
Aggarwal and Yu 1
SUPPORT COUNT ACCURACY
0.9
0.8
0.7
0.6
0.5
ALL ITEMSETS AT LEAST 3−ITEMS ALL ITEMSETS (UNCORR.)
0.4
AT LEAST 3−ITEMS (UNCORR.) 0
5
10
15 GROUP SIZE
20
25
30
(a) 1
0.95
SUPPORT COUNT ACCURACY
0.9
0.85
0.8
0.75
0.7
0.65 ALL ITEMSETS
0.6
AT LEAST 3−ITEMS ALL ITEMSETS (UNCORR.)
0.55
AT LEAST 3−ITEMS (UNCORR.) 0.5
0
5
10
15 GROUP SIZE
20
25
30
(b) Fig. 13. Association Rule Algorithm (a) T20.I6.D200K (b) Forest Cover (Categorical Soil Type Attributes Only)
4.5
Results for Categorical Data Sets
In this section, we will illustrate some of the results obtained with the use of categorical data sets. For these cases, we will use the association rule mining algorithms in order to illustrate the effectiveness of the technique. For this purpose, we used one synthetic and one real data set. The synthetic data set corresponds to T20.I6.D200K corresponding to the notations in [3]. We also used the categorical attributes of the forest cover data set in order to determine the associations. The accuracy was computed in terms of the average support count accuracy which is defined as follows. Let sq (I) be the true frequency of a given itemset and sc (I) be the computed frequency. Then the support count accuracy is defined as follows: SupportCountAccuracy(I) = 1 −
|sc (I) − sq (I)| sq (I)
ACM Transactions on Database Systems, Vol. V, No. N, Month 20YY.
(8)
On Static and Dynamic Methods for Condensation Based Privacy-Preserving Data Mining
·
This accuracy is averaged over all the computed itemsets in order to obtain the final reported value. In each case, we wish to determined the 1000 itemsets with the largest support and computed the average support count accuracy of these itemsets with increasing level of privacy. We note that since the association rule mining algorithm only uses (local) second-order statistics, we would like to test the accuracy of computation of higher order statistics on a global basis. We note that some amount of higher order correlations are retained even when the pseudo-data is generated from first order statistics only. As discussed earlier, this is because of the biased distribution of the itemsets over different data localities. Therefore, we will also test the case when only first order statistics are used to generate the pseudo-data. In this case, each item is independently generated based on its probability of occurrence within the group. The results for the two data sets are illustrated in Figures 13(a) and 13(b). In each case, we have illustrated the group size (anonymity level) on the X-axis. On the Y -axis, we have calculated the percentage accuracy in the support counts with increasing group size. In order to show the behavior on higher order itemsets, we have also illustrated the accuracy with only 3-itemsets or higher. We have also illustrated the case when first order statistics is used for the pseudo-data generation process. These curves are marked with the label “UNCORR” to denote the fact that the items were generated in an uncorrelated way within each group. In the case of the forest cover data set, almost all the itemsets had more than 3-items and the majority had 4 or more than 4 items. The results show that the accuracy in computing the support counts of higher order itemsets is only slightly lower than those of all the itemsets. The reason for this is that while second-order statistics are stored, this approximation is only performed on a local basis within tightly clustered groups. Since the itemsets are highly biased across different groups, this has the effect of maintaining (global) higher order information during the pseudo-generation process. Thus, the choice of group size provides the tradeoff between privacy and the level of higher order information which is maintained. For example, in the extreme case when each group contains only 1 data point, there is no privacy, but the pseudo-data generation preserves the original data (and corresponding higher order information) exactly. With gradual increase in group size, the amount of higher order information retained reduces with corresponding gain in privacy. This tradeoff is illustrated in Figures 13(a) and 13(b). Thus, the results show that the method is able to model the statistical behavior of the data set even from the point of view of higher order correlations. This fact is also reflected in the behavior of the pseudo-data even when first-order statistics are used. While the results from the use of first order statistics are relatively poor compared to the use of second-order statistics, the fact that they maintain any higher order statistics at all is quite remarkable and is attributed to the effectiveness of locality based anonymization. Within each group, only a small number of itemsets are retained with very high support. As a result, some of these higher-order itemsets are also re-generated even when first-order statistics are used. When second-order statistics are used, almost all the higher order itemsets at the group level are retained. This improves the effectiveness of the anonymization process. This also increases the applicability of the method to problems such as association rule mining which require higher order ACM Transactions on Database Systems, Vol. V, No. N, Month 20YY.
33
34
·
Aggarwal and Yu
statistical information. 5.
CONCLUSIONS AND SUMMARY
In this paper, we presented a new way for privacy-preserving data mining of data sets. Since the method re-generates multi-dimensional data records, existing data mining algorithms do not need to be modified to be used with the condensation technique. This is a clear advantage over techniques such as the perturbation method discussed in [2] in which a new data mining algorithm needs to be developed for each problem. Unlike other methods which perturb each dimension separately, this technique is designed to preserve the inter-attribute correlations of the data. As substantiated by the empirical tests, the condensation technique is able to preserve the inter-attribute correlations of the data quite effectively. At the same time, we illustrated the effectiveness of the system on the classification problem. In many cases, the condensed data provided a higher classification accuracy than the original data because of the removal of anomalies from the database. In future work, we will extend this method to the problem of personalized privacy [39] in which we allow varying levels of privacy for different records in the database. The condensation method is particularly suitable to the problem of personalized privacy preservation because of its use of intermediate group statistics. By varying the granularity of this statistics, it may be possible to provide personalized levels of privacy to different records in the database. REFERENCES [1] Agrawal S., Haritsa J. A Framework for High Accuracy Privacy-Preserving Data Mining. ICDE Conference, 2005. [2] Agrawal R., Srikant R.: Privacy-Preserving Data Mining. Proceedings of the ACM SIGMOD Conference, (2000). [3] Agrawal R., Srikant R.: Fast Algorithms for Mining Association Rules. VLDB Conference, 1994. [4] Agrawal D. Aggarwal C. C.: On the Design and Quantification of Privacy Preserving Data Mining Algorithms. ACM PODS Conference, 200). [5] Aggarwal C. C.: On k-Anonymity and the Curse of Dimensionality. VLDB Conference, 2005. [6] Aggarwal C. C., Yu P. S.: A Condensation Approach to Privacy-Preserving Data Mining. EDBT Conference, 2004. [7] Atzori M., Bonchi F., Giannotti F., Pedreschi D.: Anonymity Preserving Pattern Discovery. VLDB Journal, to appear, Online version available since November 2006. [8] Bayardo R. J., Agrawal R. Data Privacy through Optimal k-Anonymization. ICDE Conference, 2005. [9] Benassi P. Truste: An Online Privacy Seal Program. Communications of the ACM, 42(2), (1999) 56–59. [10] Brucker P. On the Complexity of Clustering Problems. R. Henn, B. Korte, W. Oettli eds. Optimization and Operations Research, Springer-Verlag 1977, pp. 45–54. [11] Chawla C., Dwork C., McSherry F., Smith A., Wee H. Towards Privacy in Public Databases. EU Workshop on Multiparty Protocols, 2004. [12] Blum A., Dwork C., McSherry F., Nissim K. Practical Privacy: The SuLQ Framework. ACM PODS Conference, 2005. [13] Vaidya J., Clifton C.: Privacy-Preserving Association Rule Mining in Vertically Partitioned Data. ACM KDD Conference, (2002). [14] Estivill-Castro V., Brankovic L.: Data Swapping: Balancing Privacy against Precision in Mining for Logic Rules. Lecture Notes in Computer Science Vol. 1676, Springer Verlag (1999) 389–398. ACM Transactions on Database Systems, Vol. V, No. N, Month 20YY.
On Static and Dynamic Methods for Condensation Based Privacy-Preserving Data Mining
·
[15] Evfimievski A., Srikant R., Agrawal R., Gehrke J.: Privacy-Preserving Mining Of Association Rules. ACM KDD Conference, (2002). [16] Domingo-Ferrer J., Mateo-Sanz J. M.: Practical Data-oriented Micro-Aggregation for Statistical Disclosure Control. IEEE TKDE, 14(1), PP. 189–201, 2002. [17] Fung B., Wang K., Yu P.: Top Down Specialization for Information and PrivacyPreservation. ICDE Conference, 2002. [18] Fung B., Wang K., Yu P.: Anonymizing Classification Data for Privacy Preservation. IEEE Transactions on Knowledge and Data Engineering, 19(5):711725, 2007. [19] Friedman A., Schuster A., Wolff R.: Providing k-anonymity in data mining. VLDB Journal, to appear, Online version available since November 2006. [20] Hinneburg D. A., Keim D. A.: An Efficient Approach to Clustering in Large Multimedia Databases with Noise. ACM KDD Conference, 1998. [21] Kargupta H., Datta S. Wang Q., Sivakumar K. On the Privacy-Preserving Properties of Random Data Perturbation Techniques. ICDM Conference, 2003. [22] Iyengar V. S.: Transforming Data To Satisfy Privacy Constraints. ACM KDD Conference, 2002. [23] LeFevre K, DeWitt D., Ramakrishnan R. Incognito: Efficient Full Domain K-Anonymity. ACM SIGMOD Conference, 2005. [24] LeFevre K, DeWitt D., Ramakrishnan R. Workload-Aware Anonymization. ACM KDD Conference, 2006. [25] Liew C. K., Choi U. J., Liew C. J.: A Data Distortion by Probability Distribution. ACM TODS Journal, 10(3) (1985) 395-411. [26] Lakshmanan L. V. S., Ng R. T., Ramesh G.: To Do or Not to Do: The Dilemma of Disclosing Anonymized Data. ACM SIGMOD Conference, (2005). [27] Lau T., Etzioni O., Weld D. S.: Privacy Interfaces for Information Management. Communications of the ACM, 42(10) (1999), 89–94. [28] Liu K., Kargupta H., Ryan J.: Random Projection Based Multiplicative Data Perturbation for Privacy Preserving Data Mining, IEEE TKDE, 18(1), 2006. [29] Meyerson A., Williams R. On the Complexity of Optimal k-Anonymity. ACM PODS Conference, 2004. [30] Machanavajjhala A., Gehrke J., Kifer D. ℓ-Diversity: Privacy beyond k-Anonymity. IEEE ICDE Conference, 2006. [31] Mishra N., Sandler M.: Privacy via pseudo-random sketches. PODS Conference, pp. 143– 152, 2006. [32] Murthy S.: Automatic Construction of Decision Trees from Data: A Multi-Disciplinary Survey. Data Mining and Knowledge Discovery, Vol. 2, (1998), 345–389. [33] Nabar S., Marthi B., Kenthapadi K., Mishra N., Motwani R.: Towards Robustness in Query Auditing. ACM PODS Conference, 2005. [34] Pferschy U., Rudolf R. Woeginger G.: Some Geometric Clustering Problem. Nordic Journal of Computing, pp. 246–263, 1994. [35] Reiss S.: Practical Data Swapping: The First Steps. ACM TODS Journal, 9(1), pp. 20–37, 1984. [36] Rizvi S., Haritsa J.: Maintaining Data Privacy in Association Rule Mining. VLDB Conference, 2002. [37] Silverman B. W.: Density Estimation for Statistics and Data Analysis. Chapman and Hall, 1986. [38] Samarati P. Protecting Respondents Identities in Microdata Release. IEEE TKDE, 13(6): 1010–1027, 2001. [39] Xiao X., Tao Y.: Personalized Privacy Preservation. ACM SIGMOD Conference, 2006. [40] Zhong S., Yang Z., Wright R. Privacy-Enhancing k-Anonymization of customer data. ACM PODS Conference, 2005.
ACM Transactions on Database Systems, Vol. V, No. N, Month 20YY.
35