dynamic buckling load for simple time-histories of the applied load. ..... spline interpolation to analyze thin walled structures composed by plate assemblies. ...... ing and experimental activities on the vehicle dynamics of a pickup truck impacting.
Finite element based reduction methods for static and dynamic analysis of thin-walled structures
Finite element based reduction methods for static and dynamic analysis of thin-walled structures
Proefschrift ter verkrijging van de graad van doctor aan de Technische Universiteit Delft, op gezag van de Rector Magnificus Prof.dr.ir. J.T. Fokkema, voorzitter van het College voor Promoties, in het openbaar te verdedigen op 15 December om 15.00 uur
door Paolo TISO Master of Science in Aerospace Engineering, Politecnico di Milano, Italy Master of Science in Civil Engineering, Worcester Polytechnic Institute, Worcester, MA, USA geboren te Varese, Italy
Dit proefschrift is goedgekeurd door de promotoren: Prof.dr. Z. G¨ urdal
Samenstelling promotiecommissie: Rector Magnificus, Prof.dr. Z. G¨ urdal, Prof.dr.ir. A. van Keulen, prof.dr.ir. D.J. Rixen, dr. ir. E.L. Jansen, prof. dr. ir. A. de Boer, prof.dr.ir. D.H. van Campen, ir. J.P. Delsemme,
voorzitter Technische Universiteit Technische Universiteit Technische Universiteit Technische Universiteit Universiteit Twente, Technische Universiteit Samtech SA
Delft, promotor Delft, Delft, Delft, Eindhoven,
Publisher: TUDelft, Faculteit Luchtvaart-en Ruimtevaarttechiek Printed by: Sieca Repro Delft ISBN 90-9021336-8 Keywords: Nonlinearity/Finite Elements/Reduction/Thin-walled Structures. c Copyright �2006 by Paolo Tiso All rights reserved. No part of the material protected by this copyright notice may be reproduced or utilized in any form or by any means, electronic or mechanical, including photocopying, recording or by any information storage and retrieval system, without written permission from the publisher: TUDelft, Faculteit Luchtvaart-en Ruimtevaarttechiek Printed in the Netherlands
To my grandma Carla
Forewords
When I started this project four years ago, I was curious about how it would have eventually felt to come to a conclusion. Among all the different feelings, I never thought there would be space for the desire to start it over again. It is partly because I recognize the mistakes I made along the way, partly because I would like to answer so still open questions, partly because there are still many unexplored paths, but above all because I have enjoyed it. This would have been impossible without the help of many people. I have been lucky to have it in abundance. Prof. Zafer G¨ urdal has been an inspiring promotor. He has been a good example of how to conjugate technical insight without ever losing the big picture. The lively atmosphere he established in the group has been instrumental. Eelco Jansen has been more than just an advisor. I can’t remember even the slightest signal of impatience at my too frequent visits to his room for some discussion. Every conversation with Mostafa Abdalla left me with a mixed feeling of frustration for my ignorance and a renewed passion for learning. He has been a brother in encouraging me during the bad days. My committee members also deserve special thanks, for their time and valuable comments on my work. Annemarie van Lienden helped a lot in keeping my disorganization with the paperwork within a safe level. The presence of my family, my mother Angela, my brother Marco, my grandma Carla, Elena, Sergio, Pinuccia, Emilio, Pinuccia and Annalisa has been constant and near. Siro, Stefano, Alessandro and don Agostino demonstrated once again that real friendship does not fear distances. Francesco, Bernadette, Laurens, Martijn, Piddu, Carlo, Emma, Paul, Laura, Babs, Aga, Maria, Elisa, Patrycja, Johanna and all the others, thanks to all for showing me in simplicity a better way to live. Janine’s support, encouragement and patience has been beyond any explanation. Thanks to Jos and Elly for the words of encouragement and for showing me the meaning of gezelligheid. Thanks to all my office mates, Koen, Jeroen, Claudio, Vasco, Ahmad, Tanvir, Agnes, Shahriar, Christian, for standing my jokes, To Roland Notenboom for sharing his immense knowledge in LATEXand for inspiring for the Azzurri celebrative cover, and to Roeland de Breuker for helping me with the translations of the propositions.
Summary
Nonlinear Finite Element (FE) analysis receives growing attention in industrial and research applications. Modern computer facilities together with state of the art commercial finite element programs allow large and complicated analysis to be performed. The nonlinearities of the structural behavior are more and more often taken into account. However, the repeated solution in time of large nonlinear systems of equations stemming from a FE discretization to reproduce the static and dynamic behavior of a general structure is still a computationally intensive task. In the present thesis methods are presented that reduce the number degrees of freedom so that the computational cost is significantly reduced, while a sufficient accuracy of the analysis result is retained. Slender and thin-walled structures constitute main structural components in various engineering areas since they feature a high strength-to-weight and stiffness-to-weight ratio. These structures are prone to function at high displacement levels when subjected to operational loads, while staying in the material linear elastic range. The subject of this thesis is therefore confined to slender and thin-walled structures subjected to static and dynamic loads that trigger geometrical nonlinearities only. Perturbation methods constitute powerful tools for a simplified analysis of nonlinear problems. They are based on a series expansion of the sought solution that generates a sequence of linear problems. The solutions of these linear problems yield the higher order terms of the expansion. Perturbation methods have received a lot of attention in semi-analytical contexts. However, they can also be successfully applied in a finite element framework. In this way the generality of the FE approach is combined with the possibility of substantially reducing the size of the problem at hand. This thesis focuses on the application of perturbation methods in a general finite element framework for relevant nonlinear structural problems. Three main areas of application have been addressed, namely:
1. Initial post-buckling analysis of general structures (including imperfections), 2. Nonlinear free vibrations of general structures, 3. Transient analysis of general structures.
with a special emphasis on beam and shell structures. The well-known Koiter’s perturbation method for the initial post-buckling analysis is first presented and discussed. The method leads to a compact description of
the behavior of the structure after buckling has occurred. The stability characteristics of the considered structure are described through coefficients stemming from the perturbation approach. The effect of geometrical imperfections can be added with a negligible computational cost after the properties of the perfect structure are calculated once for all. The Koiter’s analysis has been implemented in FE by previous researchers. They relied on specially addressed element formulations to avoid locking phenomena. In this thesis, a simple formulation of two-dimensional beam element and a three-dimensional triangular shell element is presented. The formulation avoids complicated ad-hoc treatments of the locking problem and yields good convergence properties. Several examples are shown to prove the formulation and to show the capabilities of Koiter’s analysis. A similar framework has been used for the analysis of nonlinear free vibrations. In this case, the obtained coefficients describe the curvature of the frequency-amplitude relation. The same FE implementation presented for static post-buckling analysis is here successfully employed. Good agreements with available analytical results for beams, plates and cylindrical shells show are obtained. The framework proposed by Koiter can be extended to study buckling under dynamic loads. This method can lead to closed form relations between the static and dynamic buckling load for simple time-histories of the applied load. A careful investigation of the limitation of the method for more complicated cases furnishes useful guidelines for an efficient reduction method for nonlinear transient analysis. An essential ingredient for the perturbation methods are the second order displacement fields. They constitute the second order terms in the Taylor’s expansion of the displacement vector and they model the effect of geometrical nonlinearity when the amplitude of displacements becomes finite. These modes have been used as independent degrees of freedom to be added to a reduction basis formed by vibration modes extracted at a certain equilibrium configurations. The resulting reduction basis proves to be a suitable subspace to project the dynamic equations governing a FE nonlinear transient analysis. Examples of plates and curved panels show the benefits for the approach. In case of applied dynamic loads that can lead to buckling of the structure, the reduction basis has been formed by considering vibration modes and corresponding second order fields at two different static equilibrium configurations, typically the initial configuration and the buckled configuration. Two examples of a short cantilever c-section beam and a beam frame show the effectiveness of the approach and the essential contribution of the modal content at the deformed level to the accuracy of the solution.
Samenvatting
Niet-lineaire Eindige Elementen analyse krijgt een groeiende aandacht in onderzoek en in industri¨ele toepassingen. Moderne computerfaciliteiten in combinatie met ’state-of-the-art’ commerci¨ele Eindige Elementen programma’s maken het mogelijk grote en gecompliceerde problemen te analyseren. De niet-lineariteiten van het gedrag van de constructie worden steeds vaker in beschouwing genomen. De herhaalde berekeningen met grote stelsels vergelijkingen, voortkomend uit een Eindige Elementen discretisatie, om het statisch en dynamisch gedrag van een algemene constructie te simuleren kosten nog steeds zeer veel rekentijd. In dit proefschrift worden methoden gepresenteerd die het aantal graden van vrijheid drastisch reduceren zodat de rekentijd aanzienlijk wordt verminderd, terwijl een voldoende nauwkeurigheid van het analyseresultaat wordt behouden. Slanke en dunwandige constructies vormen de belangrijke constructiecomponenten in verschillende gebieden van de techniek vanwege hun hoge sterkte-gewicht en stijfheid-gewicht verhouding. Deze constructies ondergaan in hun functie grote verplaatsingen door de erop werkende belastingen, maar blijven vaak in het elastische gebied. Dit proefschrift richt zich daarom op slanke en dunwandige constructies onderworpen aan statische en dynamische belastingen die enkel geometrische niet-lineariteit veroorzaken. Storingsmethoden vormen een krachtig gereedschap om een benaderingsoplossing te vinden van niet-lineaire problemen. Deze methoden zijn gebaseerd op een reeksontwikkeling van de gezochte oplossing die resulteert in opeenvolgende lineaire problemen. De oplossingen hiervan bepalen de hogere orde termen van de ontwikkeling. Storingsmethoden hebben veel aandacht gekregen binnen een semi-analytische context. Deze methoden kunnen echter ook toegepast worden binnen een Eindige Elementen omgeving. Op deze manier wordt de algemeenheid van de Eindige Elementen aanpak gecombineerd met de mogelijkheid om de grootte van het probleem aanzienlijk te reduceren. Dit proefschrift richt zich op de toepassing van storingsmethoden in een algemeen Eindige Elementen raamwerk voor relevante niet-lineaire constructieproblemen. Drie belangrijke toepassingsgebieden zijn in beschouwing genomen, namelijk 1. Initi¨ele naknik analyse van algemene constructies (inclusief vormonzuiverheden), 2. Niet-lineaire vrije trillingen van algemene constructies, 3. Transi¨ente analyse van algemene constructies, met een speciale nadruk op balk- en schaalconstructies.
x
De bekende storingsmethode van Koiter voor het initi¨ele naknikgedrag wordt eerst gepresenteerd and bediscussi¨eerd. De methode leidt tot een compacte beschrijving van het gedrag van de constructie nadat knik is opgetreden. De stabiliteitseigenschappen van de beschouwde constructie worden beschreven door co¨effici¨enten verkregen via de storingsmethode. Het effect van geometrische vormonzuiverheden kan worden meegenomen met verwaarloosbare extra rekenkosten nadat de eigenschappen van de perfecte constructie voor eens en altijd zijn berekend. Koiter’s analyse is eerder binnen Eindige Elementen ge¨ımplementeerd door verschillende onderzoekers, die speciale elementformuleringen gebruikten om ’locking’ verschijnselen te omzeilen. In dit proefschrift wordt een eenvoudige formulering van een tweedimensionaal balkelement en een driedimensionaal driehoekig schaalelement gepresenteerd. De formulering vermijdt gecompliceerde ’ad hoc’ behandelingen voor het ’locking’ probleem en heeft goede convergentie-eigenschappen. Verschillende voorbeelden worden getoond om de formulering te verifi¨eren en de mogelijkheden die de methode van Koiter biedt aan te tonen. Een soortgelijk raamwerk kan worden gebruikt voor de analyse van niet-lineaire vrije trillingen. In dit geval beschrijven de verkregen co¨effici¨enten de kromming van de frequentie-amplitude relatie. Een implementatie, overeenkomstig met die in het geval van statische naknik, is met succes toegepast. Er is een goede overeenstemming verkregen met beschikbare analytische resultaten voor balken, platen en cilinderschalen. De aanpak voorgesteld door Koiter kan worden uitgebreid naar het bestuderen van knik onder dynamische belastingen. Deze methode leidt voor eenvoudige tijdsafhankelijkheden van de toegepaste belasting tot relaties in een gesloten vorm tussen de statische en de dynamische kniklast. Een zorgvuldig onderzoek van de beperkingen van de methode voor gecompliceerdere gevallen geeft nuttige richtlijnen voor een effici¨ente reductiemethode voor niet-lineaire transi¨ente analyse. Een essenti¨ele ingredi¨ent voor de storingsmethoden vormen de tweede orde verplaatsingsvelden. Deze komen overeen met de tweede orde termen in de Taylor-reeks van het verplaatsingsveld en zij modelleren het effect van geometrische niet-lineariteit in het geval dat de amplitude van de verplaatsingen eindig wordt. Deze velden kunnen worden gebruikt als onafhankelijke graden van vrijheid die worden toegevoegd aan een gereduceerde basis gevormd door trillingsvormen berekend voor een bepaalde evenwichtsconfiguratie. Aangetoond wordt dat de resulterende gereduceerde basis een geschikte subruimte is waarop de dynamische vergelijkingen in het geval van niet-lineaire transiente Eindige Elementen analyse kunnen worden geprojecteerd. Voorbeelden voor platen en schalen tonen de voordelen van de aanpak. In het geval van toegepaste dynamische belastingen die kunnen leiden tot knik van de constructie kan de gereduceerde basis worden gevormd door trillingsvormen en de
xi
corresponderende tweede orde velden te beschouwen in twee verschillende statische evenwichtsconfiguraties, typisch de initi¨ele, onvervormde configuratie en de geknikte configuratie. Twee voorbeelden van een korte vrijdragende balk met een c-vormige doorsnede en van een balk-raamwerk tonen de effectiviteit van de aanpak en het belang van het meenemen van trillingsvormen in de vervormde configuratie voor de nauwkeurigheid van de oplossing.
Contents
1 Introduction
1
1.1
Background and motivation . . . . . . . . . . . . . . . . . . . . . . .
1
1.2
Literature review . . . . . . . . . . . . . . . . . . . . . . . . . . . . .
3
1.3
Thesis layout . . . . . . . . . . . . . . . . . . . . . . . . . . . . . . .
12
2 Koiter’s analysis for initial post-buckling
15
2.1
Introduction . . . . . . . . . . . . . . . . . . . . . . . . . . . . . . . .
15
2.2
Single mode analysis . . . . . . . . . . . . . . . . . . . . . . . . . . .
17
2.3
Multimode postbuckling analysis . . . . . . . . . . . . . . . . . . . .
25
2.4
Kinematic issues . . . . . . . . . . . . . . . . . . . . . . . . . . . . .
27
2.5
Finite element implementation . . . . . . . . . . . . . . . . . . . . .
31
2.6
Numerical examples . . . . . . . . . . . . . . . . . . . . . . . . . . .
45
2.7
Conclusions . . . . . . . . . . . . . . . . . . . . . . . . . . . . . . . .
77
3 Perturbation analysis for nonlinear vibrations xiii
79
CONTENTS
xiv
3.1
Introduction . . . . . . . . . . . . . . . . . . . . . . . . . . . . . . . .
79
3.2
The perturbation method . . . . . . . . . . . . . . . . . . . . . . . .
80
3.3
Coincident modes . . . . . . . . . . . . . . . . . . . . . . . . . . . . .
86
3.4
Finite element implementation . . . . . . . . . . . . . . . . . . . . .
88
3.5
Numerical results . . . . . . . . . . . . . . . . . . . . . . . . . . . . .
88
3.6
Conclusions . . . . . . . . . . . . . . . . . . . . . . . . . . . . . . . .
96
4 From static analysis to dynamic analysis
103
4.1
Introduction . . . . . . . . . . . . . . . . . . . . . . . . . . . . . . . . 103
4.2
Dynamic buckling . . . . . . . . . . . . . . . . . . . . . . . . . . . . 104
4.3
Transient response . . . . . . . . . . . . . . . . . . . . . . . . . . . . 106
5 Modal reduction for nonlinear transient analysis
111
5.1
Introduction . . . . . . . . . . . . . . . . . . . . . . . . . . . . . . . . 111
5.2
The reduced set of equations . . . . . . . . . . . . . . . . . . . . . . 112
5.3
A load dependence of the projection basis . . . . . . . . . . . . . . . 113
5.4
The perturbation method . . . . . . . . . . . . . . . . . . . . . . . . 116
5.5
Multimode analysis . . . . . . . . . . . . . . . . . . . . . . . . . . . . 120
5.6
Finite element implementation . . . . . . . . . . . . . . . . . . . . . 120
5.7
Selection of the reduction basis . . . . . . . . . . . . . . . . . . . . . 121
5.8
Numerical examples . . . . . . . . . . . . . . . . . . . . . . . . . . . 124
5.9
Curved panel with central loading . . . . . . . . . . . . . . . . . . . 127
CONTENTS
xv
5.10 Short cantilever beam with tip load . . . . . . . . . . . . . . . . . . . 136 5.11 Interpolation of vibration modes . . . . . . . . . . . . . . . . . . . . 142 5.12 Conclusions . . . . . . . . . . . . . . . . . . . . . . . . . . . . . . . . 147 6 Conclusions
149
Chapter 1
Introduction 1.1
Background and motivation
The size of finite element (FE) structural models that are nowadays used in industrial and research applications is steadily growing. Stringent requirements set by customers and certifying agencies boost the need of detailed FE models and complex analysis. Also fueled by the increasing computational power of modern computers and the maturity of commercial general purpose FE programs that are available to the users, nonlinear analysis plays a steadily growing role. The nonlinearities of the structural behavior are increasingly taken into account even in the early stages of the design. However, the repeated solution in time of large nonlinear systems of equations stemming from a FE discretization to reproduce the static and dynamic behavior of a general structure is still a computationally heavy task. The need of reducing the number degrees of freedom of a given model is thus of great importance. The request for efficient reduced order models is of utmost importance in the early design phase when the designer is typically faced with “what if” questions during analysis or when, in some cases, optimization routines are used to generate the best design. Few decades ago, the craftwork of conceiving reduced order models that could grasp the essential behavior of the structure at hand was a welcomed skill for any good engineer. Nowadays, although the physical understanding of the structural phenomenon remains to be a “must” for the skilled analyst, there is a tendency to rely on fine mesh discretization that could serve as a computational model for different 1
Chapter 1
analysis types. It is quite typical, for instance, that the same car model is used for static stress analysis, frequency analysis, crash, etc.. Still, a quick evaluation of the essential characteristics is prohibitive if the number of degrees of freedom is too large. A question clearly arises: is it possible to maintain the generality and the flexibility of the finite element method and still generate reduced order models that are able to reproduce the essential nonlinear behavior in a prompt way? The answer is positive. Perturbation methods have been applied to several engineering branches to treat nonlinear problems in a reduced setting. They assume an expansion of the sought solution in a Taylor series expansion. Once the approximated solution is inserted to the governing equations, the method yields a sequence of linear problems. The solution of these linear problems gives the different terms of the expansion of the solution. Their applications have received great attention especially in analytical and semianalytical contexts. However, they can be successfully applied to finite element schemes to unify the advantage of a general geometrical and structural description with a compact representation of the essential nonlinearities. In this work, special emphasis is given to thin-walled structures, which are characterized by high strength-to-weight and stiffness-to-weight ratios. They constitute main structural components in various engineering fields, as aerospace, automotive, biomedical, civil, etc.. Their structural characteristics highlight the importance of geometrical nonlinearities, i.e. nonlinearities stemming from the redirection of internal stresses due to finite deformations. It is often the case that the structure will remain in the elastic range if subjected to the operational loads while undergoing displacement magnitudes that trigger geometrical nonlinearities. This thesis will therefore focus on this structural typology and only geometrical nonlinearities will be considered. Three main areas of application have been highlighted in this thesis, namely
1. Initial post-buckling analysis of general (imperfect) structures, 2. Nonlinear free vibrations of general structures, 3. Transient analysis of general structures.
The analysis of the problems listed above can largely benefit from a perturbation approach combined with a general finite element scheme. The main goal of this thesis 2
Introduction
is to show the applicability of such methods for the solution of relevant engineering problems. In the remainder of this chapter first a review of the relevant literature will be presented followed by a more detailed description of the content of the thesis.
1.2
Literature review
This section presents an overview on the relevant literature of interest for this thesis work. The three main topics outlined in the introduction, namely initial postbuckling analysis, nonlinear vibrations and transient nonlinear dynamics are briefly surveyed with an highlight to perturbation and reduction techniques. Special attention is given to the aspects involved in a finite element implementation of such methods.
1.2.1
Initial post-buckling analysis
Thin-walled structures for structural applications are characterized by high strengthto-weight ratio that often makes the buckling strength the key design criterion. Moreover, some structural configurations lead to sensitivity of the response to geometrical or load imperfections. The structure is said to be ”imperfection-sensitive” and the post-buckling behavior exhibits an unstable path. This can result in a relevant reduction of the maximum load carrying capacity for the imperfect structure with respect to the perfect one. An optimized design often leads to clustering of buckling loads and results in the interaction between different buckling modes in the post-buckling path. This can render the structure extremely imperfection sensitive, and often local and global modes strongly interact. The numerical prediction of the nonlinear response of a general thin-walled structure often relies on non-linear finite element analysis. Complicated post-buckling paths can be tracked by the use of path-following techniques [65]. These methodologies are quite computationally expensive and not practical in a design stage when several analysis are required. In presence of mode interactions, path-following methods require sometimes special tuning to handle such situations. Perturbation methods constitute an important alternative tool in the analysis of structures in the post-buckling range. The founding theoretical framework of such approach can be found in the work of Koiter [43]. The main idea is to expand the displacement field in Taylor series around a certain configuration, typically the 3
Chapter 1
bifurcation point. The terms of the expansion are then found via subsequent linear problems. The above mentioned expansion leads to a closed form of the loaddisplacement curve of the structure. The coefficients of this nonlinear function, often named post-buckling coefficients, are a property of the structure and give a prompt indication on the stability characteristics. These features are directly related to the imperfection sensitivity, i.e. the dependence of the maximum sustainable load on the presence of a deviation of the nominal geometry. Once the perfect (imperfection free) structure has been analyzed, the contribution of the imperfections is just added to the load-displacement function. Many different imperfection shapes and magnitudes can therefore be analyzed at negligible extra computing cost. The method was originally proposed as mono-modal, i.e. the post-buckling behavior considers one mode and its relative higher order correction. The method can be extended [24, 30], to take into account the relevant case of modal interaction in the case of clustered buckling loads. The outcome of the analysis method is a reduced set of non-linear equations that trace trajectories in the load vs. mode amplitudes space. The kinematical description, i.e. the relation between displacements and strains, has a big impact on the accuracy of the calculation of the post-buckling coefficients. In the usual structural analysis practice, simplified kinematical assumptions (often called technical ) are used. They are based on ad hoc assumptions that neglect kinematical terms regarded as small. These models neither enjoy the accuracy of generality nor the analytical simplicity of the linear theory. A first highlight on the difficulties in transferring the procedure into a computational framework was pointed out, among others, by the work of Pignataro and Di Carlo [51]. They refer to nonlinear beam models with respect to asymptotic analysis. The main outcome of their work is the need of using exact kinematical models when implementing asymptotic approach. They show how all the technical theories fail to predict the post-buckling behavior even for the most standard problems. For plate and shell analysis, it is not easy to rely on exact kinematical models. These are often too cumbersome to derive and computationally intensive. A compromise has to be reached by selectively retain some nonlinear terms of the Green-Lagrange strain tensor to preserve a reasonable accuracy for the post-buckling coefficients and avoid issues in the case of statically determined structures. This aspect is tackled by di Lanzo and Garcea [48]. They show that technically accurate results can be achieved with approximate kinematical models since the redistribution of stresses often occurring after buckling for plate-like structures mitigates the issues encountered for beam frame problems. The Koiter’s method framework can be directly cast into dynamic buckling analysis, i.e. instability occurring under transient loads, as shown in the early work by Budiansky [14]. This work presents an elegant and simple way to compute dy4
Introduction
namic buckling estimates by taking into account all the information gathered from a previous Koiter’s analysis. The inertia terms are added to the reduced equilibrium equation(s) and the resulting ordinary differential equations are solved. Different examples considering the single and multimode approaches are presented and the differences between the static and dynamic buckling critical load for a given structure are presented. An application of the aforementioned contribution can be found in the work by Schokker et al. [66]. This study considers the problem of the dynamic behavior of a composite shell under dynamic pressure loading and compression. In particular, the Koiter’s asymptotic procedure is used in conjunction with a p-version finite element. A step load with infinite duration is considered, and only the lowest buckling mode is used in the analysis, assumed equal to the vibration mode. Their work involves also a convergence study of the frequency with different meshes and p-refinements. Following the idea of [14], an ordinary differential equation is obtained and solved numerically. As proposed by Budiansky and Roth [15], the shell is considered ”dynamically buckled” when the amplitude of vibrations increases indefinitely). All the configurations studied show a reduction in the dynamic buckling with respect to the static. Some comments on the assumption of considering the buckling mode equal to the vibration modes are given.
1.2.2
Finite Element Implementation
For many years the work of Koiter’s has been regarded as a powerful tool to frame the stability behavior of structures of academic interest, but unsuitable for a general FE implementation. As a matter of fact, if standard compatible finite element formulation is used in the Koiter’s framework, the predicted post-buckling behavior exhibits, in most of the cases, gross discrepancies with the real behavior. Great research efforts have been addressed to a proper implementation of the Koiter’s method into a FE context. An implementation of the multi-mode method within a numerical context can be found in Erp and Menken [32, 33]. They present a finite-strip method based upon B3 spline interpolation to analyze thin walled structures composed by plate assemblies. They assume spline interpolation of displacements in the longitudinal direction and polynomial interpolation in the transversal direction for each strip. This approach, compared to the classical finite strip based on Fourier series interpolation, can better deal with localized non periodic buckling modes and avoid the need of time consuming reanalysis to find the appropriate Fourier expansion. The ability of this method to well represent local buckling is particularly useful in case of mode interac5
Chapter 1
tion in the post-buckling range. The numerical example shown (a simply supported T beam loaded by a transverse concentrated force) nicely shows this property. In Menken et al. [54] the same procedure is compared with laboratory experiments. This work shows the correctness of the idea to follow the post-buckling behavior with few relevant modes. Other researchers have focused on the poor reproduction of the post-buckling behavior when the Koiter’s method is employed together with finite elements. A major issue in the implementation is the poor convergence of the post-buckling coefficients with respect to mesh refinement when standard compatible finite elements are employed. Good contributions to this field can be found in the works by Olesen and Byskov [40] and Poulsen and Damkilde [57]. The computation of the second order fields involves element strain and stresses from the fundamental solution and the first order fields. These quantities, though accurate in average, can show a mismatch between the membrane and the bending components. In a nonlinear kinematical model, the membrane strains do not only involve in-plane displacements but also out-of-plane components. Due to the different interpolation of the in-plane and out-of-plane displacements in a compatible finite element formulation, the convergence to the correct strains is possible only with an exceedingly large number of elements. The paper by Olesen and Byskov [40] proposes an a posteriori correction to the post-buckling strains that preserves the finite element formulation employed. The faster convergence is shown for a two beam frame (the so-called Roorda’s frame) for two different load cases, for which the analytical solution is available. The work reported in [57] follows a different approach. While realizing the same reason for the poor convergence of the post-buckling coefficients, they propose to add a stress field resulting from the internal forces redistribution in the buckled configuration. This is shown explicitly for a two nodes compatible beam model and leads to a selective enrichment of the internal nodes of the element, selective meaning that the number of extra nodes is different for the in-plane and out-of-plane components of the displacements. The out-of-plane correction is necessary in the determination of the first post-buckling coefficient and raises the order of the out-of-plane displacements to 5th , while the in-plane refinement is used in the calculation of the curvature for the post-buckling behavior. The order of the in-plane displacement interpolation within an element is 5th . The accuracy of the approach is shown via three examples, namely a simply supported column, a the Roorda’s frame and a shallow arch. The results of generalization of the method to plate elements are also presented. Following the idea exposed by [51], research has been done also on the finite element implementation of elements based upon refined kinematical assumptions. Relevant contributions for beam theory can be found in [16, 17, 34]. Salerno and di Lanzo [34] remark the importance of a consistent (geometrically exact) kinematical model for the correct reproduction of the post-buckling behavior. The paper deals with 6
Introduction
two-dimensional beam structures. The solution proposed in this paper tackles the problem directly at the continuum level by defining some strain measures constant through the element. The 2D finite element developed is based upon a consistent kinematical model proposed by Antman [8] and relies on special shape functions, chosen equal to the solution of the buckling problem. This choice shows an extremely fast convergence in the determination of the initial post-buckling coefficients. The element is tested with classical examples also involving mode interaction, and the solution is compared with a path-following technique. The work by Salerno and di Lanzo [34] can be considered as an extension of the work by Pacoste and Eriksson [16]. Their paper first presents a brief classification of critical points and their properties. Then different finite element models are developed on Antman’s [8] kinematical model. As in [34], the element deformation is divided in four modes dependent on the nodal quantities (axial extension, rigid rotation, one and two waves bending). The in- and out-of-plane displacements are interpolated linearly, while the elastic rotation is interpolated quadratically, as usual. The developed elements are based upon different truncation level of a series expansion of the function of the elastic rotation present in the potential energy of the element. The locking phenomena is solved with the same technique later proposed in [34]. The test results involve not only perturbation analysis but also path-following techniques to assess the validity of the proposed elements in a broader context. On the same research line Pacoste and Eriksson investigated the possibility of using co-rotational formulation [17]. The need for a highly nonlinear strain measure can be thought as a consequence of the choice of a total lagrangian formulation. The use of a co-rotational formulation could then allow for a low-order nonlinear theory to be used. This apparent simplification, however, is counteracted by the introduction of nonlinear terms in the transformations of coordinate systems. This works deals with a co-rotational formulation for 3D beam elements based upon the so called ”rotational vector”. This leads to symmetric stiffness matrices and avoids a special procedure for the updating of the rotational variables. Different solutions to the locking problem have been proposed, namely by adding special bubble functions to the local solutions [47, 48] or relying on a mixed formulation,[35] with consequent direct interpolation of the strains. Both these two approaches solve the locking problem at the element level. Another type of locking phenomenon has been found and solved by G. Garcea et al. [30, 35, 12, 36] when using compatible formulations. The locking they are dealing with is of extrapolating nature, i.e. directly dependent on the choice of the chosen primary variable. The extrapolation locking is not the same locking as addressed by [57, 40], and it is caused by the interaction between small pre-critical rotations 7
Chapter 1
and high axial/flexural stiffness ratio. This can be avoided by (i) ignoring the precritical rotations (frozen formulation) or (ii) employing a mixed formulation. The first solution, although leading to appreciable results, is of course limiting in the (relevant) case of markedly nonlinear pre-buckling response. The mixed formulation, on the other hand has some computational advantages. The coefficients of the second order expansion are now dependent only on the out-of-plane displacements, and not on a mixed axial-flexural form as in a compatible formulation. This fact avoids also the so-called interpolation locking (as discussed before) caused by the inherent difference in interpolation of axial and flexural terms.
1.2.3
Nonlinear free vibrations
Perturbation methods can also be applied in the study of vibration of imperfect structures subjected to static preloading, as in the work of Wedel-Heinen [70]. This paper presents a perturbation approach to estimate the effect of imperfections and static load on the vibration frequency of a general (thin-walled) structure. The dynamic contribution to the displacement field is expanded in Taylor series accounting for the imperfections and the static response of the imperfect structure. The linear system of equations for the static and dynamic correction fields are then derived by considering different order contributions. Since it is expected that the sensitivity of the vibration frequency to an imperfection in the vibration mode represents the most important case, the further assumption of equal buckling and vibration modes is made. Interaction between vibration and/or buckling modes as well as second order terms are then neglected. Three examples are presented, namely a simple supported beam loaded in the axial direction, a flat plate compressed on two opposite sides and a compressed conical shell. The first two are solved analytically, while the third one is solved via a finite differences program. The results show the importance of considering the presence of imperfection in the computation of the vibration frequency. The discrepancy with the ideal (perfect structure) case is evident in the proximity of the critical load. The frequency, instead of tend to zero, exhibits a minimum for loads smaller than the critical load and increase again afterward. The works by Rehfield address the problem of free [63] and forced [64] finite amplitude vibrations using a perturbation approach. A single mode analysis is considered, i.e. only one vibration mode is associated to a certain frequency of vibration. This work presents strong similarities with the Koiter’s static analysis of [14]. The relation between the frequency and the amplitude of vibration is formally equivalent to the one that relates the load to the buckling mode amplitude in [14]. A general functional description of the theory is given. Two analytical examples are presented, namely a hinged straight beam and a simply supported rectangular plate. For the 8
Introduction
forced vibration case, the frequency-amplitude relation is simply extended with a forcing term that accounts for the projection of the applied load on the considered vibration mode. The application of perturbation methods in nonlinear vibrations has received great attention in the semi-analytical context. The work of Jansen [41], for example, presents studies of anisotropic cylindrical shells. Both nonlinear free vibrations and forced vibrations under different loading conditions are considered by different levels of modeling approximations. This work constitutes an important reference for benchmark cases.
1.2.4
Model reduction for non-linear transient analysis
The need of efficient reduction techniques is even more pronounced for nonlinear dynamic analysis. In order to avoid time consuming development of specially addressed FE models and significantly reduce the computational cost in dynamic analysis, considerable efforts have been made in developing model reduction techniques. The general idea is to project the large vector of the nodal variables onto a suitable much smaller subset of basis vectors. The discretized system of equation of motion in time are thus reduced in size, and can be integrated via usual time integration schemes. The main difficulty in this approach is to find a basis that keeps the accuracy of the solution while reducing the number of equations as much as possible. The modal reduction technique is a well-established procedure in linear dynamic analysis. The subspace employed is usually a set of vibration eigenmodes, the selection of which is made by comparing the frequency content of the structure with the frequency content of the forcing load. In absence of damping, this procedure decouples the equation of motion. The contribution of the neglected higher order modes can be recovered into the solution to improve the accuracy. Because of their high frequencies, their response to the forcing load can be thought as quasi-static and can be included as a correction to the displacements. This procedure has been originally proposed bt Rayleigh [62] and it is also known as mode acceleration. The modal reduction technique exhibits a useful side effect. In a FE discretization the high frequency response of the structure is, in fact, non physical and it is due to the fine mesh discretization. An explicit algorithm would benefit from a modal reduction technique by a considerable increase in the critical time step. When using the implicit time integrator, the size of the repeatedly solved system of linear equation is drastically reduced. 9
Chapter 1
The modal superposition technique has already been applied in nonlinear dynamic analysis by following the actual tangent spectrum and updating the modal basis at every time step [55]. The effectiveness of this approach is questionable due to the excessive effort in the solution of the tangent eigenproblem at a every time interval. Moreover, the projection of the old basis to the the new one introduces a time-dependent constraint that can affect the accuracy of the solution. A keystone in the research of modal reduction methods for nonlinear dynamics can be found in the works of Idelsohn and Cardona [37, 38]. They show how the tangent basis updating procedure introduces an increasing error when the old basis has to be projected on the new one. Their basic thought is that the modal subspace is prone to change in presence of structural nonlinearities. This basis can therefore be enriched with some modal derivatives that indicate the way the spectrum is changing. The modal derivatives can be found by differentiating the linear eigenvalue problem with respect to the modal amplitudes. They show through an example of a cantilever beam excited with a sinusoidal load how a limited number of eigenmodes together with some modal derivatives lead to an accurate solution (also in the high-frequency response) without the need to change the basis through the time integration. Some comments on the proper selection of the modal derivatives are given in [38]. It is suggested that the eigenmodes with the highest load participation factors would also develop large values in the associated derivatives. The same authors suggest in [37] the use of a particular sequence of orthogonal Ritz vectors as proposed by Wilson [71] in place of tangent vibration modes, again enriched with suitable modal derivatives. This proposed basis has the advantage that its generation does not involve a solution of large eigenvalue problems. It also has the advantage of accounting for the spatial distribution of the load at the basis generation. Following the work of Idelsohn and Cardona, the paper by Slaats [67] contributes in the techniques of calculating the derivatives of the eigenmodes. They present three different approaches: an exact analytical approach, which stems from the differentiation of the eigenvalue problem, a simplified analytical approach, where the mass contribution is neglected, and a numerical approach, where the modal derivatives are computed via a finite difference scheme after solving two different eigenvalue problems, for the reference and the perturbed configuration respectively. All the three techniques are shown to lead to comparable results. Together with the modal derivatives, these authors suggest the use of some static modes as an enrichment of the solution. This static correction, however, does not prove to have greater influence in improving the accuracy of the solution than the modal derivatives. The authors clearly show the large improvement when accounting for a limited nuumber of eigenmodes and some modal derivatives against a large number of eigenmodes via two-dimensional truss structures excited with a step load.
10
Introduction
Another efficient reduction technique was proposed by Leu and Tsou [50]. The basis idea behind this work is the extension of reduction methods for design reanalysis techniques to nonlinear dynamic analysis. The numerical solution of a nonlinear system of equation involves the repetitive solution of linear systems that change in times. Therefore, from the point of view of solving system of equation, a nonlinear dynamic problem is not different from a an optimal design problem, in that the system of equations changes for both type of problems. The authors refer to the procedure described by Kirsch [42] to form the basis vectors. These basis vectors, together with a Gram-Schimdt ortho-normalization procedure, lead to an uncoupled system of equation. The solution of this system leads to the modal amplitudes. The number of the required basis vectors to be computed is based on a low-computational cost accuracy estimator. This reduction technique is applied to three examples in which both the mass and the stiffness matrix of the model change during the simulation. The results show high accuracy. A detailed analysis of the computational cost of the method is also presented. An interesting modification of this reduction method, previously proposed by Leu and Huang [49], allows the solution of static problems beyond stability points. The method is tested with a tri-dimensional truss dome by comparing the results with the FE commercial program ABAQUS. The idea of using static modes is also proposed by McEvan [53]. In this work, the linear eigenvectors functions as a basis for a projection of a number of static nonlinear cases. The external loads applied in the static nonlinear analysis are chosen as a linear combination of mode shapes. The resulting set of displacements is projected on the eigenmodes subspace. The nonlinear force-displacement relation is then approximated with a polynomial function and a least-square technique is used to calculate the coefficients. A method to eliminate terms that bring little contribution to the overall response is also presented. This method has also the advantage of giving direct insight to the behavior of the structure by a direct inspection of the fitting coefficients. The proposed method is tested on a homogeneous two dimensional beam with harmonic excitation. The results are compared with a nonlinear analysis with ABAQUS. A different approach is followed in the work of Krysl [46]. The proposed procedure makes use of the proper orthogonal decomposition method (POD) to reduce the size of the system of equations. The dynamic response of the full system is sampled for different time instants. The sampled vectors, also known as empirical eigenvectors, form a basis which is then projected on a reduced subspace extracted by the eigenvectors of the covariance matrix of the sampled response. This procedure maximizes the accuracy of the solution. The authors give a physical interpretation of the empirical eigenvectors by associating the sampled vectors with point masses. From this perspective, the optimal projection basis is the one that minimizes the moment of inertia of the samples about the eigenvector. The methodology is applied to fairly 11
Chapter 1
large models which include both geometrical and material nonlinearities. The proposed procedure has the major drawback that a full analysis has to be completed before forming the basis. Moreover, the generated basis is no longer optimal when it is applied to a slightly different model. It is shown however, that the same reduced basis can capture the dynamic response when the changes in the system preserves the overall response of the structure.
1.3
Thesis layout
This thesis is organized as follows. Chapter 1 presents the background and motivation of the present research together with a literature survey for the selected areas of application. Particular attention is given to the finite element implementation issues. In chapter 2, the perturbation method for initial post-buckling analysis is presented. The analysis, also known as Koiter’s method, describes the stability characteristics through so-called post-buckling coefficients. These coefficients are given at a computational cost comparable to a linear buckling analysis and the solution of a linear problem. The perturbation method can be easily extended to account for the relevant case of interacting buckling modes when the critical loads are closely spaced. The effect of geometrical imperfections can be easily taken into account and results in a forcing term that can be added to (the already formed) reduced system for the perfect structure. The effects of different choices of kinematic models are briefly summarized. It is shown that the inaccuracy of the so-called technical models is somewhat mitigated in the case of redundantly constrained structures, while special attention needs to be paid to statically determinate cases. In general, the inaccuracy is caused by some negligible terms of the Green-Lagrange strain tensor. It is shown that neglecting these terms alleviates the problem without greatly affecting the correctness of the results. A simple finite element implementation of Koiter’s method that avoids interpolation locking is presented. Instead of relying on complicated ad hoc formulation, a simple averaging technique is here proposed and applied to a two-node 2D beam element and a triangular three-node 3D shell element. The presented examples show the good convergence properties of the proposed method together with the main advantages of the method as compared with full nonlinear analysis. Several examples are discussed to show the correctness and the accuracy of the proposed finite element 12
Introduction
implementation as well as the main features of the method. A similar theoretical setting can be established to study the effect of the amplitude of vibration on the eigenfrequency of a given structure. The method is described in chapter 3 and it is implemented into FE using a similar approach described for the Koiter’s analysis. The results are compared with analytical and semi-analytical solutions available in literature. Chapter 4 presents the extension of Koiter’s analysis for the study of buckling occurring for the application of a dynamic load. The static reduced equilibrium equation is completed with the inertial term associated to the buckling mode. The theory yields close form relations that link the static limit load to the dynamic buckling load for certain load histories. The possibility of the method to handle more complicated load cases is investigated through an example. A careful examination of the limits of the proposed theory leads to useful guidelines for the development of a more general reduction method for transient analysis. In particular, the dependency of the inertial term on the load level is approximated and highlighted. Chapter 5 deals with reduction techniques for nonlinear transient analysis. The dynamic equations of motion resulting from the FE discretization are projected on a suitable modal basis to reduce the number of degrees of freedom. In line with classical linear modal reduction, the basis of the retained vibration modes is enriched with second order fields generated via a perturbation approach. The interaction between the vibration modes is taken into account and it proves to be a fundamental contribution for more complicated cases. The generation of second order fields is based on a perturbation technique equivalent to the one presented in chapter 3. However, a simplification that reduces the computational cost has been made. The inertial term in the calculation of the second order fields can be neglected. For problems involving a dynamic load magnitude high enough to trigger strong nonlinearities such as the occurrence of dynamic buckling, the aforementioned reduction basis could not be sufficient for a correct approximation of the solution. Instead of updating the basis as the time integration proceeds, the reduction basis constituted by vibration modes and second order fields pertaining to the initial configuration can be enriched by the same quantities calculated at another static equilibrium configuration, for example at the buckling point. This strategy greatly improves the accuracy of the reduced system. A special class of problems in which the vibration modes change smoothly as the static load level increases can be addressed with a further sophistication of the method. Instead of considering the vibration modes at the two load levels as independent degrees of freedom, a single timedependent vibration modes basis can be formed via a linear interpolation of the vibration modes calculated at the two load levels directly through the dynamic load magnitude. The reduced FE equations have been rewritten to account for this time 13
Chapter 1
dependence of the basis. The conclusions and the accomplishments of the thesis are summarized in chapter 6.
14
Chapter 2
Koiter’s analysis for initial post-buckling 2.1
Introduction
Thin-walled structures constitute main structural components for many engineering fields. Their favorable strength-to-weight ratio and their slenderness often render buckling the critical design criterion. After buckling occurs, the structure can either still sustain the applied load or collapse. It the latter case, the presence of small initial geometrical imperfections can dramatically reduce the maximum sustainable load. The knowledge of the structural behavior after the onset of buckling is therefore of paramount importance, especially for safety reasons. Moreover, is it often likely that optimized configurations exhibit a clustering of the buckling loads. This situation can amplify the imperfection sensitivity and further reduce the maximum sustainable load. Linearized buckling analysis gives a first indication of the load-carrying capability of the structure at hand. When applied to finite elements, the buckling analysis leads to a linear algebraic eigenvalue problem. The accuracy of buckling analysis, however, does not yield any information regarding the stability characteristics at the buckling point. Path-following static analysis is a powerful method for the study of an arbitrary nonlinear behavior of a general structure. However, its computational cost is still considerable [60, 65]. Moreover, if the analyst is interested in the influence 15
Chapter 2
of different imperfection patterns on the load-carrying capability, the full analysis needs to be repeated form the beginning for each imperfection. A perturbation method constitutes a valid alternative. This analysis technique, also known as Koiter’s method [43], presents the main advantage of a compact description of the initial behavior of the structure after buckling has set. The stability characteristics of the structure are described by so-called post-buckling coefficients, resulting from the perturbation expansion. These coefficients are obtained at a computational cost comparable to a linear buckling analysis and the solution of a linear problem. The perturbation method can also be extended to account for the relevant case of interacting buckling modes when the critical loads are closely spaced. In this case, the procedure leads to a reduced nonlinear algebraic system of equations which unknown are the amplitudes of the retained buckling modes and the load level. The effect of geometrical imperfections can easily be taken into account and results in a forcing term that can be added to the already formed reduced system for the perfect structure. The kinematical model employed in the analysis can have a negative effect on the accuracy of the post-buckling coefficients [34, 51]. This problem is particularly relevant if the structure is not redundantly constrained [48]. In general, the problem is caused by some negligible terms of the Green-Lagrange strain tensor. It is shown that the omission of these terms alleviate the problem without greatly affecting the accuracy of the results. The FE implementation of Koiter’s analysis has been considered in the past by few researchers. A careless implementation of the discussed technique can generate important convergence problems for the post-buckling coefficients. The problem is caused by the mismatch of interpolation degree between in-plane and out-of-plane displacements within and element. This problem is also known as locking. Instead of relying on complicated ad hoc formulation, a simple averaging technique is here proposed and applied to a two-noded 2D beam element and a triangular three-noded 3D shell element. The presented examples show the good convergence properties of the proposed method together with the main advantages of the method as compared with full nonlinear analysis. This chapter is organized as follows. First, the Koiter’s analysis for a single mode case is presented using a functional notation. The extension to multimode analysis is then presented. The issues in using different kinematical models are then discussed. A simple finite element implementation of the method for a 2D beam element and a 3D triangular shell element is proposed. Several examples are shown to highlight the characteristic of the method and the accuracy of the proposed finite element implementation. 16
Koiter’s analysis for initial post-buckling
2.2
Single mode analysis
We use in this section the notation introduced by Budiansky et al. in [14]. This notation is extremely compact and could be applied to either continuous or discrete problems. The equivalent finite element notation is presented in section 2.5.3. We denote with u, ε , and σ generalized displacements, strains and the associated stress fields respectively. Each symbol can be thought as a vectorial entity, its specific dimension depending on the particular problem at hand. The strain-displacement relation is assumed quadratic, as 1 ε = L1 (u) + L2 (u) 2
(2.1)
where L1 and L2 are linear and quadratic operators respectively. The stress-strain relation is
σ = H(εε)
(2.2)
where H is a linear operator. The structure is loaded by a distributed load q and the static equilibrium is governed by the principle of virtual work σ · δεε = q · δu.
(2.3)
In equation 2.3 the ”dot” operation is a shorthand notation that, in term a · b, means the virtual work of stresses (or loads) a through the strains (or displacements) b, integrated over the whole structure. Equation 2.3 must hold for all possible admissible variations δu for the equilibrium of the structure, i.e. variations consistent with the kinematic boundary conditions. Here δεε is the first order strain variation generated by δu. A bilinear functional operator L11 is defined as
L2 (u + v) = L2 (u) + L11 (u, v) + L2 (v) then the variation δεε resulting from δu is written as
δεε = δe + L11 (u, δu)
(2.4) 17
Chapter 2
where e ≡ L1 (u). Note that L11 (u, v) = L11 (v, u) and L11 (u, u) = L2 (u). It is further assumed that the reciprocal relation H(εε1 ) · ε 2 = H(εε2 ) · ε 1
(2.5)
holds for all ε 1 and ε 2 . We consider in this study loads proportional to a parameter λ, i.e. q = λq0 . The load pattern q does not depend on the displacement u.
2.2.1
Linear pre-buckling equilibrium
The pre-buckling path of many practical applications can be approximated as linear. The displacement, stress and strain fields that the structure attains after the application of the static pre-load q = λq0 is considered linear, namely: ⎫ ⎧ ⎫ ⎧ ⎨ u ⎬ ⎨ u0 ⎬ ε0 ε =λ ⎭ ⎩ ⎭ ⎩ σ0 σ
(2.6)
L11 (u0 , v) = 0
(2.7)
We further assume here that
for all v. It will be clarified later that this hypothesis leads to the omission of the prebuckling rotations in evaluating the buckling load and the post-buckling coefficients. We thus have ε 0 = L1 (u0 ) = e0 (2.8) σ 0 = H(εε0 ). The linear equilibrium is therefore governed by σ 0 · δe = q0 · δu. 18
(2.9)
Koiter’s analysis for initial post-buckling
2.2.2
Buckling problem
To explore the possibility of bifurcation at a certain load multiplier λC , the fundamental linear solution 2.6 is perturbed around the critical point ⎧ ⎫ ⎧ ⎫ ⎧ ⎫ ⎨ u0 ⎬ ⎨ u1 ⎬ ⎨ u ⎬ ε ε0 ε1 +ξ = λC ⎩ ⎭ ⎩ ⎭ ⎩ ⎭ σ σ0 σ1
(2.10)
in which
ε1 σ1
= e1 + ξλC L11 (u0 , u1 ) = e1 = H(εε1 ) = H(e1 )
(2.11)
The variational strain becomes
δεε = δe + ξL11 (u1 , δu)
(2.12)
By substituting 2.11 and 2.12 in the equilibrium equation 2.3 and taking into account the linear solution 2.6 the equation governing buckling is obtained by letting ξ −→ 0
λC σ 0 · L11 (u1 , δu) + σ 1 · δe = 0
(2.13)
The solution of the problem 2.13 yields the critical load λC and the buckling mode u1 .
2.2.3
Initial post-buckling path
A secondary equilibrium branch intersect the fundamental path in the critical point. We are now interested in a compact representation of the initial post-buckling behavior. The buckled solution is expanded as 19
Chapter 2
⎧ ⎫ ⎧ ⎫ ⎧ ⎫ ⎧ ⎫ ⎧ ⎫ ⎨ u ⎬ ⎨ u0 ⎬ ⎨ u1 ⎬ ⎨ u2 ⎬ ⎨ u3 ⎬ ε ε0 ε1 ε2 ε3 =λ +ξ + ξ2 + ξ3 + ··· ⎩ ⎭ ⎩ ⎭ ⎩ ⎭ ⎩ ⎭ ⎩ ⎭ σ σ0 σ1 σ2 σ3
(2.14)
where u1 has been normalized in some fashion and ξ is a scalar parameter. The displacement fields u2 , u3 , . . . are orthogonalized with respect to the buckling mode u1 in the following way σ 0 · L11 (u1 , un ) = 0, n = 2, 3, . . .
(2.15)
The strains ε 2 , ε 3 , . . . are obtained by substituting the displacement expansion 2.14 in the strain function 2.1 and collecting terms of the same order in ξ
ε1 ε2 ε3
= e1 1 = e2 + L2 (u1 ) 2 = e3 + L11 (u1 , u2 )
(2.16)
The following relations are useful for the subsequent derivation
σ 2 · ε1 σ 3 · ε1
1 = σ 1 · ε 2 = σ 1 · L2 (u1 ) 2 = σ 1 · ε 2 = σ 1 · L11 (u1 , u2 )
(2.17)
The equilibrium equation in a slightly buckled configuration is obtained by substituting 2.14 and 2.16 in the equilibrium equation 2.3. By posing δu = u1 and after simplifying using the buckling problem 2.13 one obtains λ = 1 + aS ξ + b S ξ 2 + · · · λC where 20
(2.18)
Koiter’s analysis for initial post-buckling
aS
=
bS
=
3 σ 1 · L2 (u1 ) 2 σ1 · ε 1 σ 1 · L11 (u1 , u2 ) + σ2 · L2 (u1 ) 2σ σ1 · ε 1
(2.19)
The second order field u2 necessary for the calculation of the second order coefficient bS is obtained by the solution of the linear problem σ 2 · δe + λσ 0 · L11 (u2 , δu) + σ 1 · L11 (u1 , δu) = 0
(2.20)
The problem 2.20 is obtained by equating the terms in ξ 2 in the expanded equilibrium equation to zero. Three relevant cases can be outlined:
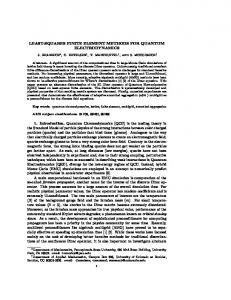
1. aS = 0, bS > 0 2. aS = 0, bS < 0 3. aS �= 0 λ
λ λ
λ λ
C
λ
C
C
λS
λS
ξ
(a) aS �= 0
ξ
(b) bS > 0
λS
ξ
(c) bS < 0
Figure 2.1: Koiter’s analysis: load-deflection curves. (a) non-symmetric structure (b) symmetric stable (c) symmetric unstable When aS = 0, the structure is said to be symmetric, i.e. the direction at which the buckling occurs does not affect the postbuckling response. If bS > 0 the structure is able to sustain the applied load after buckling as occurred. This is considered to be a safe situation. If bS < 0, the structural response is characterized by a limit 21
Chapter 2
load which is a function of the actual imperfection. The actual limit load could be remarkably lower than the theoretical buckling load of the perfect structure. The bS coefficient is in this case a first indication of the imperfection sensitivity of the structure at hand. In case aS �= 0, the structure is non-symmetric. In this case, the ability of the structure to sustain or not a further increment in the applied load depends on the direction at which buckling occurs. The actual imperfection pattern triggers either one behavior or the other. The structure for which aS �= 0 is also referred as quadratic. Likewise, the case of aS = 0, bS �= 0 is referred as cubic.
2.2.4
The slightly imperfect structure
The described theory yields an asymptotic description of the secondary path branching from a critical point. This behavior physically pertains to perfect structures, i.e. structures for which the geometry and the loading condition do not deviate from the nominal configuration. The presence of a small geometric or load deviation (imperfection) usually shifts the response of the structure from a bifurcation type to a smooth nonlinear path. If the imperfection magnitude is small, all the information gathered by the asymptotic analysis of the perfect case still conserve the essential structural behavior and can be completed with the contribution of the imperfection ¯ , the in a later stage. In presence of a stress-free initial geometrical imperfection u kinematic function 2.1 modifies as follows
1 1 1 ¯ )+ L2 (u+u ¯ )]−[L1 (¯ ¯ ) (2.21) u)+ L2 (¯ u)] = L1 (u)+ L2 (u)+L11 (u, u ε = [L1 (u+u 2 2 2 ¯ is subtracted to the in which the strain associated to the imperfection pattern u total strain to satisfy the stress-free condition. The variational strain becomes u, δu) δεε = δe + L11 (u, δu) + L11 (¯
(2.22)
¯ of the applied load can be treated by posing the load term in the form A deviation q
¯) q = λ(q0 + q
(2.23)
The substitution of 2.22 and 2.23 in the equilibrium equation 2.3 generate extra terms in the final single mode postbuckling equation 2.18, which becomes 22
Koiter’s analysis for initial post-buckling
� � u, u1 ) λ¯ σ · L11 (¯ q · u1 λ − ξ + aS ξ 2 + b S ξ 3 = − 1− λC σ1 · ε 1 σ1 · ε 1
(2.24)
The term on the right-hand side of 2.24 can be thought as a loading term. If one assumes the geometric imperfection to be affine to the buckling mode shape, i.e.
¯ 1 ¯ = ξu u
(2.25)
by retaining only the lower order term in ξ the imperfection term assumes the simple form
−
¯σ · L2 (u1 ) ¯σ · L2 (u1 ) λ ¯ u, u1 ) ξσ −ξσ σ · L11 (¯ = =− = ξ σ1 · ε 1 σ1 · ε 1 −λC σ0 · L2 (u1 ) λC
(2.26)
where we made use of the buckling problem 2.13 and the fundamental solution 2.6.
2.2.5
Effect of pre-buckling rotations
In the previous section, we made the hypothesis (2.7) before proceeding into the derivation of the buckling problem. The L11 (u, v) operator essentially involves multiplications of the rotations associated to the displacement fields u and v. The requirement (2.7) therefore essentially represents the omission of the contribution of the pre-buckling rotations in the calculation of the critical point. In other words, the redirection of stresses due to the pre-buckling displacements is neglected. This approximation is often accurate for structures characterized by a pre-buckling state with negligible out-of-plane deformations. In the case if this hypothesis is relaxed, Cohen [23] and Fitch [31] and later Arbocz and Hol [9] derived the modification to the buckling problem (2.13) and the modified post-buckling coefficients (2.19) as follows:
σ 0 · L11 (u1 , δu) + σ 1 · L11 (u0 , δu)] + σ 1 · δe = 0 λC [σ
(2.27)
and the post-buckling coefficients a ˜S and ˜bS for the single-mode case read as: 23
Chapter 2
a ˜S =
˜bS
=
σ 1 · L2 (u1 ) 3σ σ 1 · L11 (u0 , u1 ) + σ 0 · L2 (u1 )] 2λc [2σ
σ 1 · L11 (u1 , u2 ) + +σ σ 2 · L2 (u1 ) + {2σ σ 1 · L11 (u2 , u0 ) + σ 2 · L11 (u0 , u1 ) + as λC [σ σ 1 · L11 (u0 , u1 ) + σ 0 · L2 (u1 )] σ 0 · L11 (u1 , u2 )]}/λc [2σ
(2.28)
(2.29)
For the case of symmetric structures (˜ aS = 0), the ˜bS coefficient is simplified as
σ 2 · L2 (u1 ) σ 1 · L11 (u1 , u2 ) + +σ ˜bS = 2σ σ 1 · L11 (u0 , u1 ) + σ 0 · L2 (u1 )] λc [2σ
2.2.6
(2.30)
Sligthly nonlinear pre-buckling state
The asymptotic single equation 2.24 is based on a perfectly linear pre-buckling solution. While this hypothesis is often met, practical examples often exhibits a slightly nonlinear fundamental path before incurring into instability. The right hand side of equation 2.24 can in this case be augmented by a so-called implicit imperfection term µ.
ξµ = −ξλ2
σ 0 · L11 (u0 , u1 ) σ1 · ε 1
(2.31)
The governing equation for the case of a slightly nonlinear pre-buckling path is therefore � � λ ¯ λ ξ + ξµ 1− ξ + aS ξ 2 + b S ξ 3 = λC λC 24
(2.32)
Koiter’s analysis for initial post-buckling
2.3
Multimode postbuckling analysis
So far we have assumed that the considered structure is characterized by a single buckling mode. This is to say that the buckling loads extracted from the eigenvalue problem 2.13 are well separated so as to justify a single mode approach. Many relevant cases exhibits clustering of the buckling loads. This behavior is often observed in optimized structural components. In these cases, a single mode approach is no longer sufficient to capture the complex mode interaction of the clustered modes. An asymptotic analysis, however, is still a valuable analysis tool as compared to a complete nonlinear analysis. An outline of the asymptotic analysis in the case of multiple modes is presented in the following section. A complete derivation can be found in [24]. The pre-buckling path is determined as presented in section 2.2.1. Instead of extracting only the first buckling mode by solving the eigenvalue problem 2.13, multiple modes are calculated. The analyst retains M significant modes ui , i = 1, 2, . . . , M , the choice being based on an inspection of the relative magnitude of the buckling loads λi . The buckling modes ui are mutually orthogonal in the following sense
σ 0 · L11 (uI , uJ ) = 0, (I, J) = [1, M ], I �= J
(2.33)
where M are all the relevant buckling modes that are believed to be important in the structural response. If the buckling loads are well separated, the first buckling mode will be sufficient. If, however, the buckling loads are clustered, interaction phenomena can become important. It is therefore worthwhile to include more buckling modes in the reduced basis. The displacement field 2.10 is then expanded in the following fashion:
u =
λu0 + ξi ui + ξi ξj uij + · · ·
(2.34)
where uij can be considered as second order displacement fields that take into account the interaction of buckling modes ui and uj . These correction fields are the solution of the variational problem
1 λσ0 · L11 (uJK , δu) + σJK · δe = − [σJ · L11 (uK , δu) + σK · L11 (uJ , δu)] 2
(2.35) 25
Chapter 2
In order to make the expansion unique, the second order correction fields uij are required to be orthogonal to all buckling modes
σ0 · L11 (uJ , uKL ) = 0, (J, K, L) = [1, M ]
(2.36)
The strains and the stresses 2.10 are then expanded accordingly
ε = σ =
λεε0 + ξiε i + ξi ξj ε ij + · · · λσ0 + ξi σi + ξi ξj σij + · · ·
(2.37) (2.38)
where the second order strains and stresses are defined as follows 1 ε ij = L1 (uij ) + L11 (ui , uj ) 2
(2.39)
σ ij = H(εεij )
(2.40)
As it can be noticed from equation (2.35) the second order correction fields uij depend on λ. A typical choice for this parameter is the minimum buckling load λ1 or an average of the retained buckling loads. By substituting the displacement expansion (2.34) into the equilibrium equation (2.3), after some manipulations the following system of reduced M nonlinear algebraic equilibrium equation is found � � λ ¯ λ ξI + ξi ξj aSijI + ξi ξj ξk bSijkI = ξI 1 − λI λI
(2.41)
¯ is reproduced by a linear combination of the where a general imperfection pattern u relevant M buckling modes included in the reduction basis, namely ¯ = ξ¯i ui , i = 1, 2, . . . , M u
(2.42)
The system of equations (3.35) can be solved with a standard path-following technique. The formulas for the postbuckling coefficients aSijI and bSijkI are written 26
Koiter’s analysis for initial post-buckling
below. The first order coefficients aSijI depend only on the pre-buckling solution u0 and the buckling modes ui . The calculation of the second order coefficients bSijkI requires also the correction fields uij .
aSijI =
bSijkI
σ i · L11 (uj , uI ) σ I · L11 (ui , uj ) + 2σ σ I · �I
σ Ii · L11 (uj , uk ) + = [σ σ ij · L11 (uk , uI ) + σ I · L11 (ui , ujk ) + σ i · L11 (uI , ujk ) + σ i · L11 (uj , ukI )]/σ σI · �I 2σ
2.4
(2.43)
(2.44)
Kinematic issues
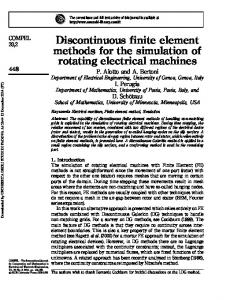
The actual value of the post-buckling coefficients strongly depends on the kinematical model adopted. It will be shown in this paragraph how the so-called technical kinematical assumption can fail to yield correct results in some cases. Let us first refer to a two-dimensional framework via an example. Let us consider a straight column hinged on one side and free to move axially at the other tip. The column is loaded axially at the movable extremity with a concentrated force. This problem is also known as the Euler column and has been thoroughly discussed by Pignataro [51]. Only the final results of his work are here summarized. A sketch of the problem is shown in figure 2.2.
Figure 2.2: The Euler column problem The buckling load λC is found to be 27
Chapter 2
λC =
π 2 EI F L2
(2.45)
By using an exact kinematical model, the correct post-buckling coefficient bS is found to be
bS =
1 λC 8
(2.46)
if the buckling mode is normalized to have a unit rotation at the tips. The postbuckling slope aS is zero because of the symmetry of the structure and the applied load (see [8] and [51] for details). Let us consider two different quadratric kinematical models. The first one is based on the Green-Lagrange strain tensor. The axial strain � and the curvature χ are expressed as a function of the axial and transversal displacement u and w as ⎧ � 1
⎪ ⎨ � = u,x + u,2x +w,2x 2 ⎪ ⎩ χ = w,xx
(2.47)
The linear and quadratic operators L1 and L2 introduced in section 2.2 are easily recognizable. This model correctly reproduces rigid body rotations without introducing spurious strains. The analytical solution of the Koiter’s analysis using this kinematical model leads to the following result for the post-buckling curvature coefficient
3 bS = − λC 8
(2.48)
This results is clearly incorrect since it even yields a negative post-buckling curvature for a structure that is actually stable. An extensively used kinematical model is the so-called technical beam theory, or Von-Karman kinematical model. It consist of a simplification of 2.47 by the neglection of the small term u,2x with respect to u,x in the definition of the axial strain �. The axial strain and the curvature are defined as 28
Koiter’s analysis for initial post-buckling
⎧ 1 ⎪ ⎨ � = u,x + w,2x 2 ⎪ ⎩ χ = w,xx
(2.49)
In this case we obtain for the post-buckling curvature
bS = 0
(2.50)
This result is still not correct but better than the previous case 2.48 that predicts an unstable structure. It is worth mentioning that 2.49 introduces spurious strains in case of rigid body rotations. This disagreement with the exact solution of the results obtained with quadratic models is due to the fact that the calculation of the postbuckling curvature bS requires the calculation of 4th order terms. The kinematical models 2.47 and 2.49 are in fact only 3rd order accurate. The limited discussion of the Euler column example shows that exact, or at least 4th order accurate kinematical models are needed for a correct calculation of the post-buckling curvature bS . Exact kinematical models have been developed, see for example [8], and successfully applied to Koiter analysis of planar beam structures [30, 34]. However, the development of such models for plates is extremely cumbersome. In this case, it is better to deal with simplified kinematical models provided that they are accurate enough for the application at hand. It has been shown by Lanzo and Garcea [48] that, if the post-buckling deformation implies a redistribution of the stresses, the problems concerning the utilization of 3rd order accurate kinematical models are greatly alleviated. This is often the case for plate and shell structures where the redundant boundary conditions indeed cause a redistribution of the stress pattern after buckling has occurred. The results for the Euler column example suggest the use of the Von-Karman model for plates ⎧ 1 ⎪ ⎪ ⎧ �x = u,x + w,2x ⎪ ⎪ 2 χxx = w,xx ⎪ ⎪ ⎪ ⎪ ⎪ ⎪ ⎪ ⎪ ⎨ ⎨ 1 χyy = w,yy , �y = v,y + w,2y ⎪ ⎪ 2 ⎪ ⎪ ⎪ ⎪ ⎪ ⎪ ⎪ ⎩ ⎪ χxy = w,xy ⎪ ⎪ ⎩ �xy = 1 (u,y +v,x ) + 1 (w,x w,y ) 2 2
(2.51)
29
Chapter 2
in which the terms u,2x , v,2y are assumed to be negligible. This model completely neglects the nonlinear in-plane rotation terms. These terms might be negligible for flat plate situations but they indeed play a major role in structures consisting of assembly of flat plates or curved shells. A way to derive a suitable model that accounts for nonlinear in-plane effects is to consider the full Green-Lagrange strain tensor for plates
⎧ � 1
⎪ ⎪ �x = u,x + u,2x +v,2x +w,2x ⎪ ⎪ 2 ⎪ ⎪ ⎪ ⎪ ⎨ � 1
�y = v,y + u,2y +v,2y +w,2y ⎪ 2 ⎪ ⎪ ⎪ ⎪ ⎪ ⎪ ⎪ ⎩ �xy = 1 (u,y +v,x ) + 1 (u,x u,y +v,x v,y +w,x w,y ) 2 2
(2.52)
the curvatures being already defined in 2.52. The presence of the terms u,2x , v,2y and u,x u,y +v,x v,y , however, yields to the same accuracy issues discussed for the beam example. As previously stated, a simple way to alleviate the shortcoming is to neglect the aforementioned terms and refer to the simplified Green-Lagrange strain tensor
⎧ � 1 2 ⎪ 2 ⎪ � v, = u, + +w, x x ⎪ x x ⎪ 2 ⎪ ⎪ ⎪ ⎪ ⎨ � 1
�y = v,y + u,2y +w,2y ⎪ 2 ⎪ ⎪ ⎪ ⎪ ⎪ ⎪ ⎪ ⎩ �xy = 1 (u,y +v,x ) + 1 (w,x w,y ) 2 2
(2.53)
This model provide rather accurate results without producing erroneous results in the case of iso-static problems for which the stress redistribution after buckling does not occur. The simplified Green-Lagrange strain models (2.49) and (2.53) will be adopted in all the following numerical examples. 30
Koiter’s analysis for initial post-buckling
2.5
Finite element implementation
The classical notation by Budiansky [14] presented in section 2.2 and 2.3 is in this section translated into finite element matrix notation. The following table summarizes the relationships between the two notations. We indicate arbitrary generalized displacement vector with the symbol q and p. These vectors have to be intended as element quantities unless differently specified. Displacement field: u, v ⇔ q, p Linear operator: L1 (u) ⇔ Bq Quadratic operator: L11 (u, v) ⇔ C(q)p Applied external load: q ⇔ F Table 2.1: Relation between functional notation and finite element notation
The kinematical relation (2.1) is now written as 1 ε = Bq + C(q)q 2
(2.54)
and the stress-strain function can be written as
σ = Am ε
(2.55)
Where Am is the material tensor. The specific definition of the matrix B and C is reported is the following sections.
2.5.1
Element formulation
The implementation of Koiter’s analysis into a finite element framework requires special care. The determination of the post-buckling coefficient presents convergence 31
Chapter 2
difficulties when compatible formulations are employed. This is essentially due to the fact that the in-plane displacement components are interpolated to a lower degree than the out-of-plane components. This causes a numerical problem usually referred as locking that results in an extremely slow convergence of the post-buckling curvature bS . This problem has been addressed in the past by other researchers. Olesen and Byskov [40] proposed an a posteriori correction to the post-buckling strains that preserve the finite element formulation employed. Poulsen and Damkilde [57] presented a correction of the second order strain fields at the element level by adding additional nodes to the elements. In both these two works the results are presented for two-dimensional beam examples modelled with a compatible two-noded planar beam element. The works by Lanzo [47, 48] concern the application of finite elements on the Koiter’s analysis of plate problems [47] and structures made of assembly of flat plates [48]. Lanzo uses the so-called High-Continuity (HC) formulation proposed in [10]. This approach ensures a C 1 continuity with a low number of interpolation parameters but can only be applied to flat rectangular elements. We present here a simple approach that leads to accurate numerical results with reasonable mesh sizes. The main idea is to rely upon already existing compatible finite elements and alleviate the locking problem by enforcing constant quantities within the element. We consider here a two-noded 6 degrees of freedom planar beam element and a triangular three-noded 18 degrees of freedom flat shell element. Shear effects are neglected and only isotropic linear constitutive models are considered for the material. The extension to shear flexibility and orthotropic material does not affect the general procedure. The kinematical models considered are the ones described in section 2.4 as simplified lagrangian strain tensor. For beams and shells they write, respectively:
⎧ � 1 L
1 2 ⎪ ⎪ ⎨ � = L 0 u,x + 2 w,x dx ⎪ ⎪ ⎩ χ = 1 L w, dx xx L 0
and 32
(2.56)
Koiter’s analysis for initial post-buckling
⎧
�� 1 ⎪ ⎪ �x = u,x + 12 v,2x +w,2x dA χxx = ⎪ A ⎪ A ⎪ ⎪ ⎪ ⎪ ⎨
�� 1 , χyy = �y = v,y + 12 u,2y +w,2y dA A ⎪ A ⎪ ⎪ ⎪ ⎪ ⎪ ⎪ 1 � ⎪ ⎩ �xy = 1 (u,y +y,x ) + 12 (w,x w,y ) dA χxy = 2 A A
1 w,xx dA A A 1 w,yy dA A A
(2.57)
1 w,xy dA A A
It can be noticed that all the quantities are averaged over the element length L (for the beam) and the element area A, for the shell element.
Planar beam element We describe here the isoparametric formulation of the two-noded planar beam element. The beam element is represented in figure 2.3 .
Figure 2.3: Two-node beam element The Von Karman kinematic model (2.49) is employed, and the strain quantities are averaged through the element domain as in (2.56). We use the compact notation
ε = [� χ]T
(2.58) 33
Chapter 2
to denote the strain vector ε that contains the axial strain � and the curvature χ. The element nodal displacement vector is written as
q
T
= [u1 w1 θ1 u2 w2 θ2 ]
(2.59)
An isoparametric coordinate system is used. The link between the isoparametric and the cartesian coordinate system is simply
ξ=
2 x−1 L
(2.60)
so that the derivatives in the isoparametric and cartesian coordinate systems are related as
d 2 d = dξ L dx
(2.61)
The in-plane and out-of-plane displacement components u and w are interpolated as �
u(ξ) w(ξ)
�
� =
Nu1 0
0 Nw1
0 Nθ1
Nu2 0
�
�
0 Nw2
0 Nθ2
� q
(2.62)
in a compact form, we can write �
u(ξ) w(ξ)
� =
where the shape functions are defined as 34
Nu Nw
q
(2.63)
Koiter’s analysis for initial post-buckling
Nu1
=
Nu2
=
Nw1
=
Nθ1
=
Nw2
=
Nθ2
=
1 (1 − ξ) 2 1 (1 + ξ) 2 1 (1 − ξ)2 (2 + ξ) 4 1 L(1 − ξ)2 (1 + ξ) 8 1 (1 + ξ)2 (2 − ξ) 4 1 − L(1 + ξ)2 (1 − ξ) 8
(2.64) (2.65) (2.66) (2.67) (2.68) (2.69)
According to (2.56), the B and C matrix are obtained by averaging the strain functions and are thus constant. The linear matrix B of the general form (2.54) is calculated as ⎡ ⎢ B=⎢ ⎣
⎤
2 1 Nu,ξ dξ L −1 4 1 Nw,ξξ dξ L2 −1
⎥ ⎥ ⎦
(2.70)
which leads to ⎡ B=
⎤
1 ⎢ −1 0 0 1 ⎣ L 0 0 −1 0
0 0 ⎥ ⎦ 0 1
(2.71)
The quadratic matrix C(q) can be conveniently written as ⎤ T K q xx ⎥ ⎢ C(q) = ⎣ ⎦ 01×6 ⎡
(2.72)
where Kxx is obtained as 35
Chapter 2
Kxx
4 = 2 L
�
1
−1
NTw,ξ Nw,ξ dξ
(2.73)
which yields ⎡
Kxx
⎢ ⎢ ⎢ ⎢ ⎢ ⎢ ⎢ ⎢ ⎢ ⎢ ⎢ =⎢ ⎢ ⎢ ⎢ ⎢ ⎢ ⎢ ⎢ ⎢ ⎢ ⎣
0
0
0
0
6 5L2
1 10L
0
1 10L
2 15
0 −
1 10L
0
0
0
0
0
1 10L
0
6 5L2
0 0
−
6 5L2
1 10L
−
−
1 30
0
0
0
6 − 2 5L
0 −
1 10L
0
⎤
⎥ ⎥ 1 ⎥ ⎥ 10L ⎥ ⎥ ⎥ 1 ⎥ ⎥ − 30 ⎥ ⎥ ⎥ ⎥ 0 ⎥ ⎥ ⎥ 1 ⎥ ⎥ − ⎥ 10L ⎥ ⎥ ⎦ 2 15
(2.74)
The material matrix Am that relates stresses and strains is written, for an isotropic beam, as simply � Am =
EA 0 0 EI
� (2.75)
where E is the elastic modulus of the material, A is the cross-section area and I is the bending moment of inertia.
Triangular flat shell element We describe in this section a triangular three-noded flat shell element with six degrees of freedom per node, three displacement components and three rotations. An isotropic material model is considered. The element can be thought of as the combination of a membrane element and a bending element. The degrees of freedom of the two contributions are summarized in figure 2.4. 36
Koiter’s analysis for initial post-buckling
Figure 2.4: The 3-node triangle flat shell element: membrane (left) and bending (right) degrees of freedom. The drilling rotation is directly introduced in the formulation.
The material stiffness matrix for the membrane and bending element have been formulated by Allman in [3] and [1] respectively. We report here the calculation of the entities necessary for the perturbation analysis. The element degrees of freedom are organized in a vector form as follows
q=
q2
q1
q3
�T
(2.76)
where
qi =
ui
vi
wi
θx i
θy i
θz i
�
(2.77)
with i = 1, 2, 3. The following geometric quantities associated to the local vertex coordinates (x1 , y1 ), (x2 , y2 ), (x3 , y3 ) are defined:
xij yij
= xi − xj = yi − yj
i, j = 1, 2, 3
(2.78)
the element area is denoted by A and it is obtained as 37
Chapter 2
A=
y21 x13 − x21 y13 2
(2.79)
A triangular coordinate system (ζ1 , ζ2 , ζ3 ) is used, where the following relation holds:
ζ1 + ζ2 + ζ3 = 1 The isoparametric coordinates can be linked to the cartesian coordinates through the following transformation ⎡
⎤ ⎡ 1 1 ⎣ x ⎦ = ⎣ x1 y1 y
1 x2 y2
⎤⎡ ⎤ ζ1 1 x3 ⎦ ⎣ ζ2 ⎦ y3 ζ3
(2.80)
From (2.80) we obtain the link between the partial derivatives in the cartesian coordinates and those in the isoparametric coordinates as ⎤ ⎡ ∂ ⎢ ∂x ⎥ ⎢ Tx ⎥ ⎢ ⎢ ⎥=⎢ ⎢ ⎥ ⎢ ⎢ ⎣ ∂ ⎦ ⎣ Ty ∂y ⎡
⎤⎡
⎤ ∂ ⎥ ⎢ ∂ζ ⎥ 1 ⎥ ⎥⎢ ⎥⎢ ⎥ ⎥⎢ ⎥ ⎦⎣ ∂ ⎦ ∂ζ2
(2.81)
where
Tx =
1 y23 2A
y31
y12
Ty =
1 x32 2A
x13
x21
�
�
(2.82)
(2.83)
Only the in-plane components of the strain model (2.53) contain quadratic contributions. We express these components as
ε= 38
�x
�y
�xy
�T
(2.84)
Koiter’s analysis for initial post-buckling
where ε contains the in-plane strain components only. The B matrix is formed according to the formulation by Felippa [29]. The final result is reported here:
B = [B1 B2 B3 ]
(2.85)
where
⎤
⎡ 0
y23
⎢ ⎢ B1 = ⎢ 0 ⎢ ⎣ y (y − y ) 23 13 21 6
x32 x32 (x31 − x12 ) 6
0
x32
⎥ ⎥ ⎥ (2.86) y23 ⎥ (x31 y13 − x12 y21 ) ⎦ 3
� 3×3
⎤
⎡ y31
0
⎢ ⎢ B2 = ⎢ 0 ⎢ ⎣ y (y − y ) 31 21 32 6
x13 x13 (x12 − x23 ) 6
0
x13
⎥ ⎥ ⎥ (2.87) y31 ⎥ (x12 y21 − x23 y32 ) ⎦ 3
� 3×3
⎡
⎤
y12 ⎢ ⎢ B3 = ⎢ 0 ⎢ ⎣ y (y − y ) 12 32 13 6
0 x21 x21 (x23 − x31 ) 6
0
x21
⎥ ⎥ ⎥ (2.88) y12 ⎥ (x23 y32 − x31 y13 ) ⎦ 3
� 3×3
In order to form the C matrix, the displacement components u, v and w are approximated with simple linear shape functions, as:
⎡
⎤ ⎡ ζ1 u ⎣ v ⎦=⎣ 0 w 0
0 ζ1 0
0 0 ζ1
0
� 3×3
ζ2 0 0
0 ζ2 0
0 0 ζ2
0
� 3×3
ζ3 0 0
0 ζ3 0
0 0 ζ3
0
⎤
� 3×3
⎦
(2.89) 39
Chapter 2
This approach yields constant entities. The C(q) is written as ⎡
⎤ qT Kxx C = ⎣ qT Kyy ⎦ qT Kxy
(2.90)
where constant matrices Kxx , Kyy and Kxy are found as Kxx = BTw TTx Tx Bw + BTv TTx Tx Bv
(2.91)
Kyy = BTw TTx Tx Bw + BTu TTx Tx Bu
(2.92)
� � Kxy = BTw TTx Ty + TTy Tx Bu
(2.93)
The matrices Bu , Bv and Bw are expansion matrices to assign the derivatives to the corresponding degrees of freedom. They are defined as ⎡
0 0 Bw = ⎣ 0 0 0 0 ⎡
1 Bu = ⎣ 0 0 ⎡
0 Bv = ⎣ 0 0
0 0 0 0 0 1
0 0 0 0 0 0
⎤ 0 0 ⎦ 0
1 0 0 0 0 0
0 0 0 0 0 0
0 0 0 0 0 0
0 0 1 0 0 0
0 0 0 0 0 0
0 0 0
0 0 0
0 0 0 0 0 0
0 0 0 0 0 0
0 0 1 0 0 0
0 0 0 0 0 0
0 0 0 0 0 1
0 0 0 0 0 0
0 0 0 0 0 0
0 0 0
⎤ 0 0 ⎦ 0
1 0 0
0 0 0 0 0 0
0 0 0 0 0 0
0 0 0 1 0 0
0 0 0 0 0 0
0 0 0 0 0 0
0 0 0 0 1 0
0 0 0 0 0 0
0 0 0
⎤ 0 0 ⎦ 0
(2.94)
(2.95)
(2.96)
The isotropic material matrix Am for the in-plane stress-strain relation is written as 40
Koiter’s analysis for initial post-buckling
⎡ Am
2.5.2
Eh = 1 − ν2
⎢ 1 ⎢ ⎢ ⎢ ν ⎢ ⎣ 0
⎤ ν
0
1
0
0
1−ν 2
⎥ ⎥ ⎥ ⎥ ⎥ ⎦
(2.97)
Finite element inplementation of Koiter’s analysis
It is convenient to define other quantities to make the notation more compact. We define the linear stresses n0 associated to the pre-buckling displacement q0 : n0 = Am Bq0
(2.98)
the linear stresses ni associated to the displacement mode qi : ni = Am Bqi
(2.99)
and the quadratic stresses nij associated to the second order fields qij : 1 nij = Am Bqij + Am Ci qj 2
(2.100)
All the quantities presented so far are associated to the element level. In the next section the overall Koiter’s analysis translated into finite element formulation is presented. The global entities necessary for the analysis are obtained by summation of the contribution of all the elements. The element quantities are denoted by a superscript e.
2.5.3
Finite element general procedure
Once translated to a finite element framework, the Koiter’s analysis involves a limited number of steps. Namely, it consists of a linear problem for the pre-buckling solution, an algebraic eigenvalue problem for the buckling modes and a series of 41
Chapter 2
linear problems for the second order fields. The calculation of the post-buckling coefficients involves only integration at the element level. We distinguish here the element quantities with a superscript e.
Pre-buckling state The equivalent FE element form of the linear problem (2.9) is the well known system of equation
K0 q0 = F
(2.101)
where K0 is the material stiffness matrix, F is the external force vector and q0 is the linear static solution.
Buckling state The M buckling modes qi and the buckling loads λi , with i = 1, 2, . . . , M , are obtained by solving the eigenvalue problem [K0 − λi KG ] qi = 0
(2.102)
The geometric stiffness matrix KG is formed as follows �
Le ne0 Kexx
(2.103)
� Ae ne01 Kexx + ne02 Keyy + ne03 Kexy
(2.104)
KG =
e
for the beam element and
KG =
� e
for the shell element, where n01 , n02 , n03 are the three components of the internal force vector n0 . The element summation is carried out in the standard way. The 42
Koiter’s analysis for initial post-buckling
element quantities are first rotated into the global coordinate system, then scattered to the pertaining global degrees of freedom. This procedure is performed for each element and the results are summed. The details are here omitted and can be found, for example, in [11].
Calculation of post-buckling slopes The calculation of the post-buckling slope coefficients aSijk involves the calculation of scalar quantities at the element level that are functions of the buckling modes only. The contribution of the elements is summed over the whole structure: � aSijk =
T
e
T
Ae nek Cei qej + 2Ae nei Cej qek 2qTk K0 qk
(2.105)
The notation employed is general and can be applied to both the beam and the shell element. The element area Ae has to be substituted by the length Le in the case of the two-dimensional beam element.
Initial post-buckling state The second order displacement fields qij are obtained by the solution of the linear problems [K0 − λKG ] qij = g(qi , qj )
(2.106)
together with the orthogonality condition (2.36): qTk KG qij = 0 ∀i, j, k
(2.107)
The right-hand-sides of the problem (2.106) are obtained as:
g(qi , qj ) = −
�T T T T 1 � e � eT e A ni Cj + nej Cei + qej Cei Aem BeL 2 e
(2.108)
43
Chapter 2
Calculations of post-buckling curvatures As for the aSijk coefficients, the calculation of the post-buckling curvatures bSijkm involves scalar quantities at the element level. The calculation requires also the contribution of the second order fields qij . � e
bSijkm =
� T � T T T Ae nemi Cej qek + neij Cek qem + nem Cei qejk + nei Cem qejk + 2neT i Cej qekm 2qTk K0 qk
(2.109)
As previously stated, the element area Ae has to be substituted by the element length Le for the beam element.
2.5.4
Modification for pre-buckling rotations
If the pre-buckling rotations are not neglected as discussed in section 2.2.5, The geometric stiffness matrix and the post-buckling coefficients are modified. The geometric stiffness matrix for the shell element is now written as:
KG =
�
� � Ae ne01 Kexx + ne02 Keyy + ne03 Kexy + CT0 Am BL + BTL Am C0
(2.110)
e
the last two terms account for the re-direction of stresses due to the pre-buckling deformations. We report here the formulas the finite element form of the post-buckling curvature for the case of symmetric structures, i.e. a ˜S = 0. The ˜bS coefficients is written as: � ˜bS =
e
� � Ae 2nT1 C1 q11 + nT2 C1 q1 + 1/2qT1 CT1 Am Cq1
� � 2λC e Ae 2nT1 C0 q1 + nT0 C1 q1
(2.111)
We will show a comparison between the two formulations (pre-buckling rotations neglected and included) in the case of a cylindrical shell loaded with uniform external pressure. 44
Koiter’s analysis for initial post-buckling
2.6
Numerical examples
We present here some examples to show the effectiveness of the proposed finite element formulation and the capabilities of the method. The finite element implementation of the Koiter’s analysis as well as a path-following technique based on the normal flow algorithm as in [60] has been carried out in MATLAB.
2.6.1
Roorda’s frame
The accuracy of the proposed finite element implementation is demonstrated via the classical example of the Roorda’s frame. The analytical solution is originally given by Koiter [43] and reprised in [13, 57, 40]. The structure consists of two beams of equal length connected at a 90 degrees angle and hinged at both tips. A vertical load is applied at the joint to compress the vertical member. A sketch of the structure is shown in figure 2.5.
Figure 2.5: The Roorda’s frame The analytical solution relies on the hypothesis of infinite axial rigidity, i.e. the ratio between axial and bending stiffness is assumed to be small 45
Chapter 2
EI �1 EAL2 The following properties are chosen: • L = 100 mm • EA = 1.05 · 105 N • EI = 2.1875 · 103 Nmm2
The analytical solution yields the following values for the buckling load λC and the post-buckling coefficients aS and bS respectively: • λC = 3.0375 N • aS = 0.380520 • bS = 0.142137
The buckling mode is normalized as to have a unit rotation at the node where the load is applied. The structure is characterized by a non-zero aS coefficient. The maximum sustainable load thus depends on the sign of the deformation. The linear pre-buckling solution q0 , the buckling mode q1 and the second order field q11 are shown in figure 2.6 for a finite element mesh of 20 elements for each member.
(a) q0
(b) q1
(c) q11
Figure 2.6: Roorda’s frame: pre-buckling solution, buckling mode and second order field. Note the non-uniform axial displacement of the vertical member in the second order field q11 .
46
Koiter’s analysis for initial post-buckling
The finite element results are reported in table 2.2. It can be noticed that the conventional beam element exhibits an extremely slow convergence for the bS coefficient. The element based on the averaged kinematic model yields accurate results for a small number of elements. No. of el. 2 4 8 16 32 64
λC 3.0682 3.0340 3.0377 3.0376 3.0375 3.0375
aS -0.37812 -0.38044 -0.38053 -0.38052 -0.38052 -0.38052
aS averaged -0.37801 -0.38037 -0.38052 -0.38052 -0.38052 -0.38052
bS 91.0544 23.5570 6.7444 1.8404 0.5698 0.2493
bS averaged 0.140644 0.142009 0.142129 0.142137 0.142137 0.142137
Table 2.2: Roorda’s frame: convergence results for Koiter’s analysis. The conventional beam element yields an extremely slow convergence of the bS coefficient. Some comparisons with full nonlinear path-following analysis carried out with the commercial finite element program ABAQUS are shown in figure 2.7. The geometrical imperfection is imposed as the normalized buckling mode with different magni¯ The sign of the imposed imperfection is such that the structure exhibits an tudes ξ. unstable post-buckling behavior. The limit load and the initial post-buckling path are fairly accurately reproduced.
47
1
1
0.8
0.8
0.8
0.6
0.6
0.6
λ/λ
0.4
C
1
λ/λC
λ/λC
Chapter 2
Koiter ABAQUS
0.4 0.2
0.2 0 −0.8
−0.6
−0.4
0.2
0 0
−0.2
0.4
0.2
0.4
0 −0.4
0.6
rotation corner B
rotation corner A
−0.2
0
0.2
rotation corner C
0.8
0.8
0.6
0.6
0.6
0.4
λ/λC
0.8
λ/λC
λ/λC
(a) ξ¯ = 0.01
0.4 Koiter ABAQUS
0.2
0.2 0 −1.6
−1.2
−0.8
−0.4
rotation corner A, rad
0
0 0
0.25
0.5
0.75
0.4 0.2
1
rotation corner B, rad
0 −0.2
0
0.2
(b) ξ¯ = 0.1
Figure 2.7: The Roorda’s frame: Koiter’s vs full nonlinear analysis
48
0.4
rotation corner C, rad
Koiter’s analysis for initial post-buckling
2.6.2
Three beam frame
The following example is characterized by the possibility of having clustering of buckling loads. The structure is constituted by three straight beams connected in a reversed ”Y” fashion. The cross section of the members is circular, with a diameter of d1 and d2 for the top beam and the lower beams, respectively. The lower tips of the lower beams are pinned, while the upper extremity of the top vertical member is constrained in the horizontal direction. A unity vertical load is applied at the top to compress the structure. A sketch of the frame with the geometrical properties, applied load and boundary conditions is shown in figure 2.8. The length L is 30 mm and the elastic modulus E is 210000 N/mm2 . The diameter d1 of the cross section of vertical member is set to 3 mm.
Figure 2.8: The three-beam frame
The structure is modeled with 7 beam elements for the vertical beam and 10 beam elements for the base beams. If the ratio between the cross section diameters is varied, the value of the first two buckling loads tends to approach unity. The values of λ1 and λ2 together with their ratio is shown in table 2.3. The clustering of the buckling loads potentially leads to modal interaction. A Koiter’s analysis of the frame has been performed by taking into account the first two buckling modes. The linear solution q0 , the buckling modes q1 and q2 and the corresponding second order 49
Chapter 2
fields q11 , q12 and q22 are shown in figures 2.9 and 2.10 for d2 /d1 = 0.3. d2 d1 λ1 λ2 λ2 λ1
0.3
0.45
0.6
0.75
0.9
106.4 107.3
522.0 543.2
1516.9 1716.9
3168.4 4191.9
5397.1 8693
1.01
1.04
1.13
1.32
1.61
Table 2.3: Three beam frames: first two buckling loads for different cross section diameter ratios. The ratio of the first two buckling loads approaches one as the ratio of the two cross section diameters decreases.
(a) q0
(b) q1
(c) q2
Figure 2.9: Three beam frame: pre-buckling solution and first two buckling modes, d2 /d1 = 0.3.
(a) q11
(b) q12
(c) q22
Figure 2.10: Three beam frame: second order fields, d2 /d1 = 0.3. The buckling modes are normalized to have a unit rotation at the bottom tip. The outcome of Koiter’s analysis for a particular imperfection pattern is shown in figures 2.11 and 2.12. The structure exhibits a limit point behavior. As the ratio of the first 50
Koiter’s analysis for initial post-buckling
two buckling loads approach unity through a tuning of the cross section diameters of the members, the reduction in limit load with respect to the first buckling load becomes more pronounced. Some results are shown in figure 2.13, where the ratio of the maximum sustainable load λmax and the first buckling load λ1 is plotted as a function of the diameter ratio and the buckling loads ratio, for two different imperfection patterns. The reduction of the limit load value is evident as the two buckling loads tend to coincide. 100 80
λ
60 40 ξ
20
1
ξ2 0 −1
0
1
ξ
2
3
Figure 2.11: Three beam frame: modal response of Koiter’s analysis, ξˆ1 = 0.05, ξˆ2 = −0.05, d2 /d1 = 0.3
51
1
0.8
0.8
0.6
0.6
1
1
λ/λ
λ/λ
1
Chapter 2
0.4 0.2
0.2
0 −5
0
5
10
15
0 0
20
0.2
x 10
1
0.8
0.8
0.6
0.6
1
1
0.4
0.4
0.6
0.8
rotation node 2, rad
−3
λ/λ
1
rotation node 1, rad
λ/λ
0.4
0.2
0.4 0.2
0 0
0.005
0.01
0.015
0.02
0 −0.8
0.025
−0.6
rotation node 3, rad
−0.4
−0.2
0
rotation node 4, rad
Figure 2.12: Three beam frame: nonlinear static responses at relevant nodes, ξˆ1 = 0.05, ξˆ2 = −0.05, d2 /d1 = 0.3
0.85
0.85
0.8
0.8
0.75
λ
max
/λ
λmax/λ1
0.9
1
0.9
0.7
0.7 [−0.05 0.05] [ 0.05 0.05]
0.65 0.6 0.2
0.75
0.4
0.6
0.8
d /d 2
1
[−0.05 0.05] [ 0.05 0.05]
0.65
1
0.6 1
1.1
1.2
λ /λ 2
1.3
1.4
1
Figure 2.13: Three beam frame: maximum sustainable load as function of cross section diameter ratio (left) and first two critical loads ratio (right). The ratio between the limit load and the first buckling load decreases as the first two buckling loads tend to coincide.
52
Koiter’s analysis for initial post-buckling
2.6.3
Rectangular plates
The proposed shell element formulation is tested on rectangular plates of different aspect ratios loaded in compression and shear. Different boundary conditions are considered. These test were presented by Lanzo et al. in [47] where High Continuity (HC) rectangular flat elements where used. The different boundary conditions and load configurations are sketched in figures 2.14 and 2.15. The first set of tests (A1 to A4) refers to plates uniformly compressed in the longitudinal direction by a (1 × λ) load distribution along the transversal edge. Different boundary conditions are considered for the out-of-plane displacement of the edges, while free edges conditions are assumed for the in-plane displacements. Test C1 and C2 consider a uniform shear load applied at the the edges. For all the presented cases, the following properties have been considered: E = 2.1 × 10⁶ , ν = 0.25, h = 1. In-plane loaded plates are symmetric structures, i.e. the post-buckling behavior is symmetric with respect to the sign of the deformation. Therefore, the static postbuckling slope coefficient aS is zero. The numerical results are reported in tables 2.4 and 2.5. Analytical results are available for the test case A1, A2 and A3 for the buckling load from [13]. They are reported in parentheses by the obtained numerical values. In spite of the relative simplicity of the proposed finite element (linear shape functions for the quadratic terms in the kinematical model), these is a good agreement for the critical loads for relative coarse meshes. The agreement of the bS factor with the results of [47] is also reasonably good.
53
Chapter 2
a
a
b
b
(a) test A1
(b) test A2
a
b
a
b
(c) test A3
(d) test A4
Figure 2.14: Rectangular plates: compression case studies
a
a
b
b
(a) test C1
(b) test C2
Figure 2.15: Rectangular plates: shear case studies
54
Koiter’s analysis for initial post-buckling
Case Test A1 a/b=1
Test A2 a/b=1
Test A3 a/b=2 Test A4 a/b=2
Mesh 10 15 20 25 10 15 20 25 20 30 40 20 30 40
x x x x x x x x x x x x x x
10 15 20 25 10 15 20 25 10 15 20 10 15 20
λ1 ·
�
π2 Eh3 b2 12(1−ν 2 )
�−1
4.03883 4.01714 4.00962 4.00615 (4) 8.04340 7.84367 7.77608 7.74526 (≈ 7.69) 1.38580 1.38604 1.38611 (≈ 1.38) 4.94684 4.89094 4.87168
Lanzo et al.[47]
4.00263 (25x25)
7.71346 (33x33) 1.38808 (33x17) 4.85495 (49x21)
bS 0.19188 0.19172 0.18563 0.18608 0.22300 0.20535 0.19847 0.19954 0.01217 0.01055 0.00980 0.26322 0.26562 0.26209
Lanzo et al.[47]
0.18244 (25x25)
0.19575 (33x33) 0.00880 (33x17) 0.26082 (49x21)
Table 2.4: Rectangular plates: compression results Case Test C1 a/b=1
a/b=2
a/b=3 Test C2 a/b=1
a/b=2
a/b=3
Mesh 10 15 20 25 10 15 20 10 15 10 15 20 25 10 15 20 10 15
x x x x x x x x x x x x x x x x x x
10 15 20 25 20 30 40 30 45 10 15 20 25 20 30 40 30 45
λ1 ·
�
π2 Eh3 b2 12(1−ν 2 )
9.41626 9.37709 9.35176 9.34227 6.68204 6.59422 6.58086 5.94313 5.88626 15.48724 15.00922 14.84668 14.77238 10.67048 10.43364 10.35193 9.89650 9.69401
�−1
Lanzo et al.[47]
9.35185 (25x25) 6.56822 (23 x 45) 5.8846 (15x45)
14.7822 (25x25) 10.34334 (23 x 45) 9.74613 (15x45)
bS 0.11609 0.11697 0.11521 0.11564 0.07360 0.07381 0.07235 0.08367 0.08120 0.11050 0.11643 0.11532 0.11681 0.13773 0.13162 0.13275 0.08624 0.08744
Lanzo et al.[47]
0.11452 (25x25) 0.07170 (23 x 45) 0.07992 (33x17)
0.11685 (25x25) 0.13282 (23 x 45) 0.08650 (15x45)
Table 2.5: Rectangular plates: shear results
55
Chapter 2
(a) test C1, a/b = 2, q1
(b) test C1, a/b = 2, q11
(c) test C2, a/b = 2, q1
(d) test C2, a/b = 2, q11
Figure 2.16: Rectangular plates: test C1 and C2, buckling modes and second order fields. The buckling modes and the second order fields feature out-of-plane and in-plane displacements, respectively.
56
Koiter’s analysis for initial post-buckling
2.6.4
Rectangular flat plate with nearly coincident modes
The actual imperfection pattern present in a structure can trigger different postbuckling behaviors. This phenomenon is well illustrated by the following example. We consider here a rectangular flat plate. The boundary and load conditions are equivalent to the test A1 described in the previous section. The sides are a = 140 mm and b = 100 mm long, respectively, and the thickness is 1 mm. The elastic material properties are E = 70000 N/mm2 and ν = 0.3. The plate is meshed with 616 triangular shell elements. The aspect ratio of the plate is chosen such that the plate exhibits two almost coincident buckling modes with buckling loads of 362 N and 368 N respectively. The first two buckling modes are shown in figure 2.17 while the second order fields are shown in figure 2.18.
(a) q1 , λ1 = 354.09 N
(b) q2 , λ2 = 360.01 N
Figure 2.17: Rectangular plate: buckling modes
The imperfection pattern superimposed to the plate can trigger either the first or the second buckling mode in the post-buckling range. A multi-mode analysis including the first two buckling modes is therefore essential in this case. The buckling modes are normalized so that the maximum out of plane displacement is equal to the thickness of the plate. Due to the symmetry of the structure and the applied load, the aSijk coefficients are all zero. The bSijkl coefficients are reported in table 2.6. Two different imperfection patterns as a combination of the two retained buckling modes are applied, [ξ¯1 ξ¯2 ] = [0.01 0.0058] and [ξ¯1 ξ¯2 ] = [0.01 0.006] respectively. The modal response for these two imperfection combinations is shown in figure 2.19. 57
Chapter 2
(a) q11
(b) q12
(c) q22
Figure 2.18: Rectangular plate: second order fields
b1111 0.1353 b2111 0
b1112 0 b2112 0.0663
b1121 0 b2121 0.2796
b1122 0.0663 b2122 0
b1211 0 b2211 0.2747
b1212 0.0675 b2212 0
b1221 0.2747 b2221 0
b1222 0 b2222 0.2221
Table 2.6: Rectangular plate: bSijkl coefficients
It can be noticed that the amplitudes of the two included modes grow in the initial post-buckling stage, then the first mode prevails in the first case, while the second mode is predominant for the second imperfection combination. The location of the monitored nodes are shown in figure 2.20. The out-of-plane displacement of the considered nodes is shown in figure 2.21 for the two considered imperfections. The comparison with full nonlinear path-following analysis is very good. The reduced method is able to accurately capture the different post-buckling behavior for different imperfection patterns imposed to the structure. The comparison of the computational time involved in the Koiter and full nonlinear analysis are summarized in table 2.7. The remarkable time saving possible with the Koiter’s analysis is evident. 58
Koiter’s analysis for initial post-buckling
[ξ¯1 ξ¯2 ] = [0.01 0.0058]
600
500
500
400
400
load, N
load, N
600
300 200
[ξ¯1 ξ¯2 ] = [0.01 0.0060]
300 200
ξ
1
100 0 0
100
ξ2 0.5
1
1.5
ξ
2
0 0
0.5
1
ξ
1.5
2
Figure 2.19: Rectangular plate: post-buckling modal responses. Depending on the different imperfection patterns, the first or the second mode prevails and the other vanishes.
A (35,50) B (70,50)
C (105,50)
y
x
Figure 2.20: Rectangular plate: monitored nodes
59
Chapter 2
point A
point B
load, N
load, N
400
200
600
500
500
400
400
300 200 100
0 −1.5
−1
−0.5
0 −1.5
0
point C
600
load, N
600
Koiter
300 200 100
Full −1
−0.5
0 −1.5
0
displacement, mm
displacement, mm
−1
−0.5
0
displacement, mm
(a) ξ¯1 = 0.01, ξ¯2 = 0.0058
point A
point B
600
point C
600
600
500
200
400
load, N
load, N
load, N
400
300 200
Koiter Full
400
200
100 0 −1.5
−1
−0.5
displacement, mm
0
0
−0.2
−0.1
displacement, mm
0
0 −0.5
0
0.5
displacement, mm
(b) ξ¯1 = 0.01, ξ¯2 = 0.006
Figure 2.21: Rectangular plate: Koiter vs. full nonlinear analysis, nodal responses.
pre-buckling state q0 buckling modes qi post-buckling slopes aSijk second order modes qij post-buckling curvature bSijkm load-displacement curve total time (sec)
Koiter 0.4 3.9 3.2 2.5 4.0 18.1 32.1
Full nonlinear N.A. N.A. N.A. N.A. N.A. 909.0 909.0
Table 2.7: Rectangular plate: comparison of computational times
60
1
Koiter’s analysis for initial post-buckling
2.6.5
Rectangular Plate with cutouts
The analysis of a compressed rectangular plate with circular cutouts is presented in this section. This example shows the capability of the Koiter’s analysis to reproduce mode-jumping phenomena (i.e. a marked change in the deformation pattern) occurring at load levels rather far from the first bifurcation load. A sketch of the structure with the relevant geometric parameters, the applied load and the boundary conditions is shown in figure 2.22.
w=0 H v,w=0
B
d
w=0
A
a
d
v,w=0 L
y,v
z,w x,u
Figure 2.22: Rectangular plate with cutouts The following geometrical and material properties are considered: • L = 120 mm • H = 60 mm • d = 15 mm • t = 0.5 mm • a = 30 mm • E = 70000 N/mm2 • n = 0.33 61
Chapter 2
The load is applied uniformly at the short edges. The four edges of the plate are constrained with respect to the out-of-plane displacement component w. The v displacement component of the unloaded edges is constrained as well. The plate is meshed with 704 elements for a total of 2388 degrees of freedom. A buckling analysis was performed and the first 5 buckling modes were considered. The eigenvalue analysis reveals two rather close buckling loads corresponding to a one half wave and two half waves mode respectively. The third, fourth and fifth modes correspond to buckling loads far from the first critical load and they feature a three, four and five half waves buckling pattern respectively. Three Koiter’s analyses were carried out by retaining the first two, three and five modes respectively. An imperfection pattern constituted by the first two buckling modes is considered. The imperfection amplitudes are [ξ¯1 ξ¯2 ] = [0.005 0.02], the modes being normalized to have the maximum w displacement equal to the thickness of the plate. The second order fields qij are shown in figure 2.24. As for the previous examples, they contain only in-plane displacement components. The ovalization of the circular cutouts to account for the effect of shortening is evident. A careful inspection of the modal responses reported in figure 2.25 reveals the mode jumping phenomenon. For the two modes analysis, the first mode initially prevails but the amplitude of the second mode soon increases while the first mode practically disappears. In this case, the mode-switching occurs with a limited drop in the applied load. A three mode analysis renders a more realistic picture. After buckling has onset, the first mode prevails and the amplitude of the second mode gently fades. However, also because of the effect of the cutouts, the post-buckling deformation assumes a saddle-like shape. This deformation cannot be achieved by a combination of the first two buckling modes only. The three-half waves third buckling mode starts to appear in the deformation well before its corresponding critical load value is reached. The transition manifests at a load level of about 67 N. After a rather complicated behavior characterized by a remarkable drop of the applied load, the first and the third modes vanish and the second mode prevails. The same qualitative behavior is captured by the five mode analysis as well. It can be noticed, however, that the transition phase from the first to the second buckling mode is rather different from the previous case. Mode 4 and 5 contributes to the jumping before returning to zero. Their contribution is essential to correctly describe the complicated transition between the first and the second buckling mode. The out-of-plane displacement w of point A and B are shown in figure 2.26. It is evident how all the three reduced analysis can predict the mode jumping behavior. However, only the 5 modes reduced analysis is able to accurately follow the transition phase. The plate behavior is clarified in the sequence of deformation snapshots 62
Koiter’s analysis for initial post-buckling
reported in figure 2.27. The comparison of the computational time required for the Koiter’s analysis with 5 retained modes and the full analysis is reported in table 2.8. It can be concluded that buckling modes associated with critical loads higher than the lowest buckling mode can play and important role in the approximation of the post-buckling deformation in case of mode jumping and must therefore be included in the analysis. This example furthermore highlights the insight in the physical behavior that can be gained with a modal based reduction method.
pre-buckling state q0 buckling modes qi post-buckling slopes aSijk second order modes qij post-buckling curvature bSijkm load-displacement curve total time (sec)
Koiter (5 modes) 0.4 3.6 14.3 7.4 35.7 83.5 144.9
Full nonlinear N.A. N.A. N.A. N.A. N.A. 3062 3062
Table 2.8: Rectangular plate with cutouts: comparison of computational times
63
Chapter 2
(a) q1 , λ1 = 23.56 N
(b) q2 , λ2 = 28.09 N
(c) q3 , λ3 = 45.47 N
(d) q4 , λ4 = 58.47 N
(e) q5 , λ5 = 81.85 N
Figure 2.23: Rectangular plate with cutouts: first five buckling modes. The buckling analysis reveals two almost coincident first buckling loads. The 3rd , 4th and 5th buckling loads are far from the two first values.
64
Koiter’s analysis for initial post-buckling
(a) q11
(b) q12
(c) q13
(d) q14
(e) q15
(f) q22
(g) q23
(h) q24
(i) q25
(j) q33
(k) q34
(l) q35
(m) q44
(n) q45
(o) q55
Figure 2.24: Rectangular plate with cutouts: second order fields. They contain in-plane displacement components only.
65
Chapter 2
5 modes
3 modes
80
80
80
60 40
load, N
100
load, N
100
60 40 20
20 0 −1
0
ξ
1
2
60 40 20
0 −1
0
ξ1
1
ξ
ξ2
ξ3
0 −1
2 ξ4
0
ξ
1
ξ5
Figure 2.25: Rectangular plate with cutouts: Koiter’s multimode analyses, [ξ¯1 ξ¯2 ] = [0.005 0.02]. The 2 mode analysis captures the jumping from the first to the second buckling mode. The 3 and 5 mode analysis reproduce the same phenomenon but the transition phase is more realistically reproduced. Note the response of the third mode before the limit load that contributes to the saddle-like post-buckling deformation. point A
point B
100
100
80
80
60
60
load, N
load, N
load, N
2 modes 100
40
40
20
20
0 −1
−0.5
0 0.5 displacement, mm Koiter 2 modes
1
Koiter 3 modes
0 −1
−0.5
0 0.5 displacement, mm
Koiter 5 modes
1
Full nonlinear
Figure 2.26: Rectangular plate with cutouts: node response comparison. The five modes analysis is able to correctly capture the complicated transition phase of the mode jumping.
66
2
Koiter’s analysis for initial post-buckling
(a) λ = 24.08 N
(b) λ = 32.82 N
(c) λ = 58.46 N
(d) λ = 66.33 N
(e) λ = 61.63 N
(f) λ = 57.59 N
(g) λ = 55.63 N
(h) λ = 43.52 N
(i) λ = 29.03 N
(j) λ = 28.66 N
(k) λ = 38.76 N
(l) λ = 90.23 N
Figure 2.27: Rectangular plate with cutouts: static deformation sequence (deformation scale factor 20). After the limit load of λ = 66.33 N is reached, the deformation loses symmetry and the transition to the two half-wave deformation begins.
67
Chapter 2
2.6.6
T-section beam
This example highlights the importance of a proper kinematical model discussed in 2.4. We consider here a simply supported beam with a T-shaped cross section. The geometry and boundary conditions are reported in figure 2.28. The beam is bent by a vertical force applied at the midspan. The following geometrical and material properties are considered: • L = 450 mm • H = 65 mm • W = 38 mm • t = 1 mm • E = 70960 N/mm2 • ν = 0.321 The structure is meshed with the triangular element presented in section 2.5. We refer as a mesh density parameter n the number of nodes on the half-edge of the tip of horizontal flange. The geometric properties are chosen to have the first two buckling loads almost coincident. The corresponding buckling modes feature both global displacement and local wrinkling of the flanges. The isometric and top view of the first two buckling modes are shown in figure 2.29. It can be noticed that the second buckling mode is characterized by in-plane bending of the top flange. This situation makes the presence of in-plane rotational terms in the kinematical model of paramount importance. The buckling loads have been calculated by using the Von Karman kinematical model (VK) (2.51), which neglects in-plane rotations, and the simplified lagrangian model (SL) (2.53) for a mesh size n = 3. The results are summarized in table 2.9. There is no noticeable difference in the buckling modes calculated with the two different kinematic models. While the agreement for the first buckling load is rather good, the second buckling load exhibits a difference of about 10%. The limitations of the Von Karman model (2.51) are even more evident if the post-buckling behavior is examined. A two-mode Koiter’s analysis has been carried out using the two considered kinematical models. The second order fields are shown in figure 2.30. The modal amplitudes for the two cases can be seen in figure 2.31. While the VK model yields a stable post-buckling behavior, the more accurate SL model predicts an unstable path. The effect of 68
Koiter’s analysis for initial post-buckling
A
B
Figure 2.28: T-section beam
the in-plane rotations are therefore critical to determine the correct post-buckling behavior. The convergence of the post-buckling coefficients has been also investigated. The absolute values of the bSijkl coefficients are reported in figure 2.33 for increasing values of the parameter n. A mesh density of at least n = 5 is needed for a reasonable accuracy.
λ1 λ2
Von Karman model (2.51) 2823 N 3302 N
Simplified Lagrangian model (2.53) 2816 N 3072 N
Table 2.9: T-section beam: comparison of critical loads. Note the difference of the second buckling load predicted by the two different kinematical models. The Von Karman model (2.51) neglects the in-plane rotational terms and yields a buckling load about 10% higher.
69
Chapter 2
(a) q1 , isometric view
(b) q2 , isometric view
(c) q1 , top view
(d) q2 , top view
Figure 2.29: T-section beam: first two buckling modes. The second mode q2 features a substantial in-plane shear deformation that needs to be accounted for in the kineamatical model.
A 2-modes Koiter’s analysis has been performed and the results were compared with a full nonlinear path-following analysis using ABAQUS. A mesh density parameter n = 5 has been used. The ABAQUS model has been meshed with the same density using the 4-nodes quadrilateral shell element S4R. An imperfection in the shape of the first mode of an amplitude of 0.1 has been imposed to the structure, the buckling modes being normalized such to have a unity maximum displacement. The reduced analysis is able to capture the limit point and the initial unstable post-buckling behavior.
70
Koiter’s analysis for initial post-buckling
(a) q11
(b) q12
(c) q22
Figure 2.30: T-section beam: second order fields
4500 4000 3500 3000
λ
2500 2000 ξ1 SL
1500
ξ SL 2
1000
ξ1 VK
500
ξ VK
0 −4
2
−2
0
ξ
2
4
6
Figure 2.31: T-section beam: Koiter’s analysis with the Von Karman (2.51) and the simplified lagrangian (2.53) kinematical model. The omission of the in-plane rotational terms results in an erroneous stable postbuckling behavior.
71
3000
3000
2500
2500
2000
2000
load, N
load, N
Chapter 2
1500
1500
1000
1000
500
500
0 −10
−8
−6
−4
−2
0
2
4
0 −2.5
−2
u, mm point A Koiter
−1.5
−1
point A ABAQUS
point B Koiter
point B ABAQUS
Figure 2.32: T-section beam: Koiter vs full nonlinear analysis
72
−0.5
v, mm
0
5 grid size
10
0
0
0
0
5 grid size
5 grid size b2212
2112
5 grid size b
1212
5 grid size b
b1112
10
10
10
10
0.2
0.4
0.6
0.8
0
1
2
0.2
0.3
0.4
0.2
0.4
0.6
0
0
0
0
5 grid size
5 grid size b2221
2121
5 grid size b
1221
5 grid size b
b1121
10
10
10
10
Figure 2.33: T-section beam: convergence of bSijkl
0
0
0
0
0.5
10
0.5
5 grid size b2211
0.5
1
1
0
2111
1
0.35
0.4
0.45
0.5
0
10
0 5 grid size b
0.2
0.2
0
0.4
0.4
1211
0.2
0.5 10
0.3
1 5 grid size b
0.4
1.5
0
0.5
b1111 2
0
0.1
0.2
0
0.5
1
0
0.2
0.4
0
0.2
0.4
0
0
0
0
5 grid size
5 grid size b2222
2122
5 grid size b
1222
5 grid size b
b1122
10
10
10
10
Koiter’s analysis for initial post-buckling
73
Chapter 2
2.6.7
Cylindrical shell under external pressure
A cylindrical shell is here considered to demonstrate the accuracy of the proposed finite element implementation for curved structures. The geometrical properties and the applied load are sketched in figure 2.34.
Figure 2.34: Cylindrical shell The edges are restrained in the radial and circumferential directions, v and w respectively. The shell is loaded with a uniform external pressure. Only 1/8 of the structure is modeled, i.e. three planes of symmetry have been considered: one normal to the longitudinal axis of the shell and the other two normal to each other cutting the shell in the longitudinal direction. The following properties are considered: • L = 5.08 in. • R = 10.16 in. • h = 0.01179 in. • E = 0.1048 · 108 lb/in2 . • ν = 0.30 One buckling mode with 16 half-waves in the circumferential direction is considered. The pre-buckling solution q0 is reported in figure 2.35. while the considered buckling 74
Koiter’s analysis for initial post-buckling
mode q1 and the corresponding second order field q2 are shown in figure 2.36. It can be noticed that the buckling mode does not contain any axisymmetric component. The second order field results in twice the number of circumferential waves of the buckling mode. In addition, an axisymmetric contraction in also present. These shapes coincide which those predicted by the semi-analytical approach with assumed buckling mode shapes [39]. This constitutes a further confirmation of the correctness of the approach. We compare here the values of the buckling load and the postbuckling curvature obtained by neglecting and including the pre-buckling rotations, as discussed in section2.2.5, with values obtained by a semi-analytical approach using assumed mode shapes [39] and Donnell’s shell theory. The results are shown in table 2.10. The buckling mode has been normalized to feature a maximum out-of-plane displacement of one thickness of the shell. The grid size reported in the first column refers to the number of nodes in the longitudinal and the circumferential direction of the mesh, respectively. The finite element calculation including the effect of pre-buckling rotation converges to the analytical results, while the omission of the pre-buckling deformation results in a slightly higher buckling load. The values of the post-buckling coefficients show negligible difference. Mesh 20 × 126 25 × 158 30 × 189 35 × 220 40 × 252 45 × 283 From [41]
λC 1.3689 1.3665 1.3652 1.3644 1.3639 1.3635 1.3448
˜C λ 1.3509 1.3488 1.3476 1.3469 1.3465 1.3462
bS -0.1662 -0.1736 -0.1769 -0.1784 -0.1777 -0.1798 -0.1809
˜bS -0.1775 -0.1852 -0.1803 -0.1899 -0.1891 -0.1861
Table 2.10: A-8 cylindrical shell: numerical results
75
Chapter 2
Figure 2.35: A-8 cylindrical shell: pre-buckling solution q0
(a) q1 , isometric view
(b) q1 , top view
(c) q11 , isometric view
(d) q11 , top view
Figure 2.36: A-8 cylindrical shell: buckling mode and second order field
76
Koiter’s analysis for initial post-buckling
2.7
Conclusions
The Koiter’s initial post-buckling analysis has been presented in a general functional notation. Both single mode and multi-mode analysis have been considered. Accuracy issues rising from the employed kinematical models are discussed. Is has been shown that some quadratic terms in the Green-Lagrange kinematical tensor are responsible for the uncorrect values of the post-buckling curvature coefficient. The problem arises when the structure is statically determined, i.e. there is no stress-redistribution after buckling has occurred. For shell analysis, the in-plane rotational terms of the kinematical model must be conserved. A simple finite element implementation using constant strain quantities to avoid locking is proposed. A 2D beam element and a 3D triangular shell element is presented. Several examples are presented to show the capability of the method as well as the performance of the proposed FE implementation. Good convergence properties of the presented elements has been achieved. The Koiter’s method allows a substantial gain in computing time with respect to full nonlinear analysis while retaining good accuracy in the vicinity of the critical point. Complicated mode interaction and mode jumping phenomena occurring at load levels remarkably higher than the critical load has been successfully captured with the reduced analysis.
77
Chapter 2
78
Chapter 3
Perturbation analysis for nonlinear vibrations 3.1
Introduction
Another powerful application of perturbation methods lies in the analysis of nonlinear vibration of structures. A linear free vibration analysis leads to an eigenvalue problem that provides vibration modes and the corresponding frequencies. The underlying hypothesis is the infinitesimality of the displacements. However, when the deformations become finite, geometric effects introduce a dependency of the frequency on the amplitude of vibration. This results in a softening or hardening effect, whether the frequency decreases or increases with respect of an amplitude parameter, respectively. Following the same line of the initial post-buckling analysis presented in chapter 2, a perturbation method directly yields a curvature coefficient for the frequency-amplitude relation that accounts for the most important nonlinear effect. The calculation of this coefficient is based on second order displacement fields resulting from the second order terms of the perturbed equations. These second order modes constitute the main displacement correction to the linear vibration mode to account for the geometric nonlinearity and furnish a prompt physical interpretation of such effect. As discussed in chapter 2, the framework can be extended for the case of multiple modes with coincident frequencies. In this case, the modes can interact and are 79
Chapter 3
likely to modify the frequency-amplitude relation. In this chapter, we present the perturbation method for nonlinear vibrations outlining the similarities and the differences with respect to the treatment of initial postbuckling. The presented method is implemented into a finite element framework and applied to simple 2-D beam structures as well as 3-D cylindrical shells. The results of all the presented examples were compared to analytical and semianalytical solutions available in the literature.
3.2
The perturbation method
We denote with u, ε , and σ a generalized displacement, strain and stress field. Each symbol can be thought of as a vectorial entity, its specific dimension depending on the particular problem at hand. The strain-displacement relation is assumed quadratic, as 1 ε = L1 (u) + L2 (u) 2
(3.1)
where L1 and L2 are linear and quadratic functional respectively. The stress-strain relation is
σ = H(εε)
(3.2)
H(εε1 ) · ε 2 = H(εε2 ) · ε 1
(3.3)
The reciprocity relation
holds for any field u1 and u2 . The dynamics of the system under periodic motion is governed by Hamilton’s principle, that can be written as: � 0
80
2π/ω
��
1 M 2
�
∂u ∂t
� ·
∂u ∂t
�
� − σ · δε dt = 0
(3.4)
Perturbation analysis for nonlinear vibrations
The ”dot” operation implies the inner multiplication of variables and the integration over the entire domain. The mass operator M ( ) is assumed homogeneous and linear with the following symmetric property M (u) · v = M (v) · u,
∀u, v
(3.5)
By introducing the new time variable τ = ωt, equation (3.4) can be rewritten as � 0
2π
� � � � 1 ˙ · u˙ − σ · δε dτ = 0 M (u) ω2 δ 2
(3.6)
where the (˙) operator is intended as stands for ∂( )/∂τ . By integrating by parts we obtain �2π � � ˙ · δu� − ω 2 M (u) 0
0
2π
(σ · δε + M(¨ u) · δu)dτ = 0
(3.7)
The first term vanishes for periodicity condition and we are left with � 0
2π
(σ · δε + M(¨ u) · δu)dτ = 0
(3.8)
If a bilinear functional operator L11 is defined as
L2 (u + v) = L2 (u) + L11 (u, v) + L2 (v) then the variation δεε resulting from δu is written as
δεε = δe + L11 (u, δu)
(3.9)
where e ≡ L1 (u). We assume the vibration mode and the resulting strain and stresses as: 81
Chapter 3
u = ξu1 ε = ξεε1 σ1 σ = ξσ
(3.10)
where ξ is an amplitude parameter associated with mode u1 . If the proposed form (3.10) is substituted in equation (3.7) and only linear terms are retained, the following linear equation is obtained �
2π 0
(ω02 M (¨ u1 ) · δu + σ 1 · δe)dτ = 0
(3.11)
By letting δu = u1 and δe = e1 , the expression for the natural frequency ω0 is found:
ω02
2π
σ 1 · e1 dτ = 2π0 M (u˙ 1 ) · u˙ 1 dτ 0
(3.12)
We assume for now that only one mode u1 is associated to the frequency ω0 . To find how the structure behaves when the amplitude of vibration becomes finite we expand the solution as
u = ε = σ =
ξu1 + ξ 2 u2 + +ξ 3 u3 · · · ξe1 + ξ 2ε 2 + ξ 3ε 3 + · · · ξσ 1 + ξ 2σ 2 + ξ 3σ 3 · · ·
where
82
ε2
=
ε3
= ···
1 L1 (u2 ) + L2 (u1 ) 2 L1 (u3 ) + L11 (u1 , u2 )
(3.13)
Perturbation analysis for nonlinear vibrations
and
σ2 σ3
= = ···
H(εε2 ) H(εε3 )
In order to make the expansion unique, the higher order fields u2 , u3 ,. . . are orthogonalized to u1 with respect to the inertial operator:
u1 ) · uk = 0 , k �= 1 M(u˙ 1 ) · u˙ k = M(¨
(3.14)
This property together with the reciprocal relation (3.3) implies also that
σ1 · ek = 0, k �= 1
(3.15)
H(ek ) · e1 = 0, k �= 1
(3.16)
and
By substituting the expansion(3.13) in the equilibrium equation (3.8) we obtain
2π 0
[
� ξ ω 2 M (¨ u1 ) · δu + σ1 · δe + �
u2 ) · δu + σ2 · δe + σ1 · L11 (u1 , δu) + ξ 2 ω 2 M (¨
� ξ 3 ω 2 M (¨ u3 ) · δu + σ3 · δe + σ1 · L11 (u2 , δu) + σ2 · L11 (u1 , δu) + · · · ] dτ = 0 (3.17)
and letting δu = u1 and accordingly δe = e1 and introducing the expression for ω0 (3.12) we obtain the following equation 83
Chapter 3
2π 0
[
� � ω2 ξ 1 − 2 σ1 · e1 + ω0 σ2 · e1 + σ1 · L2 (u1 )) + ξ 2 (σ
(3.18)
σ3 · e1 + σ1 · L11 (u1 , u2 ) + σ2 · L2 (u1 )) + · · · ] dτ = 0 ξ 3 (σ The reciprocity relation (3.3) allows further simplifications � � 1 1 σ2 · e1 = σ1 · ε2 = σ1 · e2 + L2 (u1 ) = σ1 · L2 (u1 ) 2 2
(3.19)
σ3 · e1 = σ1 · ε3 = σ1 · (e3 + L11 (u1 , u2 )) = σ1 · L11 (u1 , u2 )
(3.20)
and
The governing equation is simplified as 2π 0
[
� � ω2 ξ 1 − 2 σ1 · e1 + ω0 23 ξ σ1 · L2 (u1 )+ 2
(3.21)
σ1 · L11 (u1 , u2 ) + σ2 · L2 (u1 )) + · · · ] dτ = 0 ξ 3 (2σ A relation between the frequency ω and the amplitude ξ is found ω2 = 1 + aD ξ + b D ξ 2 + · · · ω02
(3.22)
2π 3 σ1 · L2 (u1 )dτ aD = 0 2π 2 M (u˙ 1 ) · u˙ 1 dτ 0
(3.23)
where
84
Perturbation analysis for nonlinear vibrations
and 2π bD =
0
σ1 · L11 (u1 , u2 ) + σ2 · L2 (u1 ))dτ (2σ 2π ˙ ˙ 0 M (u1 ) · u1 dτ
(3.24)
Equation (3.22) is a compact representation of the effect of the amplitude of vibration on the frequency. The calculation of the second order coefficient bD requires the calculation of the second order field u2 . This is obtained by equating the term multiplying ξ 2 in equation (3.21) to obtain: ω 2 M(¨ u2 ) · δu + σ 2 · δe + σ 1 · L11 (u1 , δu) = 0
(3.25)
The second order field u2 is time dependent and it is actually constituted by two parts. In order to obtain the two contributions we have to explicitly write the time dependency of the vibration mode u1 as
u1 e1 σ1
ˆ 1 sin τ = u ˆ1 sin τ = e = σˆ 1 sin τ
(3.26)
where the hatted quantities are spatial shapes multiplied by an harmonic time response. By substituting (3.26) into the second order problem (3.25) we obtain 1 σ 1 · L11 (ˆ u2 ) · δu + σ 2 · δe = − (1 + cos 2τ )ˆ u1 , δu) ω 2 M(¨ 2
(3.27)
It can be noticed that the right hand side of (3.27) is formed by a constant forcing term and a harmonic term respectively. The solution can therefore be split into two parts:
ˆ 21 + u ˆ 22 cos 2τ u2 = u
(3.28)
which are the solution of the two problems 85
Chapter 3
σ ˆ 21 · δe −4ω 2 M(ˆ u22 ) · δu + σ ˆ 22 · δe
1 = − σˆ 1 · L11 (ˆ u1 , δu) 2 1 = − σˆ 1 · L11 (ˆ u1 , δu) 2
(3.29)
ˆ 21 does not where the mass operator of the first problem has been dropped since u depend on time. By accounting for the two different contributions of the second order field u2 and carrying on the time integrations the aD and bD coefficients assume the form
aD = 0
bD
=[
(3.30)
σ 1 · L11 (ˆ ˆ 21 ) + 2σ u1 , u ˆ 22 ) + σ 1 · L11 (ˆ u1 , u u21 )) · L2 (ˆ u1 ) + H (L1 (ˆ
(3.31)
1 H (L1 (ˆ u22 )) · L2 (ˆ u1 ) + 2 3 ˆ1 H (L2 (ˆ u1 )) · L2 (ˆ u1 ) ] /M (ˆ u1 ) · u 8 Unlike the case for initial post-buckling, the dynamic aD coefficient is always zero also for non-symmetric structures. A positive bD coefficient represents a hardening behavior, i.e. the frequency of vibration increases with increasing amplitude. Conversely, a negative bD coefficient indicates a softening behavior.
3.3
Coincident modes
An important case is constituted by multiple vibration modes associated with the same frequency. The vibration modes can interact and modify the frequency-amplitude 86
Perturbation analysis for nonlinear vibrations
curve. This situation can be treated by assuming the displacement field as a linear combination of the M coincident modes ui enriched by the quadratic contribution of the second order interaction modes uij , as u =
ξi ui + ξi ξj uij + · · ·
(3.32)
with the corresponding strain and stress fields
ε σ
= ξiε i + ξi ξj ε ij + · · · = ξiσ i + ξi ξj σ ij + · · ·
(3.33) (3.34)
The derivation is much in the same line as the multi-mode analysis for initial post-buckling. Only the main results are reported here. The nonlinear frequencyamplitude relations are obtained in the following form:
ξI
� � ω2 1 − 2 + ξi ξj aijI + ξi ξj ξk bijkI = 0, I = 1, 2, · · · , M ω0I
(3.35)
The aD and bD coefficients are found as
aDijI =
bDijkI
=
1 ω02I ∆I
�
2π
0
σI · L11 (ui , uj ) + 2σ σi · L11 (uj , uI )] dτ [σ
(3.36)
� 2π 1 1 [ σIi · L11 (uj , uk ) + σij · L11 (uk , uI ) + 2 ω0I ∆I 0 2 σi · L11 (uj , ukI ) ] dτ (3.37) σI · L11 (ui , ujk ) + σi · L11 (uI , ujk ) + 2σ
where � ∆I =
0
2π
M (uI ) · uI dτ
(3.38)
87
Chapter 3
The second order fields uJK are the solution of the second order problem
1 ω 2 M (¨ uJK ) · δu + σJK · δe = − [σJ · L11 (uK , δu) + σK · L11 (uJ , δu)] 2
3.4
(3.39)
Finite element implementation
The method has been applied to finite elements using the beam and shell elements discussed in chapter 2. The implementation is analogous to the one presented in 2.5.3. The same notation is used here. A lumped mass matrix formulation according to the HRZ procedure [25] is used. For the first order vibration mode q1 the eigenvalue problem is written as:
� −ω 2 M + K0 q1 = 0
(3.40)
where K0 is the material stiffness matrix and M is the mass matrix. The linear problem for the second order fields q2 is
2 � −ω M + K0 q2 = g(q1 )
(3.41)
with the orthogonality condition qT1 Mq2 = 0
(3.42)
The forcing term g(q1 ) is formed through an assembly operation of contribution calculated at element level and it is analogous to the right-hand-side vector for the calculation of the second order fields for the Koiter’s analysis, as presented in section 2.5.3.
3.5
Numerical results
We present here some numerical results. The obtained finite element solutions have been compared to available analytical results [63] and semi-analytical treatments [41]. 88
Perturbation analysis for nonlinear vibrations
3.5.1
Simply supported beam
The calculation of the bD coefficient for a simply supported straight beam is presented here. The ends of the beam are immovable and free to rotate. A von-Karman kinematical model is considered. Analytical results are available in [63]. The analytical solution yields the same second order field for the constant and double harmonic contribution. This is due to the fact that the axial inertia is completely neglected in the theoretical treatment together with the fact that the second order fields are rigorously in-plane. The in-plane inertia is taken into account in the finite element solution, but the ratio between the flexural and axial inertia makes the influence of the mass matrix in the calculation of the double harmonic second order field practically negligible. The analytical solution predicts a frequency of vibration of � ω0th =
π 4 EI ρAL4
(3.43)
3π 16
(3.44)
and a coefficient bDth as
bDth =
the out-of-plane displacement W of the beam is non-dimensionalized in the following way
w=
W π
I A
The following numerical values have been used for this calculation: • L=1m • A = 1.0 · 10−4 m2 • I = 8.333 · 10−10 m4 • E = 7.0 · 1010 N/m2 89
Chapter 3
• ρ = 2700 Kg/m3 The comparison between finite element results and the theoretical investigation by [63] are reported in Table 3.1. The obtained results are in excellent agreement with the theoretical values. Number of elements 10 20 40 80 160 320 640 Analytical [63]
ω 145.06961 145.06955 145.06954 145.06954 145.06954 145.06954 145.06954 145.06954
% err. 0.000042 0.000002 0.000000 0.000000 0.000000 0.000000 0.000000
bD 0.60808 0.59387 0.59025 0.58935 0.58912 0.58906 0.58905 0.58904
% err. 3.232146 0.818785 0.205335 0.051335 0.012795 0.003156 0.000073
Table 3.1: Simply supported beam: convergence of ω and bD
3.5.2
Rectangular plates
We consider here a generic isotropic rectangular plate. The analytical treatment of this example has been carried out by Rehfield [63]. Only the final result is here reported. The plates are assumed to be simply supported , i.e. the out-of-plane displacement of all the edges are restrained while the rotations are free. The relative in-plane motion of the edges is prevented. The kinematic model is based on the von Karman equations as discussed in 2.4. The considered vibration mode has one halfwave in both directions for all the considered aspect ratios µ = H/L where H and L are the two dimensions of the rectangular plate. The vibration mode is specified in the theoretical treatment [63] in the form
w(x, y, t) = sin(ωt) sin(
π π x) sin( y) H L
(3.45)
where w(x, y, t) is the out-of-plane displacement field and x and y the in-plane coordinates. The theoretical frequency of vibration ω0th is found to be
ω0th = 90
Dπ 4 ρh
�
H 2 + L2 H 2 L2
�2 (3.46)
Perturbation analysis for nonlinear vibrations
where h is the thickness of the plate and D is the bending stiffness,
D=
Eh3 12 (1 − ν 2 )
(3.47)
If the vibration mode is normalized to have a maximum out-of-plane displacement of one thickness, the theoretical bth coefficient assumes the form
bth =
� � 4 µ + 2νµ2 + 1 1 4 3 + (µ + 1) 32(µ2 + 1)2 (1 − ν 2 ) 2
(3.48)
where ν is the Poisson’s ratio. For reasons similar to the ones discussed for the beam example, the 0th and the 2nd harmonic second order fields are identical and they consist of in-plane displacements only. The numerical results for different mesh sizes and different aspect ratios are reported in Table 3.2, 3.3 and 3.4. Figure 3.1, 3.2 and 3.3 show the vibration mode and the second order field for different aspect ratios. The finite element calculations of the frequency of vibration and the bD coefficient show a good convergence to the theoretical values for all the considered cases. It should be noted that the selected vibration mode (one half-wave in both the longitudinal and lateral directions) is the one with the lowest associated frequency for all the considered cases. Mesh size 10 x 10 20 x 20 30 x 30 40 x 40 Analytical [63]
µ=1 ω0 % err. 96.9836 0.2172 97.1419 0.0544 97.1712 0.0241 97.1815 0.0136 97.1948
bD 0.09249 0.09321 0.09333 0.09336 0.09340
% err. 0.9641 0.1801 0.0729 0.0402
Table 3.2: Flat plates: ω and bD for µ = 1
91
Chapter 3
Mesh size 10 x 20 20 x 40 30 x 60 40 x 80 Analytical [63]
µ=2 ω0 % err. 60.6924 0.1235 60.7331 0.0565 60.7407 0.0441 60.7433 0.0397 60.7675
bD 0.11294 0.11414 0.1143 0.1144 0.11452
% err. 1.3826 0.335 0.148 0.083
Table 3.3: Flat plates: ω and bD for µ = 2
Mesh size 10 x 30 20 x 60 30 x 90 40 x 120 Analytical [63]
µ=3 ω0 % err. 53.9717 0.0470 53.9906 0.0119 53.9942 0.0053 53.9955 0.0030 53.9971
bD 0.12877 0.1304 0.13071 0.1308 0.13096
% err. 1.69711 0.42355 0.18909 0.10800
Table 3.4: Flat plates: ω and bD for µ = 3
ˆ1 (a) u
ˆ 21 = u ˆ 22 (b) u
Figure 3.1: Flat plate: vibration modes and second order field µ = 1
92
Perturbation analysis for nonlinear vibrations
ˆ1 (a) u
ˆ 21 = u ˆ 22 (b) u
Figure 3.2: Flat plate: vibration modes and second order field µ = 2
ˆ1 (a) u
ˆ 21 = u ˆ 22 (b) u
Figure 3.3: Flat plate: vibration modes and second order field µ = 3
93
Chapter 3
3.5.3
Cylindrical shells
We consider here the nonlinear vibration of various cylindrical shells. The obtained FE results have been compared with semi-analytical results reported by Jansen [41]. In this work, all the considered cases were treated with Donnell’s equations extended to dynamic analysis. This approach poses some limitations in the accuracy of the available theoretical results. It is a well known fact that the Donnell’s equations lose accuracy in buckling problems when the buckling mode presents a low number of circumferential waves, say n ≤ 5 [44]. Likewise, the accuracy of Donnell equations for linear vibration analysis is high when the number of circumferential waves n is high. It should be noted, however, that the maximum error does not necessarily occurs for the minimum wave number n [61]. The semi-analytical treatment with the Donnell’s equations differs from the present approach essentially for two aspects: • the in-plane inertia is neglected in the Donnell’s equations. This leads to an error for the frequency of the order 1/n2 for high n. The rotatory inertia is neglected as well. Both of these two effect are accounted for in the presented approach. • the Donnell’s equations neglect the derivatives of the circumferential displacement with respect to the in-plane coordinates in the calculation of the shell curvature.
For all the considered shells, the edges are restrained in the radial direction and free to move in the axial one. These boundary conditions are referred as SS-3 by [41]. The finite element model considers the symmetry of the shells with respect to the mid-plane perpendicular to the axis of the shell. Only half shell is therefore modeled. This avoids the singularity that the SS-3 boundary condition would imply in the axial direction. The geometric and material properties of the considered shell are here reported. • Chen’s shell [21]: R=4 in., t =0.01 in., L=8 in., E = 0.103 ·108 lb/in2 ., ν=0.31, ρ = 0.26178 · 10−3 lb/in3 . The vibration mode considered has n=6 full waves in the circumferential direction and one half wave in the longitudinal direction. • Olson’s shell [56]: R=8 in., t =0.0044 in., L=15 83 in., E = 0.16 · 108 lb/in2 ., ν=0.30, ρ = 0.833 · 10−3 lb/in3 . The vibration mode considered has n=10 full waves in the circumferential direction and one half wave in the longitudinal direction. 94
Perturbation analysis for nonlinear vibrations
• A-8 shell [39]: R=10.16 in., t =0.01179 in., L=5.08 in., ν=0.30, E =0.1048·108 lb/in2 ., ρ = 0.26 · 10−3 lb/in3 . The vibration mode considered has n=16 full waves in the circumferential direction and one half wave in the longitudinal direction. • ES2 shell [27]: R=250 in., t =1 in., L=1570.8 in., E = 1 · 107 lb/in2 ., ν=0.30, ρ = 0.26 · 10−3 lb/in3 . The vibration mode considered has n=5 full waves in the circumferential direction and one half wave in the longitudinal direction. The results, in terms of frequency of vibration and b coefficient, are reported in table 3.5, 3.6, 3.7 and 3.8 for different mesh sizes. The vibration mode is normalized to have a maximum radial displacement of one thickness. Mesh size 100 x 19 150 x 28 180 x 33 Semi-analytical [41]
ω0 545.862 545.759 545.715 556.230
% err. 1.864 1.882 1.890
bD −6.4276 · 10−3 −6.5323 · 10−3 −6.5734 · 10−3 −7.4243 · 10−3
% err. 13.425 12.014 11.461
Table 3.5: Chen’s shell [21] (n = 6)
Mesh size 180 x 33 210 x 38 Semi-analytical [41]
ω0 535.129 535.094 539.367
% err. 0.7859 0.7923
bD −4.8172 · 10−3 −4.7290 · 10−3 −4.608 · 10−3
% err. -4.541 -2.628
Table 3.6: Olson’s shell [56] (n = 10) Mesh size 300 x 15 400 x 19 Semi-analytical [41]
ω0 532.078 531.311 532.03
% err. -0.009 0.135
bD -0.1117 -0.1099 -0.1075
% err. -4.001 -1.394
Table 3.7: A-8 shell [39] (n = 16) The mesh size refers to the number of nodes in the circumferential and in half of the height of the shell respectively. The vibration modes and the corresponding second order fields for the considered are shown in figures 3.4, 3.5, 3.6 and 3.7. 95
Chapter 3
Mesh size 80 x 48 150 x 88 semi-analytical [41]
ω0 23.8316 23.9056 25.205
% err. 5.4486 5.1552
bD −1.7944 · 10−3 −2.7457 · 10−3 −2.5772 · 10−3
% err. 30.3718 6.5406
Table 3.8: ES2 shell [27] (n = 5)
The vibration modes show a periodic radial displacement field that has a zero mean value around the undeformed configuration. The tangential displacement field is also periodic and features an expansion of the inward radial half wave and a contraction of the outward one. The theoretical values of the frequencies of vibration is slightly higher that the one calculated with the FE discretization for all the considered shells. This is in line with the hypothesis of neglecting in-plane and rotational inertia that results in higher frequencies values. There is a general increase in the mismatch of the frequency results when the number of circumferential waves decreases. Nevertheless, the obtained finite element results are in good agreement with the semi-analytical treatment. All the second order fields are constituted by a periodic contribution with 2n circumferential waves and an axisymmetric deformation, as predicted by the semi-analytical results by [41]. All the bD coefficients are negative, thus showing a softening behavior. The results for the A-8 shell are in very good agreement with [41]. This is due to the fact that the considered vibration mode presents a relative high number of circumferential waves (n = 16). The error introduced in the Donnell’s equations by neglecting in-plane displacements in the expressions for the rotations is in this case negligible. The agreement for the other cases is relatively good. The trend for the accuracy is the same as observed for the frequency. The cases more in the region of validity of the Donnell’s equations show a better agreement of the bD coefficients.
3.6
Conclusions
A perturbation approach for the influence of the deflection of the vibration to the frequency of vibration has been presented. The analytical treatment shares a lot of similarities with the initial post-buckling analysis presented in chapter 2. The main difference is the fact that the second order field is now constituted by two different contribution in time, namely constant term and a double-harmonic one. The theory can be extended to multi-modal analysis for the case of coincident frequencies. The same FE implementation used for the post-buckling analysis is here employed. 96
Perturbation analysis for nonlinear vibrations
(a) uˆ1 , isometric view
ˆ 1 , top view (b) u
ˆ 21 , isometric view (c) u
ˆ 21 , top view (d) u
ˆ 22 , isometric view (e) u
ˆ 22 , top view (f) u
Figure 3.4: Chen shell [21]: vibration modes and second order fields
97
Chapter 3
(a) uˆ1 , isometric view
ˆ 1 , top view (b) u
ˆ 21 , isometric view (c) u
ˆ 21 , top view (d) u
ˆ 22 , isometric view (e) u
ˆ 22 , top view (f) u
Figure 3.5: Olson shell [56]: vibration modes and second order fields
98
Perturbation analysis for nonlinear vibrations
(a) uˆ1 , isometric view
ˆ 1 , top view (b) u
ˆ 21 isometric view (c) u
ˆ 21 , top view (d) u
ˆ 22 , isometric view (e) u
ˆ 22 , top view (f) u
Figure 3.6: A8 shell [39]: vibration modes and second order fields
99
Chapter 3
(a) uˆ1 , isometric view
ˆ 1 , top view (b) u
ˆ 21 , top view (c) u
ˆ 21 , top view (d) u
ˆ 22 , top view (e) u
ˆ 22 , top view (f) u
Figure 3.7: ES2 shell [27]: vibration modes and second order fields
100
Perturbation analysis for nonlinear vibrations
Good agreement with the analytical and semi-analytical reference results are obtained. The beam and flat plate examples show excellent match with the theoretical results. The cylindrical shells show overall a fair agreement with the semi-analytical results obtained by [41] by numerically integrating the Donnell’s equations in the longitudinal direction and assuming a periodic mode shape in the circumferential direction. When the shell geometry and considered mode shape are closer to the range of validity of the Donnell’s equations, the agreement of the results is improved.
101
Chapter 3
102
Chapter 4
From static analysis to dynamic analysis 4.1
Introduction
In chapter 2, the Koiter’s initial post-buckling has been presented and discussed. The main outcome of the method are the post-buckling coefficients aS and bS that allow a quick evaluation of the stability of the structure. The same framework can be extended to handle the case of dynamically applied loads. This study is relevant since the dynamic instability can occur for load levels lower than the load level that causes the static instability. The dynamic buckling load is defined as the load magnitude of the dynamically applied load at which a marked raise of some displacement measure is found [15]. A straightforward adaptation of Koiter’s analysis to dynamics has been carried out by [14]. We briefly recall the main features of this treatment and explore the possibility of this framework to handle more general cases. A careful examination of an example furnishes useful guidelines for a more general reduction method for nonlinear transient analysis. 103
Chapter 4
4.2
Dynamic buckling
The procedure presented in 2.2 has been modified by [14] to account for the possibility of dynamic buckling. The outline of the derivation is here presented. We now assume a dynamic load q(t) = λf (t)q0 , where f (t) is an arbitrary time history. The virtual work equation (2.3) is modified to represent dynamic equilibrium: σ · δεε = q · δu − M (¨ u) · δu.
(4.1)
where M (u) is the linear inertial operator and the dots indicate the derivation with respect to time. One can assume that the response of the structure is still dominated by the buckling mode by writing u = λf (t)u0 + ξ(t)u1 + ξ 2 (t)u2
(4.2)
in which the pre-buckling contribution u0 is still assumed to respond statically. By repeating the same procedure as for the static buckling expansion we obtain an ordinary differential equation in time, namely � � 1 ¨ λf (t) λf (t) ξ ξ + ξ 1 − + ξ 2 aS + ξ 3 b S = ωb2 λC λC
(4.3)
where ωb2 is defined as: ωb2 =
σ1 · �1 M (u1 ) · u1
(4.4)
ωb2 is the Rayleigh quotient associated to the buckling mode u1 . If mode u1 happens to be the vibration mode of the structure, ω1 is the natural frequency associated to that mode. Equation (4.3) can be integrated in time to study the approximate dynamic behavior of the system. The complete derivation can be found in [14]. It can be reminded here that, for simple load cases as a step load or a square finite impulse, it is possible to relate the static limit load λS obtained with Koiter’s analysis to the dynamic buckling load λD for structures characterized by the same imperfection ξ. For example, for a 104
From static analysis to dynamic analysis
Dynamic buckling estimate
Static Koiter analysis
1
1 λ
perfect structure
S
0.8
0.9 imperfect structure
λ/λ
C
λD/λS
0.6
0.4
0.7
0.2
0
0.8
0.6
0
0.2
0.4
ξ
0.6
0.8
1
0.5
0
0.2
0.4
λ /λ S
0.6
0.8
1
C
Figure 4.1: From λS to λD : dynamic buckling estimate - quadratic structure
cubic structure, i.e structures characterized by aS = 0, bS < 0 and a step load, this relation is found to be �
1 − (λD /λS ) (λS /λC ) 1 − (λS /λC )
� 32 =
√ λD 2 λS
(4.5)
whereas for a quadratic structure (aS ξ < 0) this relation is �
1 − (λD /λS ) (λS /λC ) 1 − (λS /λC )
�2 =
4 λD 3 λS
(4.6)
The concept is illustrated in figure 4.1 for the quadratic structure case. An imperfection level ξ causes the structure to reach a limit load λS which is a fraction of the theoretical buckling load λC . Once the static limit load has been found, a dynamic buckling estimate λD can be calculated through (4.5). The important feature of this approach is that no integration in time of the dynamic nonlinear equation is required but the dynamic buckling estimate is found through an analytical formula. An example is here considered. Equation (4.3) is integrated in time for the case of the Roorda’s frame presented in 2.6.1. The density of the material is 7800 Kg/m3 . The structure has been discretized with 20 elements per member. An imperfection in the shape of the first buckling load to cause the junction between the two members to rotate 0.01 radians is applied. The maximum displacement resulting from the 105
Chapter 4
integration in time of (4.3) for the case of a step load of increasing magnitudes has been monitored. The results are compared with full dynamic nonlinear analysis carried out with the commercial finite element program ABAQUS. The comparison is shown in figure 4.2. It can be seen that (4.3) is able to accurately predict the dynamic buckling load for a step load case. In the next section, the ability of the presented framework to approximate the transient dynamic response is investigated.
maximum corner rotation, rad
reduced ABAQUS 1 0.8 0.6 0.4 0.2 0 0.5
0.6
0.7 0.8 load factor λ
0.9
1
Figure 4.2: Roorda frame: maximum dynamic response under step load. Comparison with full nonlinear analysis. The single reduced equation (4.3) is able to capture the dynamic instability under step load.
4.3
Transient response
The extension of the single mode static Koiter’s analysis to the dynamic buckling case furnishes a very compact estimate of the dynamic buckling load. We are here interested in the ability of this reduced equation to accurately reproduce the transient response of a structure under a more general load history. We investigate this matter through the same example of the Roorda’s frame. Equation (4.3) has been integrated in time with an applied dynamic load of the form
f (t) = 106
1 (1 + sin ωt) 2
(4.7)
From static analysis to dynamic analysis
The frequency ω is scaled to the frequency of the buckling mode omegab defined by (4.4). The comparison with full nonlinear dynamic analysis performed with ABAQUS is shown in figure 4.3. The rotation of the corner at which the load is applied is monitored. −3
20
x 10
0.05
0.14 Reduced ABAQUS
0.12
0.04
10
5
0
10
20 time, s
30
0.03 0.02 0.01 Reduced ABAQUS
−0.01 0
40
(a) λ = 0.2λC , ω = 0.1ωb
0.06
0.02
0.05
0.06 0.04
0 10
20 time, s
30
−0.02 0
40
(b) λ = 0.4λC , ω = 0.1ωb
0.025
0.08
0.02
0
Reduced ABAQUS −5 0
corner rotation, rad
0.1 corner rotation, rad
corner rotation, rad
15
10
20 time, s
30
40
(c) λ = 0.6λC , ω = 0.1ωb 0.15
0.1 corner rotation, rad
corner rotation, rad
0.01 0.005 0
corner rotation, rad
0.04
0.015
0.03 0.02 0.01
0.05
0
0 −0.05
−0.005 −0.01 0
−0.01
Reduced ABAQUS 10
20 time, s
30
−0.02 0
40
(d) λ = 0.2λC , ω = 0.3ωb
10
20 time, s
30
Reduced ABAQUS −0.1 0
40
(e) λ = 0.4λC , ω = 0.3ωb
0.1 0.08
Reduced ABAQUS
20 time, s
30
40
(f) λ = 0.6λC , ω = 0.3ωb
0.15 Reduced ABAQUS
10
0.15
0.1
0.1
0.05
0.05
0.04 0.02 0 −0.02
corner rotation, rad
corner rotation, rad
corner rotation, rad
0.06
0 −0.05 −0.1
0 −0.05 −0.1
−0.04 −0.15
−0.06 −0.08 0
10
20 time, s
30
(g) λ = 0.2λC , ω = 1.0ωb
40
−0.2 0
−0.15
Reduced ABAQUS 10
20 time, s
30
(h) λ = 0.4λC , ω = 1.0ωb
40
−0.2 0
Reduced ABAQUS 10
20 time, s
30
40
(i) λ = 0.6λC , ω = 1.0ωb
Figure 4.3: Roorda’s frame: transient analysis comparisons. The solutions of the reduced equation show a shorter period with repsect to the full model nonlinear analysis. The results generally show a fair agreement with the full nonlinear analysis solution. A delay of the ABAQUS solution with respect of the reduced solution can be noticed. This is probably due to the slight discrepancy between the first vibration frequency of the structure ωv = 0.73 rad/s and the Rayleigh quotient associated to the first 107
Chapter 4
buckling mode ωb = 0.82 rad/s. A comparison of the two modes is shown in figure 4.4. It can be noticed that the two modes, although similar, differ in the relative bending of the horizontal member.
vibration mode, ω =0.73915 rad/sec v
buckling mode, ω =0.82044 rad/sec b
Figure 4.4: Roorda’s frame: first vibration and buckling mode. The slightly different mode shape results in a different value of the associated frequency. In the resonant case ω = ωb the discrepancy is more evident also in terms of amplitudes, since the frequency of the excitation is closer to the“frequency” of the reduced model than to the one of the full model. This inaccuracy of the period of the response seems to be slightly more pronounced for relatively low load levels. For this situation, we can argue that the dynamics of the structure is dominated by the vibration mode of the unloaded structure rather than the buckling mode. For higher load level, the buckling modes seem to be a more appropriate basis. This reasoning intuitively leads to an improvement of the inertial term. The idea is to make the inertial term to“adapt” to the load level thus yielding the correct frequency content in all the cases. We can assume a dependency of the inertial coefficient ω12 on λf (t) in the following fashion 1 (λf (t)) = ω2
� � 1 λ λ 1 1− f (t) + f (t) 2 λC ωv2 λC ωb
(4.8)
The same load cases were run with the suggested improvement of the inertial term. The period discrepancy is drastically reduced. The results are collected in figure 4.5. A single degree of freedom equation as (4.3) is of course not able to accurately approximate the dynamic response of a structure when the dynamic load excites more that one mode. The presented example furnishes anyway guidelines for a more general reduction technique to handle cases in which the dynamic load can cause the structure to approach a dynamic buckling situation. They main fact to 108
From static analysis to dynamic analysis −3
20
x 10
0.05
0.14 Reduced ABAQUS
0.12
0.04
10
5
0
10
20 time, s
30
0.03 0.02 0.01 Reduced ABAQUS
−0.01 0
40
(a) λ = 0.2λC , ω = 0.1ωb
0.06
0.02
0.05
0.06 0.04
0 10
20 time, s
30
−0.02 0
40
(b) λ = 0.4λC , ω = 0.1ωb
0.025
0.08
0.02
0
Reduced ABAQUS −5 0
corner rotation, rad
0.1 corner rotation, rad
corner rotation, rad
15
10
20 time, s
30
40
(c) λ = 0.6λC , ω = 0.1ωb 0.15
0.1 corner rotation, rad
corner rotation, rad
0.01 0.005 0
−0.01 0
0.03 0.02 0.01 Reduced ABAQUS
0
−0.005
20 time, s
30
−0.02 0
40
20 time, s
30
(e) λ = 0.4λC , ω = 0.3ωb
0.06
0.1
−0.1 0
40
10
20 time, s
30
40
(f) λ = 0.6λC , ω = 0.3ωb 0.15 0.1
0.04 0.02 0 −0.02
corner rotation, rad
corner rotation, rad
0.05 corner rotation, rad
0
−0.05 Reduced ABAQUS
10
(d) λ = 0.2λC , ω = 0.3ωb
0
−0.05 −0.04 Reduced ABAQUS −0.06 0
0.05
−0.01
Reduced ABAQUS 10
corner rotation, rad
0.04
0.015
10
30
(g) λ = 0.2λC , ω = 1.0ωb
40
−0.1 0
10
20 time, s
30
(h) λ = 0.4λC , ω = 1.0ωb
0 −0.05 −0.1
Reduced ABAQUS
−0.15
Reduced ABAQUS 20 time, s
0.05
40
−0.2 0
10
20 time, s
30
40
(i) λ = 0.6λC , ω = 1.0ωb
Figure 4.5: Roorda’s frame: transient analysis comparisons - load dependent inertial forces. The adapted inertial term (4.8) is able to sustantially reduce the inaccuracy of the period of oscillation.
be underlined here is the dependence of the frequency on the applied load level. The interpolation of the frequency through the load level has greatly improved the accuracy of the response for various load cases. More generally, a good reduction strategy has to account for the dependency of the vibration modes on the load level. The features highlighted by the presented example are more generally exploited in the next chapter where a general reduction method is presented and discussed.
109
Chapter 4
110
Chapter 5
Modal reduction for nonlinear transient analysis 5.1
Introduction
The projection of the dynamic equations on a subset of vibration modes is a successful technique that is widely used in linear dynamic analysis. Vibration modes have two main advantages. First, their selection for the proper reduction basis is based on simple criteria that involve the comparison of the frequency content of the excitation and the eigenspectrum and the examination of the shape of the modes and the applied load. Second, the projection of the linear system on the vibration modes decouples the equations. The classical technique of modal reduction has received attention for extension in nonlinear analysis. In principle, few vibration modes can be extracted at a certain dynamic equilibrium state and used to project the dynamic set of equations to reduce the number of degrees of freedom. This approach bears the drawback of recomputing the modal basis too frequently during the analysis to preserve accuracy, and the effectiveness of the method is often lost. Past contributions [37, 38] have outlined the potentials of including modal derivatives to enrich the modal basis and avoid expensive recomputing of the modal basis. Although promising and relatively easy to be implemented, these methods are not incorporated into present commercial finite element programs. The commercial finite element program ABAQUS, for 111
Chapter 5
example, offers a module for nonlinear reduction. The nonlinear internal force vector is computed using the approximation of the displacements given by a basis formed by some vibration modes. However, it is not possible to calculate and include higher order fields based on a perturbation technique. A perturbation method for the nonlinear free vibration of general structures has been presented in chapter 3. The aim of the approach was to calculate the curvature of the frequency-amplitude relation relative to a certain vibration mode. The main effect of the nonlinearity was captured by the second order mode stemming from the expansion of the displacement field. In this chapter, we present a reduction technique for nonlinear transient analysis based on the utilization of second order fields to augment the reduction basis formed by a selection of vibration modes. The second order fields are therefore additional generalized coordinates for the reduced system of equations. When the degree of geometrical nonlinearity becomes severe, the proposed reduction basis might not be sufficient for an accurate solution. Typical situations are structures that undergo dynamic buckling. This behavior is usually characterized by a marked change in the deformation pattern that cannot be captured by a basis calculated at the undeformed state. A simple and effective way to tackle these problems is to form the reduction basis made of vibration modes and second order modes at two different load levels, typically at the initial configuration and at the buckling load level. In this chapter, we will demonstrate the simplicity and the effectiveness of this approach through some representative examples.
5.2
The reduced set of equations
A finite element spatial discretization of a given structure leads to a discrete system of N nonlinear dynamic equilibrium equations:
M¨ u + G(u) = F(u, t)
(5.1)
where M is the mass matrix, G(u) is the displacement-dependent internal force vector, u is the N × 1 generalized displacement vector and F is the external force vector. The“dot” operator represents differentiation with respect to time, i.e. ( ˙ ) = d/dt. F can in principle depend on the displacement vector u. The internal force G 112
Modal reduction for nonlinear transient analysis
can include both geometrical and material nonlinearities. We limit ourselves here to geometric nonlinearities and to external forces that are only time-dependent. The displacement field can be approximated by a combination of linearly independent mode shapes:
u(t) = Ψq(t)
(5.2)
where q is a vector of R generalized time dependent modal coordinates where R � N and Ψ is the N × R reduction matrix. The original set of equations (5.1) can be now projected on the reduction basis Ψ to obtain a reduced system of R equations in time. By substituting equation (5.2) into (5.1) and pre-multiplying by ΨT , we obtain
q + ΨT G(Ψq) = ΨT F(Ψq, t) ΨT MΨ¨
(5.3)
or, in a more compact form: ! q + G(Ψq) " " M¨ = F(Ψq, t)
(5.4)
! = ΨT MΨ, G " = ΨT G, F " = ΨT F M
(5.5)
where
The time dependence of q has been dropped for clarity. The reduction matrix Ψ has been assumed as constant in time. We address the implication of a time dependent reduction matrix in the next section.
5.3
A load dependence of the projection basis
In nonlinear dynamic analysis, the eigenspectrum of the structure changes with respect to time, since the vibration modes depend on the equilibrium configuration. 113
Chapter 5
In general, the projection (5.2) of the N × 1 displacement vector u(t) can be written with an explicit time depencence
u(t) = Ψ(t)q(t)
(5.6)
The columns of the N × R matrix Ψ(t), where R � N, are the selected time dependent base vectors on which the total displacement vector is projected. The new unknowns of the system are then R components of the time dependent vector q(t). We derive here the governing reduced dynamic equations in the case of a general time dipencence of the reduction basis. To derive the equations of motion for the reduced system, we make use of the Lagrangian equations. In order to do that, we define the kinetic energy of the full system as
T =
1 T u˙ Mu˙ 2
(5.7)
The internal energy U of the system is generally indicated as
U = U (u)
(5.8)
while the potential V of the external load is written as:
V = λuT F
(5.9)
where λ is a time dependent load multiplier and F is the vector of the generalized external forces. By substituting equation 5.6 into 5.7, the kinetic energy assumes the form
T =
1 T T ˙ T MΨq ˙ + 1 qT Ψ ˙ q˙ Ψ MΨq˙ + q˙ T ΨT MΨq 2 2
(5.10)
while the internal energy is simply
U = U (Ψq) 114
(5.11)
Modal reduction for nonlinear transient analysis
and the external load contribution is expressed as
V = λqT ΨT F
(5.12)
The kinetic energy is now a function not only of modal velocities q˙ but also of modal displacements q. The Lagrange equations are written as, excluding damping effects d ∂T ∂T ∂U ∂V − + = dt ∂ q˙ ∂q ∂q ∂q
(5.13)
By substituting the reduced form 5.10, 5.11, and 5.12 in the Lagrange equations 5.13, we obtain the following first order nonlinear ordinary system of 2R equations in time ⎧ ⎪ ⎪ ⎨ p˙ = ⎪ ⎪ ⎩ q˙
=
˙ T MΨq˙ + Ψ ˙ T MΨq ˙ + ΨT ∂U − λΨT F Ψ ∂u � �
T �−1 ˙ Ψ MΨ p − ΨT MΨq
(5.14)
where p is defined as ∂T ˙ = p = ΨT MΨq˙ + ΨT MΨq ∂ q˙
(5.15)
The contribution of the internal energy is obtained via the chain rule, as follows
∂U = ∂q
�
∂u ∂q
�T
∂U ∂U = ΨT ∂u ∂u
(5.16)
This contribution can be interpreted as the projection of the internal force vector ∂U on the reduction basis ΨT . ∂q ˙ = 0) If the reduction basis is constant, then the time dependence is dropped (Ψ and the reduced system of equations becomes the more familiar second order system 115
Chapter 5
in time presented in section 5.2. The next question to address is how to form the reduction matrix Ψ and how to approximate its time dependence. In the next sections we outline the perturbation method used to generate vibration modes and second order fields, both for single mode and multimode cases. Then a proper selection of the reduction basis is discussed.
5.4
The perturbation method
The perturbation methods presented in chapter 2 and 3 are here generalized to study the nonlinear vibrations of a structure subjected to a static pre-load. This section presents the derivation for single mode analysis. The extension to the multi-mode case is outlined in the next section. We use in our exposition the notation introduced by Budiansky [14]. The general kinematic relation is assumed to be quadratic, as 1 ε = L1 (u) + L2 (u) 2
(5.17)
where L1 (u) and L2 (u) are linear and quadratic operators respectively and u is the generalized displacement field. We define the bilinear operator L11 (u, v) as follows
L2 (u + v) = L2 (u) + L11 (u, v) + L2 (v) An admissible strain variation becomes:
δε = L1 (δu) + L11 (u, δu) = δe + L11 (u, δu)
(5.18)
where the notation e = L1 (u) has been introduced. We write the constitutive equation for a linear elastic material as
σ = H(εε)
(5.19)
The variational equilibrium equation, including inertial and pre-load effects, writes: 116
Modal reduction for nonlinear transient analysis
σ · δεε = λq0 · δu − M (¨ u) · δu
(5.20)
where M (u) is the linear inertial operator and the dots indicate the scalar product between two vectorial quantities, integrated over the domain of the entire structure. The strains ε(u) and stresses σ(u) have to be intended as general vectorial quantities. The field u that the structure attains after the application of the static pre-load q = λq0 is considered linear, namely: u = λu0 ε = λεε 0 σ0 σ = λσ
(5.21)
We assume a periodic motion of unknown frequency ω, and by assuming a new time variable τ = ωt, the equation of motion is integrated over the period and becomes: � 0
2π
σ · δεε + M (¨ [σ u) · δu − λq0 · δu]dτ = 0
(5.22)
The vibration mode u1 is found by assuming u = λu0 + ξu1 ε = λεε0 + ξεε1 σ 0 + ξσ σ1 σ = λσ
(5.23)
By substituting the above linear expansion into the equilibrium equation for the loaded structure, eq. 5.20 the following eigenvalue problem is found: � 0
2π
σ 0 · L11 (u1 , δu) + ηλσ σ 1 · L11 (u0 , δu) + σ 1 · δe]dτ = 0 (5.24) [−ω02 M (¨ u1 ) · δu + λσ
where η assumes the value of 0 or 1 whether the contribution of the pre-load rotations is considered or not, as discussed in 2.2.5. By letting δu = u1 , the expression for the natural frequency ω0 is given by: 117
Chapter 5
ω02
2π =
0
σ 0 · L2 (u1 ) + ηλσ σ 1 · L11 (u0 , u1 ) + σ1 · e1 ]dτ [λσ 2π ˙ ˙ 0 M (u1 ) · u1 dτ
(5.25)
To find how the vibration mode u1 changes because of finite deflection amplitudes, we extend the expansion of the displacement field to the second order:
u = ε = σ =
λu0 + ξu1 + ξ 2 u2 + · · · λεε0 + ξεε1 + ξ 2ε 2 + · · · σ 0 + ξσ σ 1 + ξ 2σ 2 + · · · λσ
(5.26)
where
1 ε 2 = L1 (u2 ) + L2 (u1 ) 2
(5.27)
σ 2 = H(εε2 )
(5.28)
and
In order to make the expansion unique, the higher order field u2 , u3 ,. . . is orthogonalized through u1 with respect to the inertial operator:
u1 ) · uk = 0 M (u˙ 1 ) · u˙ k = M (¨
, k �= 1
(5.29)
By substituting the expansion 5.26 in the equilibrium equation 5.22 and letting δu be orthogonal to u1 in the sense of equation 5.29, the second order field u2 is obtained from the solution of the linear problem
σ 2 · δe + λσ σ 0 · L11 (u2 , δu) + ηλσ σ 2 · L11 (u0 , δu) +σ σ 1 · L11 (u1 , δu) = 0 u2 ) · δu +σ −ω 2 M (¨ (5.30) 118
Modal reduction for nonlinear transient analysis
It can be noticed that, by setting ω = 0 and letting λ as unknown, the presented procedure leads to the determination of the buckling load and mode and the associated second order displacement field. In general the buckling modes are nothing else but vibration modes with a zero frequency associated to it. The described procedure is so far equivalent to the one presented in chapter 3 for the determination of the frequency-amplitude relation. The second order fields are in that case ”ingredients” for the determination of the amplitude-frequency curvature coefficient bD . We are now interested in considering these modes as independent modes to enrich the basis constituted by vibration modes only. It has been shown in section 5.4 how the second order field associated to a vibration mode is actually constituted by two parts: a constant in time contribution and a double-harmonic contribution. This splitting is essential for the correct calculation of the bD coefficient. However, these second order modes are spatially very similar and qualitatively reproduce the same effect. This observation leads to some possible simplifications if one is interested in suitable fields to form a reduction basis. Moreover, another observation can be made. For slender structures, the vibration modes have mainly out-of-plane bending contribution. The non-linear bending-stretching coupling is reflected in the second order fields, that are mainly constituted by in-plane deformations. The inertia associated to in-plane modes is much higher that the inertia of out-of-plane-modes. The problem 5.30 can thus be simplified by neglecting the inertia terms. we can rewrite it as:
σ 0 · L11 (u2 , δu) + ηλσ σ 2 · L11 (u0 , δu) + σ 1 · L11 (u1 , δu) = 0 σ 2 · δe + λσ
(5.31)
This simplification has two main advantages when the implementation in a finite element framework is of concern. First, the matrix of coefficients for the calculation of the second order fields is constituted by the tangent stiffness matrix only and thus it is factorized once for all for all the considered vibration modes. Second, the omission of the mass matrix avoids possible singularities in case the double harmonic 2ω is an eigenfrequency of the structure. 119
Chapter 5
5.5
Multimode analysis
The procedure described in the previous section can be generalized to consider also the interaction between modes. In a similar fashion, the case of clustered buckling modes in a post-buckling asymptotic analysis requires a multi-mode approach. The displacement expansion is written as follows
u =
λu0 + ξi u1i + ξi ξj u2ij + · · ·
(5.32)
where u2ij can be considered as second order displacement fields that take into account the interaction of vibration modes u1i and u1j . A symmetry with respect to indeces holds, i.e. u2ij = u2ji . The second order fields u2ij are found by solving the linear problem
1 σ 2ij · L11 (u0 , δu) + σ 2ij · δe = − [σ σ 1 · L11 (u1j , δu) λσ0 · L11 (u2ij , δu) + ηλσ 2 i + σ 1j · L11 (u1i , δu)] (5.33) where the orthogonality condition is:
M (ui ) · ujk = M (ui ) · u2jk = 0 , ∀i, j, k
(5.34)
In line of the reasoning discussed in the previous section, the inertial term is neglected in the second order problem 5.33.
5.6
Finite element implementation
The finite implementation of the described procedure is analogous to the one presented in the previous chapter. We indicate with q a generalized displacement vector. The vibration modes q1i are obtained by solving the eigenvalue problem 120
Modal reduction for nonlinear transient analysis
2 � −ωi M + K0 − λKG q1i = 0
(5.35)
while the second order modes stem from the solution of the linear problems [K0 − λKG ] q2ij = g(q1i , q1j )
(5.36)
together with the orthogonality condition qT1i Mq2jk = 0
(5.37)
where the second order problem (5.36) has been simplified as discussed in the previous section.
5.7
Selection of the reduction basis
The most popular reduction technique in linear analysis is the projection of the dynamic equations on a carefully chosen subset of vibration modes. The selection of the proper basis considers two aspects, namely 1. a comparison of the frequency content of the applied load with the frequency of the selected vibration modes, 2. the spatial representation of the applied load in terms of the retained vibration modes. In other words, the work done by the applied load on the retained modes should not be negligible. The modal vibration reduction leads to diagonal reduced mass and stiffness matrices that decouple the equations of motion. As discussed in the previous chapter, the geometrical nonlinearities lead to a dependence of the frequency of vibration on the amplitude of the vibration mode. When the nonlinear equations of motion are projected onto a basis formed with vibration modes only, the geometrical nonlinear effects are not correctly reproduced. We will show this phenomenon through some examples in the next section. 121
Chapter 5
The second order fields stemming from the perturbation technique presented in section 5.4 represent the main effect of the geometrical nonlinearity when the structure deforms as a vibration mode. Their use as independent generalized coordinates to enrich the basis formed by vibration modes is therefore promising in order to capture the nonlinearity in a reduced setting. We will show through some examples that this approach greatly improves the accuracy of the reduced solution. In other words, a basis formed by vibration modes that ensure the desired accuracy for the linear dynamic problem constitute a starting point for the calculation of the corresponding second order fields. Once the second order fields are calculated, the complete basis is formed and used to project the dynamic equations. The entire procedure is here summarized.
1. Extract few vibration modes 2. Select an optimal basis q1 of vibration modes that guarantees sufficient accuracy for the linear dynamic problem 3. Extract the base q2 of second order fields corresponding to the retained vibration mode basis q1 4. Form the reduction basis Ψ = [q1 q2 ] 5. Project the full system on equations on Ψ 6. Integrate the reduced system in time
In some cases the structure is characterized by a marked change in the deformation pattern in the static response. Typical examples involve buckling or a limit point behavior. If the load is applied dynamically with a magnitude high enough to trigger such effects, a reduction basis formed by using vibration modes and second order fields calculated at the rest configuration might not be sufficient to capture the behavior. This is due to the fact that the vibration modes change with respect to the different equilibrium configurations, and so do second order fields. One approach would be to recompute the basis as the time integration proceeds. Some sort of error measure can be monitored and the basis can be recomputed if an error tolerance is not met anymore. This approach, though effective, can result in a very expensive procedure that eventually loses the benefit of the reduction in terms of reduced computational time. We propose a different technique. 122
Modal reduction for nonlinear transient analysis
The system of dynamic equations can be effectively reduced by computing the reduction basis (vibration modes and corresponding second order fields) at the equilibrium configurations of two different load levels. This method is particularly effective for problems characterized by loads that can lead to a buckled state of the structure. It will be shown in the following examples that a natural choice of the two configurations at which the basis is computed is the rest configuration and the equilibrium configuration at the load level corresponding to the buckling load of the structure. It can be easily shown that the buckling modes are vibration modes characterized by a zero frequency. The reduction basis is in this case formed by vibration modes and second order fields at the static equilibrium configuration corresponding to two different load levels. It can be indicated as
L Ψ = [q1 q2 qL 1 q2 ]
where the superscript L refers to a generic loaded configuration. The second order fields are orthogonal with respect to the vibration modes by definition. However, when the reduction basis is formed with vectors calculated at two different configurations, the orthogonality of the whole basis in no more guaranteed. Numerical problems might occur in the time integration of the reduced system if the reduction basis contains almost parallel vectors. In this case, the formed basis can be anyway orthogonalized by projecting the eigenvalue problem on the reduced basis ΨN ×R and solving the resulting R × R reduced order eigenvalue problem.
� ΨT R×N −ω 2 M + K0 − λKG N ×N ΨN ×R yR×R = 0
(5.38)
The obtained matrix yR×R is a transformation matrix that acts on the reduction ˜ N ×R can be formed by simply : basis Ψ. A new basis Ψ ˜ = Ψy Ψ
(5.39)
This procedure avoids bad conditioning when reduction basis is formed by contributions at two different load levels. In simple cases, the smoothness of the vibration modes with respect to the load level allows an approximation of their time dependency. It will be shown through an example that the time dependency of the vibration modes can be effectively approximated with a linear interpolation directly through the load level. This approach 123
Chapter 5
will further reduce the number of degrees of freedom and it will be illustrated in the last section of this chapter.
5.8
Numerical examples
Some practical examples are here presented. The proposed method to calculate vibration modes and second order fields has been implemented into finite element following the same lines discussed in the previous chapters. A lumped mass matrix formulation according to the HRZ procedure [25] is used. The dynamic equilibrium equations are integrated in time using an explicit scheme based on the central difference approximation. A fixed time step is used through the whole time integration.
5.8.1
Flat plate with central bending loading
A flat square plate is here considered. The three components of the edges of the plate are constrained. The plate is made of isotropic elastic material with the following properties: E = 70000 N/mm2 , ν = 0.33, ρ = 2700 · 10−9 Kg/mm3 . The thickness of the plate is 1 mm and the sides are 100 mm long. The plate is loaded with a concentrated force applied in the center of the plate normal to the surface. The structure is discretized with 840 elements and 2772 degrees of freedom. The hardening behavior of the nonlinear static response of the center node is obtained with a path-following analysis using the normal flow algorithm presented by Ragon [60]. The result is depicted in figure 5.1. The applied load is then imposed dynamically with a sinusoidal load in the form F = λ/2 · (1 + sin ωt) where λ = 80 N and ω = 0.8 · ω1 = 75.8 rad/sec. symmetry reasons, only vibration modes 1, 5 and 6 are considered in the reduction basis. This set of vibration modes are sufficient for an accurate reduced solution of the linear problem. This retained set of vibration modes generates 6 second order fields. The retained vibration modes and the corresponding second order modes are shown in figures 5.2 and 5.3. Due of the simple geometry of the structure, the vibration modes only involve transversal displacements. The bending-stretching coupling of the nonlinear kine124
Modal reduction for nonlinear transient analysis
250
200
load, N
150
100
50
0 0
0.2
0.4
0.6
0.8
1
1.2
1.4
1.6
displacement, mm
Figure 5.1: Square plate: static response
(a) q11 , ω1 = 94.7 rad/sec
(b) q15 , ω5 = 473.6 rad/sec
(c) q16 , ω6 = 473.6 rad/sec
Figure 5.2: Square plate: vibration modes
125
Chapter 5
(a) q211
(b) q255
(c) q266
(d) q215
(e) q216
(f) q256
Figure 5.3: Square plate: second order modes
matic relation appears in the second order modes which contain only in-plane displacements. In other words, the second order modes allow the plate to ”stretch” to accommodate for the bending action of the vibration modes. Figure 5.4 shows the comparison between the dynamic response of the full system and some reduced solution obtained with different choices of the reduction basis, namely: 1. vibration modes only: �
Ψ = q11 q15 q16 2. vibration modes and second order fields neglecting interaction terms:
� Ψ = q11 q15 q16 q211 q255 q266 3. vibration modes and all second order fields:
� Ψ = q11 q15 q16 q211 q255 q266 q215 q216 q256 It is evident that the inclusion of the second order fields greatly improves the accuracy of the solution. The inclusion of the interaction second terms, however, do 126
Modal reduction for nonlinear transient analysis
2
0
−1
−2
−3
100 load, N
displacement, mm
1
Ψ = [q q (i,i)] , i = 1:3 1
0
−4 0
Full Ψ = [q1]
50
0
0.1 0.2 time, sec
0.05
0.1
2
Ψ = [q q ]
0.3
1
0.15
0.2
2
0.25
0.3
time, sec
Figure 5.4: Square plate: dynamic response
not add any useful information to the reduction basis. We shall see in the following examples that the interaction terms are important for an accurate reproduction of the solution for more complicated geometries.
5.9
Curved panel with central loading
We consider here a cylindrical panel supported at its straight edges. The panel is loaded in the center with a concentrated force acting normal to the surface and toward the center of the panel. For symmetry reasons, only a quarter of the structure is modeled. The geometric and material properties are reported in figure 5.5.
The structure is discretized with 200 triangular elements and 726 degrees of freedom. Figure 5.6 shows the nonlinear static response of the center node of the panel. The initial softening behavior is followed by an hardening curve until the load reaches its limit value, around 560 N. 127
Chapter 5
L = 100 mm R = 100 mm θ = π/6 t = 1 mm
E = 70000 N/mm2 ν = 0.33 ρ = 2700 10-9 Kg/mm3 L u=v=w=0
u=v=w=0 z, w
θ
R
y, v x, u
Figure 5.5: Curved panel
600
500
load, N
400
300
200
100
0 −12
−10
−8
−6
−4
−2
displacement, mm
Figure 5.6: Curved panel: nonlinear static response
As in the previous example, we apply a dynamic periodic load in the form
F = 128
λ · (1 + sin ωt) 2
0
Modal reduction for nonlinear transient analysis
where ω = 0.8 · ω1 = 294 rad/sec and λ is the actual load magnitude. Vibration modes are extracted at the initial equilibrium configuration. The first 15 vibration modes are sufficient for a reasonable accuracy of the linear problem. They are shown in figure 5.7. This reduced set q1 generates a second order set q2 of 120 vectors. A stable time step of ∆t = 1 × 10⁻⁵ is used for all the time integrations. The full nonlinear solution is compared with the reduced solution obtained with three different basis, namely 1. first 15 vibration modes: Ψ = [q1(15) ] 2. first 135 vibration modes: Ψ = [q1(135) ] 3. first 15 vibration modes and corresponding 120 second order modes: Ψ = [q1(15) q2(120) ] The results are shown in figures from 5.8 to 5.13 for increasing values of λ. It is clear that the reduction basis formed with the vibration modes only does not capture the correct behavior, even with many modes included (135). The basis containing the first vibration modes and all the corresponding second order fields yields an accurate solution even at a load level causing the structure to snap, see figure 5.13. The computational time required for the analysis is reported in table 5.1. A moderate time saving of about 25% is achieved. However, it must be noted that all the time integrations have been carried out using the same time step of ∆t = 1 × 10⁻⁵ . This value was close to the critical time step for the full nonlinear analysis, but a bigger value can be used for the reduced analysis. This is due to the fact that the highest frequency contanined in the reduced basis is smaller that the highstet frequency of the complete model. No thorough investigation has been done, but some tests revealed a critical time step for the reduced solution about four times larger than the one employed for the full analysis. The resulting computational time of the reduced system can be therefore divided by the same factor. Full 1448.8
Ψ = [q1(15) ] 496.7
Ψ = [q1(135) ] 1073.9
Ψ = [q1(15) q2(120) ] 1084.5
Table 5.1: Curved panel: comparison of computational times (sec) An attempt on the selection of the most important second order fields out of the complete basis is carried out. Different choices have been made and applied to the case of periodic load with an amplitude of 154 N. The notation 129
Chapter 5
(a) q11 , ω = 367.7 rad/sec
(b) q12 , ω = 801.5 rad/sec
(c) q13 , ω = 1062.3 rad/sec
(d) q14 , ω = 1267.2rad/sec
(e) q15 , ω = 1509.7rad/sec
(f) q16 , ω = 1565.1 rad/sec
(g) q17 , ω = 1608.3 rad/sec
(h) q18 , ω = 1672.5 rad/sec
(i) q19 , ω = 1933.9 rad/sec
(j) q110 , ω = 2139.0 rad/sec
(k) q111 , ω = 1178.8 rad/sec
(l) q112 , ω = 2280.3 rad/sec
(m) q113 , ω = 2341.1 rad/sec
(n) q114 , ω = 2775.6 rad/sec
(o) q115 , ω = 2872.5 rad/sec
Figure 5.7: Curved panel: retained vibration modes
130
Modal reduction for nonlinear transient analysis
2
0
displacement, mm
−2
−4
−6
1000
load, N
−8
Full Ψ = [q1(15)]
500
Ψ = [q1(135)]
−10 0
−12 0
0
0.01
0.02
0.04 time, sec
0.02
0.06
Ψ = [q
0.03
q
1(15)
0.08
0.04
0.05
0.06
]
2(120)
0.07
0.08
time,sec
Figure 5.8: Curved panel: dynamic response, periodic load, λ = 309 N
2
0
displacement, mm
−2
−4
−6
1000
load, N
−8
Full Ψ = [q1(15)]
500
Ψ = [q
−10
−12 0
]
1(135)
0
0.01
0
0.02
0.04 time, sec
0.02
0.06
0.03
Ψ = [q1(15) q2(120)]
0.08
0.04
0.05
0.06
0.07
0.08
time,sec
Figure 5.9: Curved panel: dynamic response, periodic load, λ = 412 N
131
Chapter 5
2
0
displacement, mm
−2
−4
−6
−8 1000
Full Ψ = [q1(15)]
load, N
−10 500
Ψ = [q1(135)]
−12 0
−14 0
0
0.01
0.02
0.04 time, sec
0.02
0.06
Ψ = [q
1(15)
0.08
0.03
0.04
0.05
0.06
q
]
2(120)
0.07
0.08
time,sec
Figure 5.10: Curved panel: dynamic response, periodic load, λ = 515 N
2 0
displacement, mm
−2 −4 −6 −8 −10
−14 −16 0
load, N
1000
−12
Full Ψ = [q1(15)]
500
Ψ = [q1(135)] 0
0.01
0
0.02
0.04 time, sec
0.02
0.06
Ψ = [q
0.08
0.03
1(15)
0.04
0.05
q
]
2(120)
0.06
0.07
0.08
time,sec
Figure 5.11: Curved panel: dynamic response, periodic load, λ = 618 N
132
Modal reduction for nonlinear transient analysis
2 0 −2
displacement, mm
−4 −6 −8 −10 −12 Full Ψ = [q1(15)]
1000 load, N
−14
500
−16 −18 0
0
0.01
Ψ = [q1(135)] 0
0.02
0.04 0.06 time, sec
0.02
Ψ = [q
1(15)
0.08
0.03
0.04
0.05
0.06
q
]
2(120)
0.07
0.08
time, sec
Figure 5.12: Curved panel: dynamic response, periodic load, λ = 721 N
5
0
displacement, mm
−5
−10
−15
−20 Full Ψ = [q1(15)]
1000
load, N
−25
Ψ = [q1(135)]
500
Ψ = [q1(15) q2(120)]
−30 0
−35 0
0.01
0
0.02
0.04 time, sec
0.02
0.06
0.08
0.03
0.04
0.05
0.06
0.07
0.08
time, sec
Figure 5.13: Curved panel: dynamic response, periodic load, λ = 824 N
133
Chapter 5
2 1
−2 −3 −4 200
−5
load, N
displacement, mm
0 −1
Full Ψ = [q q (1:2,1:2)]
100
1
−6 0
2
Ψ = [q q (1:3,1:3)] 0
0.02 0.04 time, sec
−7
1
0.06
2
Ψ = [q q (1:4,1:4)] 1
2
Ψ = [q q (i,i)], i = 1:15 −8 0
1
0.005
0.01
0.015
0.02
0.025
0.03
0.035
2
0.04
0.045
0.05
time, sec
Figure 5.14: Curved panel: dynamic response, some comparisons, λ = 154 N. The omission of the interaction terms in the second order fields (thin dashed line) does not lead to a good reduction basis. A second order set formed by all the interaction terms generated by the first few vibration modes does not yield to a good accuracy.
2 1
−2 −3 −4 200
−5
load, N
displacement, mm
0 −1
Full Ψ = [q1 q2(1:2,1:15)]
100
−6
0
0
0.02 0.04 time, sec
Ψ = [q q (1:3,1:15)]
0.06
1
−7
1
−8 0
2
Ψ = [q q (1:4,1:15)] 0.005
0.01
0.015
0.02
0.025
0.03
0.035
2
0.04
0.045
0.05
time,sec
Figure 5.15: Curved panel: dynamic response, some comparisons, λ = 154 N. The second order fields obtained via the interaction of the first vibration modes and all the retained modes provide a good reduction basis.
134
Modal reduction for nonlinear transient analysis
0
−2
−3
800
−4
−5
400
Full Ψ = [q1(15)]
200
Ψ = [q1(135)]
600 load, N
displacement, mm
−1
0
−6 0
Ψ = [q1(15) q2(120)] 0
0.02 0.04 time, sec
0.01
0.06
0.02
0.08
0.03
0.04
0.05
0.06
0.07
0.08
time,sec
Figure 5.16: Curved panel: dynamic response, step load, 154 N
0
−5
−10
800 load, N
displacement, mm
600
−15
400 200 0
0
−20
0.02 0.04 time, sec
0.06
0.08
−25
−30
Full Ψ = [q
]
1(15)
Ψ = [q1(135)] −35
−40 0
Ψ = [q1(15) q2(120)]
0.01
0.02
0.03
0.04
0.05
0.06
0.07
0.08
time,sec
Figure 5.17: Curved panel: dynamic response, periodic load, 618 N
135
Chapter 5
q2 (1 : P ; 1 : M ) indicates the set of second order fields generated by the interaction of the first P vibration modes with the first M ones. The comparisons are shown in figures 5.14 and 5.15. The solution obtained without considering all the interaction second order fields is shown in figure hardly follows the full system solution. The other solutions refer to the second order set formed by taking all the second order fields, including interaction terms, generated by the first 2,3 and 4 vibration modes respectively. This choice criterion does not seem to select the most important second order fields. The results obtained by following another strategy are summarized in figure 5.15. The second order contribution is formed by taking into account the interaction of the first two, three and four vibration modes, with all the 15 retained vibration modes. It can be noticed that the interaction terms between the first modes and the higher modes are fundamental for a correct reproduction of the solution. Another load case is considered. We kept the same load distribution applied with a step function in time at two different load amplitudes, namely 30% ans 120% of the static limit load (154 N and 618 N respectively). The same three reduction basis discussed before are used here. The results are compared with full nonlinear analysis in figure 5.16 and 5.17. It is evident that the basis formed with vibration modes only results in an overly stiff behavior in both cases. For the higher load magnitude the panel does not oscillate but it dynamically snaps. The reduction basis formed with the inclusion of second order fields also, although calculated at the rest configuration, is able to reproduce this behavior.
5.10
Short cantilever beam with tip load
The purpose of the following example is to show the benefit of including vibration modes and second order fields calculated at two different equilibrium configurations. We consider a short cantilever with a C-shaped cross section. The structure with its geometrical and material properties is depicted in figure 5.18. The short cantilever is loaded at one corner of the free end to induce torsion and bending. The structure is discretized with 420 triangular shell elements and 1440 degrees of freedom. First, we perform a linear buckling analysis to have a first indication of possible instabilities of the structure. The first buckling load is found to be λC = 262 N. Subsequently, a nonlinear static analysis is carried out. The structure exhibits a linear behavior until the horizontal flange on the side of the applied load buckles in 136
Modal reduction for nonlinear transient analysis
Clamped
E = 70000 N/mm2 ν = 0.33 ρ = 2700 10-9 Kg/mm3
t
H
L
L = 300 mm H = 152.4 mm W = 50.8 mm t = 1.27 mm
y, v
W
x, u z, w
Figure 5.18: Short C-Channel cantilever
the proximity of the constraint. The load level at which buckling occurs is close to the computed linear buckling load. The subsequent post-buckling path is stable. The three displacement components of the node where the load is applied are depicted in figure 5.19 . The dynamic load is applied as a periodic function F = λ/2·(1+sin ωt), where ω = 1.5 · ω1 = 35.25 rad/sec and λ = 1.5λC . Vibration modes are then calculated at the initial undeformed configuration. We selected the ten vibration modes with the largest participation factor, namely mode 1, 2, 3, 4, 5, 6, 8, 9, 12 and 17. The correctness of the selected basis has been checked with a comparison between a modal linear analysis and a full system linear analysis. All the 55 second order fields associated to the chosen basis are generated. We form then a second set of basis vectors comprising vibration modes and associated second order fields at the buckling load level. The retained vibration modes calculated at the initial configuration and in the proximity of the buckling load are shown in figures 5.20 and 5.21. The asymmetry caused by the static pre-load is evident for the modes calculated at the buckled configuration. The chosen order of vibration modes at the 137
Chapter 5
loaded configuration is kept the same as for the unloaded configuration. 600
500
load, N
400
300
200
u
x
100
uy uz
0 −8
−7
−6
−5
−4
−3
−2
−1
0
displacement, mm
Figure 5.19: Short C-channel cantilever: static response
138
1
(g) uL 12 ω = 20.5 rad/sec
(f) uL 11 ω = 9.5 rad/sec
(h) uL 13 ω = 32.1 rad/sec
(c) u13 ω = 46.5 rad/sec
(i) uL 14 ω = 44.8 rad/sec
(d) u14 ω = 64.3 rad/sec
(j) uL 15 ω = 53.8 rad/sec
(e) u15 ω = 67.1 rad/sec
Figure 5.20: Short C-channel cantilever: first 5 vibration modes
(b) u12 ω = 42.6 rad/sec
(a) u11 ω = 23.5 rad/sec
Modal reduction for nonlinear transient analysis
139
140 (g) uL 18 ω = 81.7 rad/sec
(f) uL 16 ω = 69.0 rad/sec
(h) uL 19 ω = 83.7 rad/sec
(c) u19 ω = 94.1 rad/sec
(i) uL 11 2 ω = 118.6 rad/sec
(d) u11 2 ω = 129.8 rad/sec
(j) uL 11 7 ω = 167.6 rad/sec
(e) u11 7 ω = 169.6 rad/sec
Figure 5.21: Short C-channel cantilever: second 5 vibration modes
(b) u18 ω = 90.2 rad/sec
(a) u16 ω = 72.0 rad/sec
Chapter 5
Modal reduction for nonlinear transient analysis
The results for the transient nonlinear analysis are shown in figure 5.22. The solid thick line is the reference solution of the full system of equations. The dotted thin line represents the solution of the reduced system when only the vibration modes at the two considered equilibrium positions, q1 and qL 1 , are kept to form the reduction basis. This attempt of neglecting the second order fields is performed since the structure exhibits an almost linear response up the the buckling load. However, the reduced solution shows a poor accuracy. The dashed line reproduces the solution obtained by adding the second order fields q2L associated to the vibration modes of the loaded configuration. As expected, we notice a major improvement. The complete set of reduction vectors, including also the second order fields q2 associated to the unloaded vibration modes q1 , yields a very accurate response. The dash-dotted thick line represents this last case. The compu∆t = 2 × 10⁻⁵ has been used for all the cases. A 40% reduction in computational cost is achievable without increasing the time step. However, a preliminary attempts have shown that a three fold increase in the critical time step is possible when the dynamic equations are projected onto the reduced basis.
1
0.5
Full Ψ = [q1 qL1] Ψ = [q qL qL] 1
1
2
Ψ = [q qL q qL]
−0.5
1
1
2
2
−1 400 300 load, N
displacement, mm
0
−1.5
200 100 0
−2
−2.5 0
0.02
0.04
0.06
0.08
0.1
0
0.05
0.12
0.1 0.15 time,sec
0.14
0.2
0.16
0.18
0.2
time,sec
Figure 5.22: Short C-channel cantilever: dynamic response
141
Chapter 5
Full 1009.7
Ψ = [q1 qL 1] 479.3
L Ψ = [q1 qL 1 q2 ] 566.5
L Ψ = [q1 qL 1 q2 q2 ] 599.4
Table 5.2: Short C channel cantilever: comparison of computational times (sec). The time integration has been performed with a stable time step for the full analysis. However, a three fold increase in the critical time step can be achieved in the case of the reduced equations.
5.11
Interpolation of vibration modes
In the previous section we showed the benefits of the inclusion of reduction vectors calculated at two different load levels. In some relatively simple cases, the change of the vibration modes with respect to the load level is relatively smooth and some simplifications can be made. We already showed in chapter 4 how a simple linear interpolation of the inertial term with respect to the applied load magnitude substantially improved the response of a nonlinear single degree of freedom equation derived from Koiter’s analysis. We present here the same example of the Roorda’s frame to show a generalization of that concept. The material and geometric properties are here summarized, and the structure is sketched again in figure 5.23.
Figure 5.23: The Roorda frame. The frame is made of two 100 mm long constant section beams, hinged at the tips. The beam cross section is rectangular, 0.5 mm thick and 1 mm wide. The material is steel, with a Young modulus of 210 GPa and a density of 7800 kg/m3 . The load is applied vertically to the corner to compress the vertical beam. We modeled the structure with 40 beam elements, 20 for each beam. An imperfection in the 142
Modal reduction for nonlinear transient analysis
shape of the first buckling mode is added to the structure so that the intersection of the two members of the frame is rotated counterclockwise by 0.005 radians. The applied imperfection triggers the deformation to grow in the ”unstable” side, i.e. the structure exhibits a limit load. The actual static limit load is lower than the theoretical buckling load, about 91% the first buckling load. The static response of the structure computed with the normal flow algorithm [60] is shown in figure 5.24. The highly nonlinear response is evident. 3
2.5
load, N
2
1.5
1
0.5
0 −1
−0.8
−0.6
−0.4
−0.2
0
bottom corner rotation, rad
Figure 5.24: Roorda frame: Static response As in the previous examples, the dynamic load is applied in the form
F =α
λC (1 + sin(βωb t)) 2
where α is the load factor and β is a factor that multiplies the Raleigh quotient ωb associated to the first buckling mode. This parameter assumes the value of 25.94 rad/sec for the example at hand. The study performed in chapter 4 revealed that the change of the vibration mode with respect to the load magnitude can largely affect the solution. The simple one degree of freedom model previously discussed in chapter 4 contains the main effect of the nonlinearity in the aS and bS coefficients based on the buckling mode. However, the inertial term needs to account for the change in vibration mode for the equation to yield reasonable results. We showed that a linear 143
Chapter 5
interpolation of the inertial term between the Raleigh quotient of the vibration and buckling mode with respect to the load magnitude greatly improved the accuracy of the time response. However, for general load cases, a multi-degree of freedom approach is needed. We already showed that in general vibration modes and second order fields can be included in a reduction basis as independent degrees of freedom. For simple structures like the one presented here, the concept of interpolated inertial term can be generalized to the interpolation of the vibration modes with respect to the load level. This approach is physically justified with the observation that the vibration modes varies smoothly with the static pre-load. we propose here a simple linear interpolation:
q1i =
� � λ(t) λ(t) b 1− q qv1i + λci λci 1i
(5.40)
Each vibration mode qv1i is ”morphed” to the corresponding buckling mode qb1i through the corresponding critical load. The first two vibration and buckling modes are shown in figures 5.25 and 5.26.
ω =23.37 rad/sec 1
ω =36.51 rad/sec 2
Figure 5.25: Roorda’s frame: first two vibration modes The second order fields are still an essential part of the reduction basis, and should therefore be included. We run some cases with different frequencies and magnitudes of the applied load with a basis formed as follows
� Ψ = q1 qv211 qv222 qb211 qb222
(5.41)
No interaction terms have been considered for the second order contribution. The second order fields included pertains to the first two vibration modes and the first 144
Modal reduction for nonlinear transient analysis
λ1 =3.037 N
λ =9.765 N 2
Figure 5.26: Roorda’s frame: first two buckling modes
two buckling modes. Since the reduction basis is now time-dependent, the reduced system of equations as the form of equation (5.14). The results of the dynamic analysis with the described reduction basis are compared to the full nonlinear solution obtained with ABAQUS in figure 5.27. The rotation of the bottom tip of the frame is monitored. A good agreement is obtained for all the presented cases. In order to give an impression of the importance of considering both vibration and buckling modes, as well as second order fields, let us consider the case of α = 0.6, β = 1.0. We consider three cases for the projection basis: one formed with vibration modes and corresponding second order fields only, one with buckling modes and corresponding second order fields only, and one with vibration modes ”morphed” to buckling modes and all the corresponding second order fields (vibration and buckling). The results are shown in figure 5.28. It is evident that only the inclusion of contributions from the vibration and the buckling modes is able to correctly approximate the solution. The dynamic behavior is not captured by only including vibration modes or buckling modes and corresponding second order corrections. This is due to the strong dependence of the eigenbasis on the load level. The best basis consist therefore in 6 modes, two ”morphed” first order fields as is equation (5.40) and 4 corresponding second order fields. A note must be drawn. The interpolation between vibration modes at two different load levels implicitly implies that it is possible to establish a clear correspondence between the modes. However, this is not always trivial. In cases when frequency drifting and mode crossing occur as the load parameter increases, it is important to associate the modes correctly. In other words, a generic nth vibration mode could 145
Chapter 5
α=0.4, β = 0.5
−0.01
0.2
0.4
Reduced Full 0.6 0.8 1
rotation, rad
rotation, rad
0
−0.02 0
x 10
0 −2 −4 −6 0
0.2
time, sec α=0.6, β = 1.0
0.6
0.8
1
0.02
rotation, rad
rotation, rad
0.4
time, sec α=0.8, β = 2.0
0.02 0.01 0 −0.01 −0.02 0
α=0.4, β = 5.0
−3
2
0.01
0.2
0.4
0.6
time, sec
0.8
1
0.01 0 −0.01 −0.02 0
0.2 0.4 0.6 0.8
1
time, sec
Figure 5.27: Roorda’s frame: dynamic responses. A reduction basis with 2 interpolated vibration modes and second order fields yields a good accuracy of the reduced solution.
146
Modal reduction for nonlinear transient analysis
0.025
bottom corner rotation, rad
0.02 0.015
1. 2. 3. ABAQUS
0.01 0.005 0 −0.005 −0.01 −0.015 −0.02 −0.025 0
0.15
0.30
0.45
0.60
0.75
1.00
1.15
time, sec
Figure 5.28: Roorda’s frame, dynamic response, α = 0.6, β = 1.0 1. vibration contribution only 2. buckling contribution only 3. vibration and buckling contribution
morph to the mth buckling mode, with n �= m. The problem can occur especially in the case of structures exhibiting clustering of vibration modes when the frequencies are close to each other. Fortunately, mode tracking algorithms are available in literature, for example in [26].
5.12
Conclusions
A reduction method for the geometrical nonlinear finite element dynamics analysis of general structures has been proposed. The dynamic equations of motion resulting form the spatial FE discretization are projected on a reduced set of displacement vectors. The reduction basis is formed with a combination of vibration modes and second order fields generated by a perturbation approach. The method appears as a natural extension of the classical modal analysis. The vibration modes are chosen to yield good accuracy for the solution for the linearized problem. Once the vibration modes are calculated, the second order fields are systematically generated via the 147
Chapter 5
solution of linear problems. The contribution of inertial effect can be neglected in the calculation of the second order fields. This leads to a simplification of the second order problem. In a FE discretization, the matrix of coefficients is the tangential stiffness matrix that can be factorized once for all. The right-hand-side vector is a function of the vibration modes. The omission of the inertial term avoids potential singularities if the double harmonic 2ω is a frequency of the structure. The problem can be easily generalized to account for modal interactions. The interaction second order fields are in general important for more complicated examples and must be included in the analysis. For problems involving the possibility of buckling during the transient response, an extension of the method have been proposed. Instead of recomputing the basis during the time integration, the reduction basis can formed by vibration modes and corresponding second order fields calculated at two different load levels. Typically, the first level is the load configuration and the second is the buckled configuration. The applicability of this strategy has been demonstrated via examples that exhibit a marked change in the structural response after buckling occurred. The inclusion of vibration modes and second order fields at the loaded (buckled configuration) is crucial for an accurate solution. The transition between vibration modes and buckling modes can be approximated with a linear interpolation through the load multiplier. In this case, the reduced equations need to be reformulated to account for the time-dependence of the basis. This approach could result in a moderate reduction of the number of degrees of freedom. For more complicated cases, in which the vibration modes drift with respect to the load parameter, it is necessary to track the specific modes under consideration. For this purpose, mode tracking algorithms can be used [26]. The effectiveness of such method for more complicated case has not been tested. Attempts have been made to select the best set of second order fields in order to further reduce the number of degrees of freedom. If the linear vibration modes basis is constituted by N vectors, it is in principle possible to generate N · (N + 1)/2 second order fields. The inclusion of the complete set of second order fields yields a remarkable reduction of the number of degrees of freedom. However, future research should address to a criterion to select the most important second order fields for a more efficient reduction.
148
Chapter 6
Conclusions Nonlinear finite element (FE) structural analysis is a steadily growing practice in research and industrial application. In spite of the maturity of commercial FE computer programs, a full model nonlinear analysis can still be a computationally expensive task. This is especially true in an early design stage when an insight on the behavior is of importance. This thesis dealt with FE based reduction methods for nonlinear static and dynamic analysis to effectively reduce the number of degrees of freedom of a general model while retaining a good accuracy of the solution. In chapter 1 the main areas of investigation were stated, namely
1. Initial post-buckling analysis of (imperfect) structures 2. Nonlinear free vibrations of general structures 3. Transient analysis of general structures
An extensive literature review on these three main topics has been presented. Koiter’s initial post-buckling analysis has been presented and discussed in chapter 2. Koiter’s analysis is a perturbation technique that allows a compact description of the initial post-buckling analysis of a general structure. The main advantage of this technique is the description of the stability characteristic of a given structure through so-called post-buckling coefficients that give the initial slope and curvature 149
Chapter 6
of the secondary path. This allows a quick evaluation of the initial post-buckling behavior of the structure at hand. Once the coefficients are calculated for the perfect structure, the effect of small geometrical imperfections can be added to the reduced equation as a forcing term. The computational cost is largely reduced as compared to a full nonlinear analysis. The Koiter’s analysis requires the linear solution for the pre-buckling state, the solution of an eigenvalue problem for the buckling state and a solution of a singular linear problem for the second order field. The postbuckling coefficients are found through an integration at the element level, summed over the whole structure. In the case of interacting buckling modes, the approach can be extended to consider a multimode approach. In this case, the method yields to a reduced nonlinear algebraic system of equations where the unknowns are the amplitudes of the retained buckling modes. The coefficient for the nonlinear terms are calculated once for all for the perfect structure. The Koiter’s analysis can provide physical insight to the behavior of the structure. Some care needs to be taken in the choice of the kinematical model. It has been shown by [51, 34] that it is a better practice to rely on a simplified Green-Lagrange strain tensor to avoid largely incorrect results if the structure is not overly constrained. A finite element implementation has been proposed. Instead of relying on complicated ad hoc formulations, [12, 33, 57], a simple averaging of the strain quantities has been performed. This avoids locking problems caused by the different order of interpolation between inplane and out-of-plane displacements. A 2D 2 nodes beam element and a triangular 3 nodes flat shell element based on existing elements has been proposed. Several examples have been presented to show the capabilities of the method as well as the good performance of the proposed FE implementation. A similar perturbation technique can be used for the analysis of nonlinear free vibrations of structures. The method leads to the evaluation of the curvature of the relation between the frequency and the amplitude of vibration. The analytical treatment proposed by [63] has been implemented into FE using the same technique proposed in chapter 2. Good agreement with theoretical results has been obtained. The single mode Koiter’s post-buckling analysis can be extended to treat the case of dynamic buckling [14]. This method can lead to an estimation of the dynamic buckling of a structure for simple time history of the applied load once the static post-buckling properties have been calculated. The possibility of this treatment to handle more complicated load cases has been investigated in chapter 4. A careful examination of an example has shown the importance of considering the effect of a changing vibration mode as the load is applied to the structure. This observation has served as a guideline for a general reduction method for nonlinear transient analysis discussed in chapter 5. The dynamic equations of motions stemming from a FE discretization can be ef150
Conclusions
fectively reduced by forming a base of vibration modes enriched by corresponding second order fields calculated with a perturbation technique as presented in chapter 2 and 3. The method is a natural extension of linear modal reduction since the vibration modes are chosen for a good a good accuracy for the solution of the linearized problem. Instead of serving as ”ingredients” for an expansion, the second order fields are here treated as independent degrees of freedom. The omission of the contribution of the inertial term in the calculation of the second order fields leads to a linear problem in which the coefficient matrix coincides with the tangential stiffness matrix and it is thus factorized once for all. For problems involving dynamic load levels that could cause the occurrence of buckling or more in general characterized by a marked nonlinear response, the reduction basis formed by vibration modes and second order fields can be formed at two different equilibrium configurations, typically the initial configuration and the equilibrium configuration at the buckling load. Examples have been shown to prove the effectiveness of the method.
151
152
Bibliography [1] D. J. Allman. A simple cubic displacement element for plate bending. International Journal for Numerical Methods in Engineering, 10:263–281, 1976. [2] D. J. Allman. A compatible triangular element including vertex rotations for plane elasticity analysis. Computers & Structures, 19:1–8, 1984. [3] D. J. Allman. Evaluation of the constant strain triangle with drilling rotations. International Journal for Numerical Methods in Engineering, 26:2645– 2655, 1988. [4] D. J. Allman. Analysis of general shells by flat facet finite element approximation. Aeronautical Journal, pages 194–203, June/July 1991. [5] D. J. Allman. A basic flat facet finite element for the analysis of general shells. International Journal for Numerical Methods in Engineering, 37:19–35, 1994. [6] D. J. Allman. Implementation of a flat facet shell finite element for applications in structural dynamics. Computers & Structures, 59:657–663, 1996. [7] Ch. Gantes andA.N. Kounadis. Energy-based dynamic buckling estimates for autonomous dissipative systems. AIAA Journal, 33:1342–1349, 1995. [8] S. S. Antman. Bifurcation problems in non-linearly elastic structures. Academic Press, 1977. [9] J. Arbocz and J.M.A.M Hol. Koiter’s stability theory in a computer-aided engineering (cae) environment. International Journal of Solids and Structures, 26:945–973, 1990. [10] M. Aristodemo. A high-continuity finite element model for two-dimensional elastic problems. Computers & Structures, 21:987–993, 1985. 153
[11] K. J. Bathe. Finite Element Procedures. Prentice Hall, 1996. [12] A. Bilotta. High continuity finite element formulation for the analysis of shear deformable plates. Technical Report 189, APRICOS-DE-1.3-10-1/UNICAL Laboratorio di Meccanica Computazionale, 1998. [13] D.O. Brush and B.O. Almroth. Buckling of Bars, Plates and Shells. Mc GrawHill, New York, 1975. [14] B. Budiansky. Dynamic buckling of elastic structures: criteria and estimates. In Dynamic-Stability of Structures. Pergamon Press, 1965. International Conference held at Northwestern University, Evanston, Illinois. [15] B. Budiansky and R.S.Roth. Axisymmetric dynamic buckling of clamped shallow spherical shells. In: Collected Papers on Instability of Shell Structures, NASA TN D-1510, 1962. [16] A. Eriksson C. Pacoste. Element behavior in post-critical plane frame analysis. Computer Methods in Applied Mechanics and Engineering, 125:319–343, 1995. [17] A. Eriksson C. Pacoste. Beam elements in instability problems. Computer Methods in Applied Mechanics and Engineering, 144:163–197, 1997. [18] E. Carnoy. Postbuckling analysis of elastic structures by the finite element method. Computer Methods in Applied Mechanics and Engineering, 23:143– 174, 1980. [19] E. Carnoy. Asymptotic study of the elastic postbuckling behavior of structures by the finite element method. Computer Methods in Applied Mechanics and Engineering, 29:147–173, 1981. [20] C. Chang and J.J. Engblom. Nonlinear dynamical response of impulsively loaded structures: a reduced basis approach. AIAA Journal, 29:613–618, April 1991. [21] J.C. Chen. Nonlinear vibrations of cylindrical shells. PhD thesis, California Institute of Technology, Pasadena, California, 1972. [22] K. K. Choong and E. Ramm. Simulation of buckling process of shells by using the finite element method. Thin-Walled Structures, 31:39–72, 1998. [23] G.A. Cohen. Effect of a nonlinear prebuckling state on the postbuckling behavior and imperfection sensitivity of elastic structures. AIAA Journal, 6:1616– 1619, 1968. [24] J. W. Hutchinson E. Byskov. Mode interaction in axially stiffened cylindrical shells. AIAA Journal, 15:941–948, 1977. 154
Bibliography
[25] T. Rock E. Hinton and O.C. Zienkiewicz. A note on mass lumping and related processes in the finite element method. Earthquake Engrg. Struct. Dynamics, 4:245–249, 1976. [26] M. S. Eldred, V. B. Venkayya, and W. J. Anderson. Mode traking issues in structural optimization. AIAA Journal, 33:1926–1933, October 1995. [27] D.A. Evensen. Nonlinear flexural vibrations of thin-walled circular cylinders. Technical Report TN D-4090, NASA, 1967. [28] C. Felippa and C. Militello. Construction of optimal 3-node plate bending triangles by templates. Computational Mechanics, 24:1–13, 1999. [29] C. A. Felippa. a study of optimal membrane triangles with drilling freedoms. Technical Report CU-CAS-03-02, Center for Aerospace Structures - College of Engineering - University of Colorado, 2003. [30] E. Feraco, G. Garcea, and R. Casciaro. Efficienza, accuratezza e affidabilita dell’approccio perturbativo nell’analisi di strutture elastiche a parete sottile. Technical Report 12, UNICAL - Laboratorio di Meccanica Computazionale, 1999. [31] J.R. Fitch. The buckling and postbuckling behavior of spherical caps under concentrated loads. International Journal of Solids and Structures, 4:421–446, 1968. [32] C. M. Menken G. M. van Erp. The spline finite-strip method in the buckling analyses of thin walled structures. Communications in Applied Numerical methods, 6:477–484, 1990. [33] C. M. Menken G. M. van Erp. Initial post-buckling analysis with the finite-strip method. Computer & Structures, pages 1193–1201, 1991. [34] A. D. Lanzo G. Salerno. A nonlinear beam finite element for the post-buckling analysis of plane frames by koiter’s perturbation approach. Computer Methods in Applied Mechanics and Engineering, 146:325–349, 1997. [35] G. Garcea, A. Bilotta, A. Trunfio, and R. Casciaro. Mixed formulation in koiter nonlinear analysis of thin-walled structures: Kasp implementation. Technical Report 192, APRICOS-DE-1.3-10-1/UNICAL - Laboratorio di Meccanica Computazionale, 1998. [36] G.Garcea, G. Salerno, and R. Casciaro. Extrapolation locking and its sanitation in koiter’s asymptotic analysis. Computer Methods in Applied Mechanics and Engineering, 180:137–167, 1999. 155
[37] S. R. Idelsohn and A. Cardona. A load-dipendent basis for reduced nonlinear structural dynamics. Computer & Structures, 20:203–210, 1985. [38] S. R. Idelsohn and A. Cardona. A reduction method for nonlinear structural dynamic analysis. Computer Methods in Applied Mechanics and Engineering, 49:253–279, 1985. [39] J. Singer J Arbocz, M. Potier-Ferry and V. Tvergaard. Post-buckling behaviour of structures: numerical techniques for more complicated structures. In Buckling and Post-Buckling. Springer-Verlag, 1985. [40] E. Byskov J. F. Olesen. Accurate determination of asymptotic postbuckling stresses by the finite element method. Computer & Structures, 15:157–163, 1982. [41] E.L. Jansen. Nonlinear vibrations of anisotropic cylindrical shells. PhD thesis, Delft University of Technology, Delft, The Netherlands, 2001. [42] U. Kirsch. Reduced basis approximations of structural displacements for optimal design. AIAA Journal, 29:1751–1758, 1991. [43] W. T. Koiter. On the stability of the elastic equilibrium. PhD thesis, Delft University of Technology, 1945. [44] W.T. Koiter. On the nonlinear theory of thin elastic shells. In Proc. Koninlijke Nederlandse Academie van Wetenschapper Ser. B,69, pages 1–54, 1966. [45] A.N. Kounadis and I.G. Raftoyiannis. Nonlinear dynamic buckling load of discrete dissipative or nondissipative systems under step loading. AIAA Journal, 29:280–289, 1991. [46] P. Krysl, S. Lall, and J. E. Marsden. Dimensional model reduction in nonlinear finite element dynamics of solids and structures. To appear, International Journal for Numerical Methods in Engineering. [47] A. D. Lanzo, G. Garcea, and R. Casciaro. Asymptotic post-buckling analysis of rectangular plates by hc finite elements. International Journal for Numerical Methods in Engineering, 38:2325–2345, 1995. [48] A.D. Lanzo and G.Garcea. Koiter’s analysis of thin-walled structures by a finite element approach. International Journal for Numerical Methods in Engineering, 39:3007–3031, 1996. [49] J. L. Leu and C. W. Huang. A reduced-basis method for geometric nonlinear analysis of sructures. Journal of International Association of Shell and Spatial Structures, 39:71–76, 1998. 156
Bibliography
[50] L. J. Leu and C. H. Tsou. Applications of a reduction method for reanalysis to nonlinear dynamic analysis of framed structures. Computational Mechanics, 26:497–505, 2000. [51] A. D. Carlo M. Pignataro. On nonlinear beam models from the point of view of computational post-buckling analysis. International Journal of Solids Structures, 18:327–347, 1982. [52] R.H. Mallett and R.T. Haftka. Progress in nonlinear finite element analysis using asymptotic solution techniques. In Advances in Computational Methods in Structural Mechanics and Design. UAH Press, Huntsville, AL, 1972. [53] M. I. McEwan, J. R. Wright, J.E. Copper, and A. Y. T. Leung. A combined modal/finite element analysis technique for the dynamic response of a non-linear beam to harmonic excitation. Journal of Sound and Vibration, 243:601–624, 2001. [54] C. M. Menken, G. M. A. Schreppers, W. J. Groot, and R. Petterson. Analyzing buckling mode interactions in elastic structures using an asymptotic approach; theory and experiment. Computer & Structures, 64:473–480, 1997. [55] R. E. Nickell. Nonlinear dynamics by mode superposition. Computer Methods in Applied Mechanics and Engineering, 7:107–129, 1976. [56] M.D. Olson. Some experimental observations on the nonlinear vibrations of cylindircal shells. AIAA Journal, 3:1775–1777, 1965. [57] L. Damkilde P. N. Poulsen. Direct determination of asymptotic structural postbuckling behavior by the finite element method. International Journal for Numerical Methods in Engineering, 42:685–702, 1998. [58] P.Bergan and C. Felippa. A triangular membrane element with rotational degrees of freedom. Computer Methods in Applied Mechanics and Engineering, 50:25–69, 1985. [59] R. H. Mallett R. T. Haftka and W. Nachbar. Adaptation of koiter’s mathod to finite element analysis of snap-through buckling behavior. International Journal of Solids Structures, 7:1427–1445, 1971. [60] S.A. Ragon, Z. G¨ urdal, and L.T. Watson. A comparison of three algorithms for tracing nonlinear equilibrium paths of structural systems. International Journal of Solids Structures, 139:689–698, 2002. [61] M. El Raheb and C.D. Babcock. Some approximations in the linear dynamic equations of thin cylinders. Journal of Sound and Vibrations, 74:543–559, 1 1981. 157
[62] J.W.S. Rayleigh. The theory of sound. Macmillan, 1877. [63] L. W. Rehfield. Nonlinear vibration of elastic structures. International Journal of Solids Structures, 9:581–590, 1973. [64] L. W. Rehfield. Large amplitude forced vibrations of elastic structures. AIAA Journal, 12:388–390, March 1974. [65] E. Riks, C. C. Rankin, and F. Brogan. On the solution of mode jumping phenomena in thin-walled structures. Computer Methods in Applied Mechanics and Engineering, 136:59–92, 1996. [66] A. Schokker, S. Sridharan, and A. Kasagi. Dynamic buckling of composite shells. Computer & Structures, 59:43–53, 1996. [67] P. M. A. Slaats, J. de Jong, and A. A. H. J. Sauren. Model reduction tools for nonlinear structural dynamics. Computer & Structures, 54:1155–1171, 1995. [68] P. Tiso and E. L. Jansen. A finite element based reduction method for nonlinear analysis of structures. In 46t h AIAA/ASME/ASCE/AHS/ASC Structures, Structural Dynamics, and Materials Conference, Austin, TX, USA, 2005. [69] G.M. van Erp. Advanced buckling analyses of beams with arbitrary cross sections. PhD thesis, Eindhoven University of Technology, Eindhoven, The Netherlands, 1989. [70] J. Wedel-Heinen. Vibration of geometrically imperfect beam and shell structures. International Journal of Solids Structures, 27:29–47, 1991. [71] E.L. Wilson, M. Juan, and J.M. Dickens. Dynamic analysis by direct superposition of ritz vectors. Earthquake Engineering and Structural Dynamics, 10:813– 821, 1982. [72] L. Wullschleger and H.-R. Piening. Buckling of geometrically imperfect cylindrical shells - definition of a buckling load. International Journal of Non-Linear Mechanics, 37:645–657, 2002.
158
Curriculum Vitae
Paolo Tiso was born on June 16th, 1976 in Varese, Italy. He attended the Liceo Scientifico G. Ferraris in Varese where he graduated in 1995 and then studied aerospace engineering at Politecnico di Milano, Italy. He moved to USA in 2000 for a one year stay at the Worcester Polytechnic Institute, Worcester, MA USA where he graduated in 2001 with a MSc degree in civil engineering with a thesis on finite element modeling and experimental activities on the vehicle dynamics of a pickup truck impacting curbs under the supervision of prof. Malcolm H. Ray. The same thesis work was valid for a MSc degree in aerospace engineering at Politecnico di Milano, where the author graduated in 2001. After graduation, the author worked at HKS (ABAQUS) Italy and later Aermacchi, Italy. In 2003 he joined the Aerospace Structures group at the faculty of Aerospace engineering of the Delft University of technology to start his PhD study under the supervision on dr.ir. Eelco L. Jansen.
159