an already corrupted state, it may not be possible to recover from the error. Hence ...... the checkpoint file includes errors, the application faces an irrecoverable ...
On the Combination of Silent Error Detection and Checkpointing Regular paper
Guillaume Aupy1,3 , Anne Benoit1,3 , Thomas H´erault2 , Yves Robert1,3,4 , Fr´ed´eric Vivien2,3 , and Dounia Zaidouni2,3 3
1´ 2 Ecole Normale Sup´erieure de Lyon, France INRIA, France LIP laboratory - CNRS, ENS Lyon, INRIA, UCBL, and Universit´e de Lyon, France 4 University of Tennessee Knoxville, USA
Abstract—In this paper, we revisit traditional checkpointing and rollback recovery strategies, with a focus on silent data corruption errors. Contrarily to fail-stop failures, such latent errors cannot be detected immediately, and a mechanism to detect them must be provided. We consider two models: (i) errors are detected after some delays following a probability distribution (typically, an Exponential distribution); (ii) errors are detected through some verification mechanism. In both cases, we compute the optimal period in order to minimize the waste, i.e., the fraction of time where nodes do not perform useful computations. In practice, only a fixed number of checkpoints can be kept in memory, and the first model may lead to an irrecoverable failure. In this case, we compute the minimum period required for an acceptable risk. For the second model, there is no risk of irrecoverable failure, owing to the verification mechanism, but the corresponding overhead is included in the waste. Finally, both models are instantiated using realistic scenarios and application/architecture parameters. Keywords–High-performance computing, checkpointing, silent data corruption, verification, error recovery.
I. I NTRODUCTION For several decades, the High Performance Computing (HPC) community has been aiming at increasing the computational capabilities of parallel and distributed platforms, in order to fulfill expectations arising from many fields of research, such as chemistry, biology, medicine and aerospace. The core problem of delivering more performance through ever larger systems is reliability, because of the number of parallel components. Even if each independent component is quite reliable, the Mean Time Between Failures (MTBF) is expected to drop drastically when considering an exascale system [1]. Failures become a normal part of application executions. The de-facto general-purpose error recovery technique in high performance computing is checkpoint and rollback recovery. Such protocols employ checkpoints to periodically save the state of a parallel application, so that when an error strikes some process, the application can be restored into one of its former states. There are several families of checkpointing protocols. We assume in this work that each checkpoint forms a consistent recovery line, i.e., when an error is detected, we can rollback to the last checkpoint and resume execution, after a downtime and a recovery time.
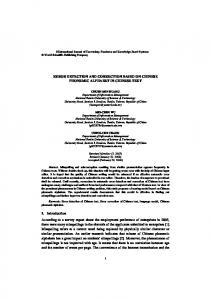
Most studies assume instantaneous error detection, and therefore apply to fail-stop failures, such as for instance the crash of a resource. In this work, we revisit checkpoint protocols in the context of latent errors, also called silent data corruption. In HPC, it has been shown recently that such errors are not unusual, and must also be accounted for [2]. The cause may be for instance soft efforts in L1 cache, or double bit flips. The problem is that the detection of a latent error is not immediate, because the error is identified only when the corrupted data is activated. One must then account for the detection interval required to detect the error in the error recovery protocol. Indeed, if the last checkpoint saved an already corrupted state, it may not be possible to recover from the error. Hence the necessity to keep several checkpoints so that one can rollback to the last correct state. This work is motivated by a recent paper by Lu, Zheng and Chien [3], who introduce a multiple checkpointing model to compute the optimal checkpointing period with error detection latency. More precisely, Lu, Zheng and Chien [3] deal with the following problem: given errors whose inter arrival times Xe follow an Exponential probability distribution of parameter λe , and given error detection times Xd that follow an Exponential probability distribution of parameter λd , what is the optimal checkpointing period Topt in order to minimize the total execution time? The problem is illustrated on Figure 1: the error is detected after a (random) time Xd , and one has to rollback up to the last checkpoint that precedes the occurrence of the error. Let k be the number of checkpoints that can be simultaneously kept in memory. Lu, Zheng and Chien [3] derive a formula for the optimal checkpointing period Topt in the (simplified) case where k is unbounded (k = ∞), and they propose some numerical simulations to explore the case where k is a fixed constant. The first major contribution of this paper is to correct the formula of [3] when k is unbounded, and to provide an analytical approach when k is a fixed constant. The latter approach is a first-order approximation but applies to any probability distribution of errors. While it is very natural and interesting to consider the latency of error detection, the model of [3] suffers from an
Error
Xe
1 λd
Detection
Xd
Time
Figure 1: Error and detection latency.
important limitation: it is not clear how one can determine when the error has indeed occurred, and hence to identify the last valid checkpoint, unless some verification system is enforced. Another major contribution of this paper is to introduce a model coupling verification and checkpointing, and to analytically determine the best balance between checkpoints and verifications so as to optimize platform throughput. The rest of the paper is organized as follows. First we revisit the multiple checkpointing model of [3] in Section II; we tackle both the case where all checkpoints are kept, and the case with at most k checkpoints. In Section III, we define and analyze a model coupling checkpoints and verifications. Then, we evaluate the various models in Section IV, by instantiating the models with realistic parameters derived from future exascale platforms. Related work is discussed in Section V. Finally, we conclude and discuss future research directions in Section VI. II. R EVISITING THE MULTIPLE CHECKPOINTING MODEL In this section, we revisit the approach of [3]. We show that their analysis with unbounded memory is incorrect and provide the exact solution (Section II-A). We also extend their approach to deal with the case where a given (constant) number of checkpoints can be simultaneously kept in memory (Section II-B). A. Unlimited checkpoint storage Let C be the time needed for a checkpoint, R the time for recovery, and D the downtime. Although R and C are a function of the size of the memory footprint of the process, D is a constant that represents the unavoidable costs to rejuvenate a process after an error (e.g., stopping the failed process and restoring a new one that will load the checkpoint image). We assume that errors can take place during checkpoint and recovery but not during downtime (otherwise, the downtime could be considered part of the recovery). Let µe = λ1e be the mean time between errors. With no error detection latency and no downtime, well-known formulas for the optimal period (useful work plus checkpointing time that √ 2Cµ +C (as given minimizes the execution time) are T ≈ e opt p by Young [4]) and Topt ≈ 2C(µe + R) + C (as given by Daly [5]). These formulas are first-order approximations and are valid only if C, R � µe (in which case they collapse). With error detection latency, things are more complicated, even with the assumption that one can track the source of the error (and hence identify the last valid checkpoint). Indeed, the amount of rollback will depend upon the sum Xe + Xd . For Exponential distributionspof Xe and Xd , Lu, Zheng and Chien [3] derive that Topt ≈ 2C(µe + µd ) + C, where µd =
is the mean of error detection times. However, although this result may seem intuitive,√it is wrong, and we prove that the correct answer is Topt ≈ 2Cµe + C, even when accounting for the downtime: this first-order approximation is the same as Young’s formula. We give an intuitive explanation after the proofs provided in Section II-A1. Then in Section II-A2, we extend this result to arbitrary laws, but under the additional constraint that µd + D + R � µe . 1) Exponential distributions: In this section, we assume that Xe and Xd follow Exponential distributions of mean µe and µd respectively. Proposition 1. The expected time needed to successfully execute a work of size w followed by its checkpoint is E(T (w)) = eλe R (D + µe + µd ) (eλe (w+C) − 1). Proof: Let T (w) be the time needed for successfully executing a work of duration w. There are two cases: (i) if there is no error during execution and checkpointing, then the time needed is exactly w + C; (ii) if there is an error before successfully completing the work and its checkpoint, then some additional delays are incurred. These delays come from three sources: the time spent computing by the processors before the error occurs, the time spent before the error is detected, and the time spent for downtime and recovery. Regardless, once a successful recovery has been completed, there still remain w units of work to execute. Thus, we can write the following recursion: E(T (w)) = e−λe (w+C) (w + C) + (1 − e−λe (w+C) ) (E(Tlost ) + E(Xd ) +E(Trec ) + E(T (w))) . (1) Here, Tlost denotes the amount of time spent by the processors before the first error, knowing that this error occurs within the next w + C units of time. In other terms, it is the time that is wasted because computation and checkpoint were not both completed before the error occurred. The random variable Xd represents the time needed for error detection, and its expectation is E(Xd ) = µd = λ1d . The last variable Trec represents the amount of time needed by the system to perform a recovery. Equation (1) simplifies to: E(T (w)) = w +C +(eλe (w+C) −1)(E(Tlost )+µd +E(Trec )). (2) We have Z ∞ E(Tlost ) = xP(X = x|X < w + C)dx 0
=
1 P(X < w + C)
Z
w+C
0
−λe (w+C)
and P(X < w + C) = 1 − e Integrating by parts, we derive that E(Tlost ) =
xλe e−λe x dx, .
1 w+C − λ (w+C) . λe e e −1
(3)
Next, to compute E(Trec ), we have a recursive equation quite similar to Equation (1) (remember that we assumed that no error can take place during the downtime): E(Trec ) = e−λe R (D + R) +(1 − e
−λe R
)(E(Rlost ) + E(Xd ) + D + E(Trec )).
Here, E(Rlost ) is the expected amount of time lost to executing the recovery before an error happens, knowing that this error occurs within the next R units of time. Replacing w + C by R in Equation (3), we obtain R 1 − λe R . E(Rlost ) = λe e −1 The expression for E(Trec ) simplifies to E(Trec ) = Deλe R + (eλe R − 1)(µe + µd ).
(4)
Plugging the values of E(Tlost ) and E(Trec ) into Equation (2) leads to the desired value. Proposition 2. The optimal strategy to execute a work of size W is to divide it into n equal-size chunks, each followed by a checkpoint, where n is equal either to max(1, bn∗ c) or to dn∗ e. The value of n∗ is uniquely derived from y = λne W ∗ − 1, where L(y) = −e−λe C−1 (L, the Lambert function, defined as L(x)eL(x) = x). The optimal strategy does not depend on the value of µd . Pn Proof: Using n chunks of size wi (with i=1 wi = W ), by linearity of the expectation, we have E(T (W )) = Pn K i=1 (eλe (wi +C) − 1) where K = eλe R (D + µe + µd ) is a constant. By convexity, the sum is minimum when all the wi s are equal (to W n ). Now, E(T (W )) is a convex function of n, hence it admits a unique minimum n∗ such that the derivative is zero: � � W λe W λe ( n ∗ +C) e 1− ∗ = 1. (5) n y Let y = λne W = −e−λe C−1 , hence L(y) = ∗ −1, we have ye −e−λe C−1 . Then, since we need an integer number of chunks, the optimal strategy is to split W into max(1, bn∗ c) or dn∗ e same-size chunks, whichever leads to the smaller value. As stated, the value of y, hence of n∗ , is independent of µd .
Proposition 3. A first-order approximation for the optimal checkpointing period (that minimizes total execution time) is √ Topt ≈ 2Cµe +C. This value is identical to Young’s formula, and does not depend on the value of µd . Proof: We use Proposition 2 and Taylor expansions when is small: from yey = −e−λe C−1 , we derive z = y + 1 = λne W ∗ 2 (z − 1)ez = −e−λe C . We have (z − 1)ez ≈ z2 − 1, and −e−λe C ≈ −1 + λe C, hence z 2 ≈ 2λe C. The period is p z W + C ≈ 2Cµe + C. Topt = ∗ + C = n λe An intuitive explanation of the result is the following: error detection latency is paid for every error, and can be viewed as an additional downtime, which has no impact on the optimal period.
2) Arbitrary distributions: Here we extend the previous result to arbitrary distribution laws for Xe and Xd (of mean µe and µd respectively): Proposition 4. When C � µe and µd + D + R � µe , a firstorder approximation for the optimal checkpointing period is √ Topt ≈ 2Cµe + C. Proof: Let Tbase be the base time of the application without any overhead due to resilience techniques. First, assume a fault-free execution of the application: every period of length T , only Work = T − C units of work are executed, hence the T time Tff for a fault-free execution is Tff = Work Tbase . Now, let Tfinal denote the expectation of the execution time with errors taken into account. In average, errors occur every µe timeunits, and for each of them we lose F time-units, so there are Tfinal µe errors during the execution. Hence we derive that Tfinal = Tff +
Tfinal F, µe
(6)
which we rewrite as (1−WASTE)Tfinal = Tbase , �
F with WASTE = 1 − 1 − µe
�� � C 1− . (7) T
The waste is the fraction of time where nodes do not perform useful computations. Minimizing execution time is equivalent to minimizing the waste. In Equation (7), we identify the two sources of overhead: (i) the term WASTEff = C T , which is the waste due to checkpointing in a fault-free execution, by construction of the algorithm; and (ii) the term WASTEfail = F µe , which is the waste due to errors striking during execution. With these notations, we have WASTE = WASTEfail + WASTEff − WASTEfail WASTEff . (8) There remains to determine the (expected) value of F. Assuming at most one error per period, we lose F = T2 +µd +D +R per error: T2 for the average work lost before the error occurs, µd for detecting the error, and D +R for downtime and recovery. Note that the assumption is valid only if µd +D+R � µe and T � µe . Plugging back this value into Equation (8), we obtain WASTE(T ) =
d C(1 − D+R+µ ) D + R + µd − T µe + + 2µe T µe
which is minimal for p p Topt = 2C(µe − D − R − µd ) ≈ 2Cµe .
C 2
(9)
(10)
We point out that this approach based on the waste leads to a different p approximation formula for√the optimal√period, but Topt = 2C(µe − D − R − µd ) ≈ 2Cµe ≈ 2Cµe + C up to second-order terms, when µe is large in front of the other parameters, including µd . For example, this approach does not allow us to handle the case µd = µe ; in such a case, the optimal period is known only for Exponential distributions, and is independent of µd , as proven by Proposition 2.
To summarize, the exact value of the optimal period is only known for Exponential distributions and is provided by Proposition 2, while Young’s formula can be used as a firstorder approximation for any other distributions. Indeed, the optimal period is a trade-off between the overhead due to T checkpointing ( C T ) and the expected time lost per error ( 2µe plus some constant). Up to second-order terms, the waste is minimum when both factors are equal, which leads to Young’s formula, and which remains valid regardless of error detection latencies.
max(Tmin , Topt ) to minimize the waste while enforcing a risk below threshold. In case of irrecoverable failure, we have to resume execution from the very beginning. The number of re-executions due to consecutive irrecoverable failures follows a geometric law of parameter 1 − Prisk , so that the expected number of executions 1 . We refer to Section IV-A for an until success is 1−P risk example of how to instantiate this model to compute the best period with a fixed number of checkpoints, under a prescribed risk threshold.
B. Saving only k checkpoints
III. C OUPLING VERIFICATION AND CHECKPOINTING In this section, we move to a more realistic model where silent errors are detected only when some verification mechanism (checksum, error correcting code, coherence tests, etc.) is executed. Our approach is agnostic of the nature of this verification mechanism. We aim at solving the following optimization problem: given the cost of checkpointing C, downtime D, recovery R, and verification V , what is the optimal strategy to minimize the expected waste as a function of the mean time between errors µe ? Depending upon the relative costs of checkpointing and verifying, we may have more checkpoints than verifications, or the other way round. In both cases, we target a periodic pattern that repeats over time. Consider first the scenario where the cost of a checkpoint is smaller than the cost of a verification: then the periodic pattern will include k checkpoints and 1 verification, where k is some parameter to determine. Figure 2(a) provides an illustration with k = 5. We assume that the verification is directly followed by the last checkpoint in the pattern, so as to save results just after they have been verified (and before they get corrupted). In this scenario, the objective is to determine the value of k that leads to the minimum platform waste. This problem is addressed in Section III-A. Because our approach is agnostic of the cost of the verification, we also envision scenarios where the cost of a checkpoint is higher than the cost of a verification. In such a framework, the periodic pattern will include k verifications and 1 checkpoint, where k is some parameter to determine. See Figure 2(b) for an illustration with k = 5. Again, the objective is to determine the value of k that leads to the minimum platform waste. This problem is addressed in Section III-B. We point out that combining verification and checkpointing guarantees that no irrecoverable failure will kill the application: the last checkpoint of any period pattern is always correct, because a verification always takes place right before this checkpoint is taken. If that verification reveals an error, we roll back until reaching a correct verification point, maybe up to the end of the previous pattern, but never further back, and re-execute the work. The amount of roll-back and re-execution depends upon the shape of the pattern, and we show how to compute it in Sections III-A and III-B below.
Lu, Zheng and Chien [3] propose a set of simulations to assess the overhead induced when keeping only the last k checkpoints (because of storage limitations). In the following, we derive an analytical approach to numerically solve the problem. The main difficulty is that when error detection latency is too large, it is impossible to recover from a valid checkpoint, and one must resume the execution from scratch. We consider this scenario as an irrecoverable failure, and we aim at guaranteeing that the risk of irrecoverable failure remains under a user-given threshold. Assume that a job of total size W is partitioned into n chunks. What is the risk of irrecoverable failure during the execution of one chunk of size W n followed by its checkpoint? + C be the length of the period. Intuitively, the Let T = W n longer the period, the smaller the probability that an error that has just been detected took place more than k periods ago, thereby leading to an irrecoverable failure because the last valid checkpoint is not one of the k most recent ones. Formally, there is an irrecoverable failure if: (i) there is an error detected during the period (probability Pfail ), and (ii) the sum of Tlost , the time elapsed since the last checkpoint, and of Xd , the error detection latency, exceeds kT (probability Plat ). The value of Pfail = P(Xe ≤ T ) is easy to compute from the error distribution law. For instance with an Exponential law, Pfail = 1 − e−λe T . As for Plat , we use an upper bound: Plat = P(Tlost + Xd ≥ kT ) ≤ P(T + Xd ≥ kT ) = P(Xd ≥ (k − 1)T ). The latter value is easy to compute from the error distribution law. For instance with an Exponential law, Plat = e−λd (k−1)T . Of course, if there is an error and the error detection latency does not exceed kT (probability (1-Plat )), we have to restart execution and face the same risk as before. Therefore, the probability of irrecoverable failure Pirrec can be recursively evaluated as Pirrec = Pfail (Plat + (1 − Plat )Pirrec ), Plat . Now that we have computed Pirrec , hence Pirrec = 1−PPfailfail(1−P lat ) the probability of irrecoverable failure for a single chunk, we can compute the probability of irrecoverable failure for n chunks as Prisk = 1 − (1 − Pirrec )n . In full rigor, these expressions for Pirrec and Prisk are valid only for Exponential distributions, because of the memoryless property, but they are a good approximation for arbitrary laws. Given a prescribed risk threshold ε, solving numerically the equation Prisk ≤ ε leads to a lower bound Tmin on T . Let Topt be the optimal period given in Theorem 3 for an unbounded number of saved checkpoints. The best strategy is then to use the period
A. With k checkpoints and 1 verification We use the same approach as in the proof of Proposition 4 and compute a first-order approximation of the waste (see
w
w
w
C
V
C
C
C
C
C
V
w
Time
w
(a) 5 checkpoints for 1 verification
V
w
w
w
V
V
V
V
V
C
w
w
C
Time
(b) 5 verifications for 1 checkpoint
Figure 2: Periodic pattern.
Equations (7) and (8)). We compute the two sources of overhead: (i) WASTEff , the waste incurred in a fault-free execution, by construction of the algorithm, and (ii) WASTEfail , the waste due to errors striking during execution. Let S = kw + kC + V be the length of the periodic pattern. We easily derive that WASTEff = kC+V . As for WASTEfail , we S D+E(Tlost ) still have WASTEfail = . However, in this context, µe the time lost because of the error depends upon the location of this error within the periodic pattern, so we compute averaged values as follows. Recall (see Figure 2(a)) that checkpoint k is the one preceded by a verification. Here is the analysis when an error is detected during the verification that takes place in the pattern: • If the error took place in the (last) segment k: we recover from checkpoint k−1, and verify it; we get a correct result because the error took place later on. Then we re-execute the last piece of work and redo the verification. The time that has been lost is Tlost (k) = R + V + w + V . (We assume that there is at most one error per pattern.) • If the error took place in segment i, 2 ≤ i ≤ k − 1: we recover from checkpoint k − 1, verify it, get a wrong result; we iterate, going back up to checkpoint i−1, verify it, and get a correct result because the error took place later on. Then we re-execute k − i + 1 pieces of work and k − i checkpoints, together with the last verification. We get Tlost (i) = (k − i + 1)(R + V + w) + (k − i)C + V . • If the error took place in (first) segment 1: this is almost the same as above, except that the first recovery at the beginning of the pattern need not be verified, because the verification was made just before the corresponding checkpoint at the end of the previous pattern. We have the same formula with i = 1 but with one fewer verification: Tlost (1) = k(R + w) + (k − 1)(C + V ) + V . Therefore, the formula for WASTEfail writes Pk D + k1 i=1 Tlost (i) WASTEfail = , (11) µe and (after some manipulation using a computer algebra system) the formula simplifies to WASTEfail =
1 ((R+V )k 2+(2D+R+2V +S−2C)k+S−3V ) 2kµe (12)
Using WASTEff = kC+V and Equation (8), we compute the S total waste and derive that WASTE = aS + b + Sc , where a, b, and c are some constants. The optimal value of S is Sopt = p c a , provided that this value is at least kC + V . We point out that this formula only is a first-order approximation. We have assumed a single error per pattern. We have also assumed that errors did not occur during checkpoints following verifications. Now, once we have found WASTE(Sopt ), the value of the waste obtained for the optimal period Sopt , we can minimize this quantity as a function of k, and numerically derive the optimal value kopt that provides the best value (and hence the best platform usage). Due to lack of space, computational details are available in [6], which is a Maple sheet that we have to instantiate the model. This Maple sheet is publicly available for users to experiment with their own parameters. We provide two example scenarios to illustrate the model in Section IV-C. Finally, note that in order to minimize the waste, one could do a binary search in order to find the last checkpoint before the fault. Then we can upper-bound Tlost (i) by (k − i + 1)w + log(k)(R + V ) + (k − i)C + V , and Equation (12) becomes 1 WASTEfail = 2kµ ((R + V )2k log(k) + (2D + R + 2V + S − e 2C)k + S − 3V ). B. With k verifications and 1 checkpoint We use a similar line of reasoning for this scenario and compute a first-order approximation of the waste for the case with k verifications and 1 checkpoint per pattern. The length of the periodic pattern is now S = kw + kV + C. As before, for 1 ≤ i ≤ k, let segment i denote the period of work before verification i, and assume (see Figure 2(b)) that verification k is preceded by a checkpoint. The analysis is somewhat simpler here. If an error takes place in segment i, 1 ≤ i ≤ k, we detect the error during verification i, we recover from the last checkpoint, and redo the first i segments and verifications: therefore Tlost (i) = R + i(V + w). The formula for WASTEfail is the same as in Equation (11) and (after some manipulation) we derive � � 1 k+1 D+R+ (S − C) . (13) WASTEfail = 2µe 2k Using WASTEff = kV S+C and Equation (8), we proceed just as in Section III-A to compute the optimal value Sopt of
the periodic pattern, and then the optimal value kopt that minimizes the waste. Details are available within the Maple sheet [6]. IV. E VALUATION This section provides some examples for instantiating the various models. We aimed at choosing realistic parameters in the context of future exascale platforms, but we had to restrict to a limited set of scenarios, which do not intend to cover the whole spectrum of possible parameters. The Maple sheet [6] is available to explore other scenarios. A. Best period with k checkpoints under a given risk threshold We first evaluate Prisk , the risk of irrecoverable failure, as defined in Section II-B. Figures 3 and 4 present, for different scenarios, the probability Prisk as a function of the checkpointing period T on the left. On the right, the figures present the corresponding waste with k checkpoints and in the absence of irrecoverable failures. This waste can be computed following the same reasoning as in Equation (9). For each figure, the left diagram represents the risk implied by a given period T , showing the value Topt of the optimal checkpoint interval (optimal with respect to waste minimization and in the absence of irrecoverable failures, see Equation (10)) as a blue vertical line. The right diagram on the figure represents the corresponding waste, highlighting the trade-off between an increased irrecoverable-failure-free waste and a reduced risk. As stated in Section II-B, it does not make sense to select a value for T lower than Topt , since the waste would be increased, for an increased risk. Figure 3 considers a machine consisting of 105 components, and a component MTBF of 100 years. This component MTBF corresponds to the optimistic assumption on the reliability of computers made in the literature [7], [1]. The platform MTBF µe is thus 100 × 365 × 24/100, 000 ≈ 8.76 hours. The times to checkpoint and recover (10 min) correspond to reasonable mean values for systems at this size [8], [9]. At this scale, process rejuvenation is small, and we set the downtime to 0s. For these average values to have a meaning, we consider a run that is long enough (10 days of work), and in order to illustrate the trade-off, we take a rather low (but reasonable) value k = 3 of intervals, and a mean time error detection µd significantly smaller (30 times) than the MTBF µe itself. With these parameters, Topt is around 100 minutes, and the risk of irrecoverable failure at this checkpoint interval can be evaluated at 1/2617 ≈ 38 · 10−5 , inducing an irrecoverablefailure-free waste of 23.45%. To reduce the risk to 10−4 , a Tmin of 8000 seconds is sufficient, increasing the waste by only 0.6%. In this case, the benefit of fixing the period to max(Topt , Tmin ) is obvious. Naturally, keeping a bigger amount of checkpoints (increasing k) would also reduce the risk, at constant waste, if memory can be afforded. We also consider in Figure 4 a more optimistic scenario where the checkpointing technology and availability of resources is increased by a factor 10: the time to checkpoint, recover, and allocate new computing resources is divided by
Figure 3: Risk of irrecoverable failure as a function of the checkpointing period, and corresponding waste. (k = 3, λe = 105 , λd 100y
= 30λe , w = 10d, C = R = 600s, and D = 0s.)
10 compared to the previous scenario. Other parameters are kept similar. One can observe that Topt is largely reduced (down to less than 35 minutes between checkpoints), as well as the optimal irrecoverable-failure-free waste (9.55%). This is unsurprising, and mostly due to the reduction of failurefree waste implied by the reduction of checkpointing time. But because the period between checkpoints becomes smaller, while the latency to detect an error is unchanged (µd is still 30 times smaller than µe ), the risk that an error happens at the interval i but is detected after interval i + k is increased. Thus, the risk climbs to 1/2, an unacceptable value. To reduce the risk to 10−4 as previously, it becomes necessary to consider a Tmin of 6650 seconds, which implies an irrecoverable-failurefree waste of 15%, significantly higher than the optimal one, which is below 10%, but still much lower than the 24% when checkpoint and availability costs are 10 times higher. B. Periodic pattern with k verifications and 1 checkpoint We now focus on the waste induced by the different ways of coupling periodic verification and checkpointing. We first consider the case of a periodic pattern with more verifications than checkpoints: every k verifications of the current state of
When considering the second scenario (Figure 6), with an improved checkpointing and availability setup, the same conclusions can be reached, with an absolute value of the waste greatly diminished. Since forced verifications allow to detect the occurrence of errors at a controllable rate (depending on S and k), the risk of non-recoverable errors is nonexistent in this case, and the waste can be greatly diminished, with very few checkpoints taken and kept during the execution. C. Periodic pattern with k checkpoints and 1 verification
Figure 4: Risk of irrecoverable failure as a function of the checkpointing period, and corresponding waste. (k = 3, λe = 105 , λd 100y
= 30λe , w = 10d, C = R = 60s, and D = 0s.)
the application, a checkpoint is taken. The duration of the work interval S, between two verifications in this case, is optimized to minimize the waste. We consider two scenarios. For each scenario, we represent two diagrams: the left diagram shows the waste as a function of k for a given verification cost V , and the right diagram shows the waste as a function of k and V using a 3D surface representation. In the first scenario, we consider the same setup as above in Section IV-A. The waste is computed in its general form, so we do not need to define the duration of the work. As represented in Figure 5, for a given verification cost, the waste can be optimized by making more than one verifications. When k > 1, there are intermediate verifications that can enable to detect an error before a periodic pattern (of length S) is completed, hence, that can reduce the time lost due to an error. However, introducing too many verifications induces an overhead that eventually dominates the waste. The 3D surface shows that the waste reduction is significant when increasing the number of verifications, until the optimal number is reached. Then, the waste starts to increase again slowly. Intuitively, the lower the cost for V , the higher the optimal value for k.
The last set of experiments considers the opposite case of periodic patterns: checkpoints are taken more often than verifications. Every k checkpoints, a verification of the data consistency is done. Intuitively, this could be useful if the cost of verification is large compared to the cost of checkpointing itself. In that case, when rolling back after an error is discovered, each checkpoint that was not validated before is validated at rollback time, potentially invalidating up to k − 1 checkpoints. Because this pattern has potential only when the cost of checkpoint is much lower than the cost of verification, we considered the case of a greatly improved checkpoint / availability setup: the checkpoint and recovery times are only 6 seconds in Figure 7. One can observe that in this extreme case, it can still make sense to consider multiple checkpoints between two verifications (when V = 100 seconds, a verification is done only every 3 checkpoints optimally); however the 3D surface demonstrates that the waste is still dominated by the cost of the verification, and little improvement can be achieved by taking the optimal value for k. The cost of verification must be incurred when rolling back, and this shows on the overall performance if the verification is costly. This is illustrated even more clearly with Figure 8, where the checkpoint costs and machine availability are set to the second scenario of Sections IV-A and IV-B. As soon as the checkpoint cost is not negligible compared to the verification cost (only 5 times smaller in this case), it is more efficient to validate every other checkpoint than to validate only after k > 2 checkpoints. The 3D surface shows that this holds true for rather large values of V . All the rollback / recovery techniques that we have evaluated above, using various parameters for the different costs, and stressing the different approaches to their limits, expose a waste that remains, in the vast majority of the cases, largely below 66%. This is noticeable, because the traditional hardware based technique, which relies on triple modular redundancy and voting [10], mechanically presents a waste that is at least equal to 66% (two-thirds of resources are wasted, and neglecting the cost of voting). V. R ELATED WORK As already mentioned, this work is motivated by the recent paper by Lu, Zheng and Chien [3], who introduce a multiple checkpointing model to compute the optimal checkpointing period with error detection latency. We start with a brief overview
Figure 5: Case with k verifications, and one checkpoint per periodic pattern. Waste as function of k, and potentially of V , using the optimal period. (V = 20s, C = R = 600s, D = 0s, and µ = 10y .) 105
Figure 6: Case with k verifications, and one checkpoint per periodic pattern. Waste as function of k, and potentially of V , using the optimal period. (V = 2s, C = R = 60s, D = 0s, and µ = 10y .) 105
Figure 7: Case with k checkpoints, and one verification per periodic pattern. Waste as function of k, and potentially of V , using the optimal period. (V = 100s, C = R = 6s, D = 0s, and µ = 10y .) 105
Figure 8: Case with k checkpoints, and one verification per periodic pattern. Waste as function of k, and potentially of V , using the optimal period. (V = 300s, C = R = 60s, D = 0s, and µ = 10y .) 105
of traditional checkpointing approaches before discussing error detection and recovery mechanisms. A. Checkpointing Traditional (coordinated) checkpointing has been studied for many years. The major appeal of the coordinated approach is its simplicity, because a parallel job using n processors of individual MTBF Mind can be viewed as a single processor job with MTBF µ = Mnind . Given the value of µ, an approximation of the optimal checkpointing period can be computed as a function of the key parameters (downtime D, checkpoint time C, and recovery time R). The first estimate had been given by Young [4] and later refined by Daly [5]. Both use a first-order approximation for Exponential failure distributions; their derivation is similar to the approach in Equations (6) and (7). More accurate formulas for Weibull failure distributions are provided in [11], [12], [13]. The optimal checkpointing period is known only for Exponential failure distributions [8]. Dynamic programming heuristics for arbitrary distributions are proposed in [14], [15], [8]. The literature proposes different works [16], [17], [18], [19], [20] on the modeling of coordinated checkpointing protocols. In particular, [17] and [16] focus on the usage of available resources: some may be kept as backup in order to replace the down ones, and others may be even shutdown in order to decrease the failure risk or to prevent storage consumption by saving fewer checkpoint snapshots. The major drawback of coordinated checkpointing protocols is their lack of scalability at extreme-scale. These protocols will lead to I/O congestion when too many processes are checkpointing at the same time. Even worse, transferring the whole memory footprint of an HPC application onto stable storage may well take so much time that a failure is likely to take place during the transfer! A few papers [20], [21] propose a scalability study to assess the impact of a small MTBF (i.e., of a large number of processors). The mere conclusion is that checkpoint time should be dramatically reduced for platform waste to become acceptable, which motivated the instantiation
of optimistic scenarios in Section IV. All the above approaches maintain a single checkpoint. If the checkpoint file includes errors, the application faces an irrecoverable failure and must restart from scratch. This is because error detection latency is ignored in traditional rollback and recovery schemes. These schemes assume instantaneous error detection (therefore mainly targeting fail-stop failures) and are unable to accommodate silent errors. B. Error detection Considerable efforts have been directed at error-checking to reveal latent errors. Most techniques combine redundancy at various levels, together with a variety of verification mechanisms. The oldest and most drastic approach is at the hardware level, where all computations are executed in triplicate, and majority voting is enforced in case of different results [10]. Error detection approaches include memory scrubbing [22], fault-tolerant algorithms [23], [24], [25], ABFT techniques [26], [27] and critical MPI message validation [28]. We refer to Lu, Zheng and Chien [3] for a comprehensive list of techniques and references. As already mentioned, our work is agnostic of the underlying error-detection technique and takes the cost of verification as an input parameter to the model (see Section III). VI. C ONCLUSION In this paper, we revisit traditional checkpointing and rollback recovery strategies. Rather than considering fail-stop failures, we focus on silent data corruption errors. Such latent errors cannot be neglected anymore in High Performance Computing, in particular in sensitive and high precision simulations. The core difference with fail-stop failures is that error detection is not immediate. We discuss and analyze two models. In the first model, errors are detected after some delay following a probability distribution (typically, an Exponential distribution). We compute the optimal checkpointing period in order to minimize the waste when all checkpoints can be kept in memory, and we
show that this period does not depend on the distribution of detection times. In practice, only a few checkpoints can be kept in memory, and hence it may happen that an error was detected after the last correct checkpoint was removed from storage. We derive a minimum value of the period to guarantee, within a risk threshold, that at least one valid checkpoint remains when a latent error is detected. A more realistic model assumes that errors are detected through some verification mechanism. Periodically, one checks whether the current status is meaningful or not, and then eventually detects a latent error. We discuss both the case where the periodic pattern includes k checkpoints for one verification (large cost of verification), and the opposite case with k verifications for one checkpoint (inexpensive cost for verification). We express a formula for the waste in both cases, and, from these formulas, we derive the optimal period. The various models are instantiated with realistic parameters, and the evaluation results clearly corroborate the theoretical analysis. For the first model, with detection times, the tradeoff between waste and risk of irrecoverable error clearly appears, hence showing that a period larger than the one minimizing the irrecoverable-failure-free waste should often be chosen to achieve an acceptable risk. The advantage of the second model is that there are no irrecoverable failures (within each period, there is a verification followed by a checkpoint, hence ensuring a valid checkpoint). We compute the optimal pattern of checkpoints and verifications per period, as a function of their respective cost, to minimize the waste. The pattern with more checkpoints than verification turns out to be usable only when the cost of checkpoint is much lower than the cost of verification, and the conclusion is that it is often more efficient to verify the result every other checkpoint. Overall, we provide a thorough analysis of checkpointing models for latent errors, both analyzing the models analytically, and evaluating them through different scenarios. A future research direction would be to study more general scenarios of multiple checkpointing, for instance by keeping not the consecutive k last checkpoints in the first model, but rather some older checkpoints to decrease the risk. In the second model, more verification/checkpoint combinations could be studied, while we focused on cases with an integer number of checkpoints per verification (or the converse). Acknowledgments. This work was supported in part by the ANR RESCUE project. A. Benoit and Y. Robert are with the Institut Universitaire de France. R EFERENCES [1] J. Dongarra, P. Beckman, P. Aerts, F. Cappello, T. Lippert, S. Matsuoka, P. Messina, T. Moore, R. Stevens, A. Trefethen, and M. Valero, “The international exascale software project: a call to cooperative action by the global high-performance community,” Int. Journal of High Performance Computing Applications, vol. 23, no. 4, pp. 309–322, 2009. [2] A. Moody, G. Bronevetsky, K. Mohror, and B. R. d. Supinski, “Design, Modeling, and Evaluation of a Scalable Multi-level Checkpointing System,” in Proc. of the ACM/IEEE SC Conf., 2010, pp. 1–11. [3] G. Lu, Z. Zheng, and A. A. Chien, “When is multi-version checkpointing needed,” in 3rd Workshop for Fault-tolerance at Extreme Scale (FTXS). ACM Press, 2013, https://sites.google.com/site/uchicagolssg/ lssg/research/gvr.
[4] J. W. Young, “A first order approximation to the optimum checkpoint interval,” Comm. of the ACM, vol. 17, no. 9, pp. 530–531, 1974. [5] J. T. Daly, “A higher order estimate of the optimum checkpoint interval for restart dumps,” FGCS, vol. 22, no. 3, pp. 303–312, 2004. [6] “Maple sheets for the experiments,” http://graal.ens-lyon.fr/∼yrobert/ error-detection/. [7] F. Cappello, A. Geist, B. Gropp, L. Kale, B. Kramer, and M. Snir, “Toward Exascale Resilience,” Int. Journal of High Performance Computing Applications, vol. 23, no. 4, pp. 374–388, 2009. [8] M. Bougeret, H. Casanova, M. Rabie, Y. Robert, and F. Vivien, “Checkpointing strategies for parallel jobs,” in Proc. of the ACM/IEEE SC Conf., 2011. [9] K. Ferreira, J. Stearley, J. H. I. Laros, R. Oldfield, K. Pedretti, R. Brightwell, R. Riesen, P. G. Bridges, and D. Arnold, “Evaluating the Viability of Process Replication Reliability for Exascale Systems,” in Proc. of the ACM/IEEE SC Conf., 2011. [10] R. E. Lyons and W. Vanderkulk, “The use of triple-modular redundancy to improve computer reliability,” IBM J. Res. Dev., vol. 6, no. 2, pp. 200–209, 1962. [11] Y. Ling, J. Mi, and X. Lin, “A variational calculus approach to optimal checkpoint placement,” IEEE Trans. on computers, pp. 699–708, 2001. [12] T. Ozaki, T. Dohi, H. Okamura, and N. Kaio, “Distribution-free checkpoint placement algorithms based on min-max principle,” IEEE TDSC, pp. 130–140, 2006. [13] M.-S. Bouguerra, T. Gautier, D. Trystram, and J.-M. Vincent, “A flexible checkpoint/restart model in distributed systems,” in PPAM, ser. LNCS, vol. 6067, 2010, pp. 206–215. [Online]. Available: http://dx.doi.org/10.1007/978-3-642-14390-8 22 [14] S. Toueg and O. Babaoglu, “On the optimum checkpoint selection problem,” SIAM J. Computing, vol. 13, no. 3, pp. 630–649, 1984. [15] M.-S. Bouguerra, D. Trystram, and F. Wagner, “Complexity Analysis of Checkpoint Scheduling with Variable Costs,” IEEE Transactions on Computers, vol. 99, no. PrePrints, 2012. [16] J. S. Plank and M. G. Thomason, “Processor allocation and checkpoint interval selection in cluster computing systems,” J. of Parallel and Distributed Computing, vol. 61, p. 1590, 2001. [17] H. Jin, Y. Chen, H. Zhu, and X.-H. Sun, “Optimizing HPC Fault-Tolerant Environment: An Analytical Approach,” in Parallel Processing (ICPP), 2010, 2010, pp. 525–534. [18] L. Wang, P. Karthik, Z. Kalbarczyk, R. Iyer, L. Votta, C. Vick, and A. Wood, “Modeling Coordinated Checkpointing for Large-Scale Supercomputers,” in Proc. of ICDSN, 2005, pp. 812–821. [19] R. Oldfield, S. Arunagiri, P. Teller, S. Seelam, M. Varela, R. Riesen, and P. Roth, “Modeling the impact of checkpoints on next-generation systems,” in Proc. of IEEE MSST, 2007, pp. 30–46. [20] Z. Zheng and Z. Lan, “Reliability-aware scalability models for high performance computing,” in Proc. of IEEE Cluster, 2009. [21] F. Cappello, H. Casanova, and Y. Robert, “Preventive migration vs. preventive checkpointing for extreme scale supercomputers,” Parallel Processing Letters, vol. 21, no. 2, pp. 111–132, 2011. [22] A. A. Hwang, I. A. Stefanovici, and B. Schroeder, “Cosmic rays don’t strike twice: understanding the nature of dram errors and the implications for system design,” SIGARCH Comput. Archit. News, vol. 40, no. 1, pp. 111–122, 2012. [23] G. Bronevetsky and B. de Supinski, “Soft error vulnerability of iterative linear algebra methods,” in Proc. 22nd Int. Conf. on Supercomputing, ser. ICS ’08. ACM, 2008, pp. 155–164. [24] M. Heroux and M. Hoemmen, “Fault-tolerant iterative methods via selective reliability,” Sandia National Laboratories, Research report SAND2011-3915 C, 2011. [25] M. Shantharam, S. Srinivasmurthy, and P. Raghavan, “Characterizing the impact of soft errors on iterative methods in scientific computing,” in Proc. 25th Int. Conf. on Supercomputing, ser. ICS ’11. ACM, 2011, pp. 152–161. [26] K.-H. Huang and J. A. Abraham, “Algorithm-based fault tolerance for matrix operations,” IEEE Trans. Comput., vol. 33, no. 6, pp. 518–528, 1984. [27] G. Bosilca, R. Delmas, J. Dongarra, and J. Langou, “Algorithm-based fault tolerance applied to high performance computing,” J. Parallel and Distributed Computing, vol. 69, no. 4, pp. 410 –416, 2009. [28] D. Fiala, F. Mueller, C. Engelmann, R. Riesen, K. Ferreira, and R. Brightwell, “Detection and correction of silent data corruption for large-scale high-performance computing,” in Proc. of the ACM/IEEE SC Int. Conf., 2012.