machines Article
One-Dimensional Haptic Rendering Using Audio Speaker with Displacement Determined by Inductance Avin Khera 1,† , Randy Lee 1,† , Avi Marcovici 1,2,† , Zhixuan Yu 3,† , Roberta Klatzky 4 , Mel Siegel 5 , Sanjeev G. Shroff 1 and George Stetten 1,3,5, *,† 1
2 3 4 5
* †
Bioengineering Department, University of Pittsburgh, 302 Benedum Hall, Pittsburgh, PA 15261, USA;
[email protected] (A.K.);
[email protected] (R.L.);
[email protected] (A.M.);
[email protected] (S.G.S.) Mechanical Engineering Department, ORT Braude Academic College of Engineering, Snunit St 51, Karmiel 2161002, Israel Biomedical Engineering Department, Carnegie Mellon University, 5000 Forbes Avenue, Pittsburgh, PA 15213, USA;
[email protected] Psychology Department, Carnegie Mellon University, 5000 Forbes Avenue, Pittsburgh, PA 15213, USA;
[email protected] Robotics Institute, Carnegie Mellon University, 5000 Forbes Avenue, Pittsburgh, PA 15213, USA;
[email protected] Correspondence:
[email protected]; Tel.: +1-412-624-7762; Fax: +1-412-624-3699 These authors contributed equally to this work.
Academic Editor: David Mba Received: 30 November 2015; Accepted: 11 March 2016; Published: 21 March 2016
Abstract: We report overall design considerations and preliminary results for a new haptic rendering device based on an audio loudspeaker. Our application models tissue properties during microsurgery. For example, the device could respond to the tip of a tool by simulating a particular tissue, displaying a desired compressibility and viscosity, giving way as the tissue is disrupted, or exhibiting independent motion, such as that caused by pulsations in blood pressure. Although limited to one degree of freedom and with a relatively small range of displacement compared to other available haptic rendering devices, our design exhibits high bandwidth, low friction, low hysteresis, and low mass. These features are consistent with modeling interactions with delicate tissues during microsurgery. In addition, our haptic rendering device is designed to be simple and inexpensive to manufacture, in part through an innovative method of measuring displacement by existing variations in the speaker’s inductance as the voice coil moves over the permanent magnet. Low latency and jitter are achieved by running the real-time simulation models on a dedicated microprocessor, while maintaining bidirectional communication with a standard laptop computer for user controls and data logging. Keywords: haptics; loudspeaker; speaker; inductance; displacement; surgery; microsurgery
1. Introduction Comparison to Existing Haptic Rendering Devices Researchers in haptics make extensive use of rendering devices capable of producing the sensation of touch as would occur during interactions with objects in the environment. A broad class of such devices consists of a stationary base supporting a movable component upon which forces are generated relative to the base, in response to translation and/or rotation by an external agent. Most systems presently available to consumers and researchers depend on mechanical linkages to generate these Machines 2016, 4, 9; doi:10.3390/machines4010009
www.mdpi.com/journal/machines
Machines 2016, 4, 9
2 of 12
forces and provide mobility. Of those, some, such as the Novint Falcon or the Force Dimension Omega, use parallel linkage mechanisms to generate forces—typically in the three translational degrees of freedom (DOF)—on a control ball or stylus, which is held by the user at the front of the device. The Novint Falcon can generate up to 8.9 N force over a 10 ˆ 10 ˆ 10 cm workspace. The Force Dimension Omega (model 7) can generate up to 12 N force over a cylindrical workspace 16 cm in diameter ˆ13 cm in length. Another popular device in research is the Geomagic Touch (formerly Sensable Phantom Omni), in which a set of single linkages enables a stylus to move in all six DOF, with force feedback restricted to the 3 translational DOF. The Geomagic Touch can generate up to 3.3 N force over a 16 ˆ 12 ˆ 7 cm workspace. Since haptic renderers combine mechanical and electrical characteristics in an application accessible to a wide audience, simple 1-DOF haptic interfaces have been developed as educational tools for engineering curricula. For example, Okamura and colleagues developed a “haptic paddle”, a single-axis force feedback joystick, for use in dynamic systems courses at Stanford University [1]. Users can move the paddle, which is shaped like an inverted pendulum, side-to-side over a ˘35˝ range of motion. Feedback forces change with paddle position and velocity, and are generated by a DC motor, producing up to 7.5 N on the handle. Gassert and colleagues have adapted the haptic paddle design for use at ETH Zurich, adding a number of sensors and USB data collection for ease of use in an educational laboratory setting [2]. At the University of Michigan, Gillespie and colleagues have designed two haptic interfaces, the iTouch motor and the Box, for use in undergraduate mechanical engineering and electrical engineering courses. These two renderers are single-axis haptic interfaces that make use of voice coil actuators and brushed motors respectively for force generation [3]. Similarly to the haptic paddles just discussed, the iTouch can move side to side over a 30˝ range of motion, generating up to 0.2 Nm torque on the handle. The Box is a larger haptic device, driven by a motor, sprocket, and chain mechanism, which can generate up to 5.4 Nm torque on a wheel that is held by the user. To avoid problems associated with mechanical linkage mechanisms, Hollis developed a magnetically levitated haptic renderer [4], recently commercialized as the Maglev 200 from Butterfly Haptics. This desk-mounted haptic renderer utilizes Lorenz forces to actuate forces and torques in six DOF on a flotor levitated between permanent magnets, while location and angle are determined in six DOF by high-resolution optical tracking. Because there are no mechanical linkages, forces and torques on the flotor are rendered without significant frictional losses or mechanical backlash. The Maglev can generate up to 40 N of force and 3.6 Nm of torque over a 2.4-cm-diameter spherical workspace. It also operates at higher frequencies than the above-mentioned mechanically linked systems, changing position at 140 Hz and generating forces at greater than 2 KHz. We have used the Maglev in experiments involving a new surgical tool that augments the surgeon’s sense of touch in delicate tissues [5], to understand the control of a needle while puncturing a membrane to minimize damage to the underlying tissues [6], and to differentiate between such punctures performed by dominant and non-dominant hands [7]. While it has been a valuable testbed for the experiments just described, the relatively large mass of the flotor (~500 g) in the Maglev makes it less than ideal for modeling delicate tissue. Furthermore, the Maglev does not directly measure the force and torque applied to the flotor by the user, but rather must infer these through their effect on linear and angular acceleration of the flotor, putting limits on the bandwidth of such measurements. We describe here development of a simpler, less massive platform that exhibits many of the advantageous features of the Maglev, albeit with only one DOF rather than six. We take advantage of an existing commercial device with high bandwidth, low mass, low mechanical resistance, and significant force: the audio loudspeaker. In particular, we use low-frequency speakers (woofers). Even a fairly small woofer can have a relatively high displacement (1 cm), and sufficient bandwidth and force for our purposes. The moving portion of the woofer is generally a light but rigid paper cone, suspended in 1-DOF by a ring of elastic material, driven by a voice coil that surrounds but does not
Machines 2016, 2016, 4, 4, 99 Machines
33 of of 12 12
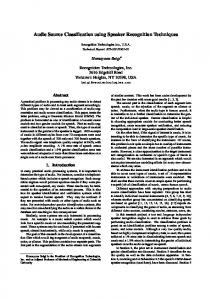
not touch a permanent magnet. Thus velocity dependent forces (mechanical resistance) are minimal, touch a permanent magnet. Thus velocity dependent forces (mechanical resistance) are minimal, because of low air resistance at the velocities we expect the paper cone to be moving. because of low air resistance at the velocities we expect the paper cone to be moving. In the following section, we review our progress, thus far, in developing our speaker-based In the following section, we review our progress, thus far, in developing our speaker-based haptic renderer. In particular, we describe (1) the overall design incorporating a scaffold to provide a haptic renderer. In particular, we describe (1) the overall design incorporating a scaffold to provide mechanical interface for the user with an independent force sensor; (2) a method of determining a mechanical interface for the user with an independent force sensor; (2) a method of determining displacement from the inductance of the speaker itself, and (3) a separate method of determining displacement from the inductance of the speaker itself, and (3) a separate method of determining displacement using an optical reflectance sensor; and (4) a computational architecture that provides displacement using an optical reflectance sensor; and (4) a computational architecture that provides high bandwidth, low jitter, and low latency, while preserving flexibility in the user interface and high bandwidth, low jitter, and low latency, while preserving flexibility in the user interface and data data logging capabilities. logging capabilities. 2. Experimental Section 2. Experimental Section 2.1. 2.1. Overall Overall Design Design of of Speaker-Based Speaker-Based Haptic Haptic Rendering Rendering Device Device Our hapticrendering rendering system a loudspeaker effect displacement ofcomponent the mobile Our haptic system uses uses a loudspeaker to effect to displacement of the mobile of component of a 1-DOF haptic renderer, taking advantage of the low friction and inertia exhibited by a 1-DOF haptic renderer, taking advantage of the low friction and inertia exhibited by this inexpensive this inexpensive commercial 1 shows the design (SolidWorks) our initial commercial device. Figure 1device. showsFigure the design (SolidWorks) of our initial of prototype asprototype well as a as well as a photograph of the actual device. A custom plastic scaffold, produced using photograph of the actual device. A custom plastic scaffold, produced using stereolithography, is stereolithography, is attached to the central ring of the speaker cone to move up and down as a unit. attached to the central ring of the speaker cone to move up and down as a unit. The scaffold is made The is made stiff andoflightweight by use of hollowan beams, supporting point stiff scaffold and lightweight by use hollow beams, supporting attachment pointan forattachment user interaction. for user interaction. Here, willscalpels, attach mock needles,interaction scalpels, etc., interaction with Here, users will attach mockusers needles, etc., enabling withenabling simulated tissues during simulated tissues during psychophysics experiments. psychophysics experiments.
Figure Speaker-Based Haptic Rendering Device. (a) Design customwith scaffold with Figure 1.1.Speaker-Based Haptic Rendering Device. (a) Design showingshowing custom scaffold supporting supporting attachment point for user interaction, and force sensor with preload spring, allowing attachment point for user interaction, and force sensor with preload spring, allowing measurement of measurement both push(b) andActual pull forces; both push andofpull forces; device.(b) Actual device.
The paper cone of the speaker can be made to move up or down with its attached scaffold by The paper cone of the speaker can be made to move up or down with its attached scaffold by introducing a directional current in the speaker’s voice coil, which is mounted over a permanent introducing a directional current in the speaker’s voice coil, which is mounted over a permanent magnet mounted to the metal frame of the speaker. The suspension of the cone is stabilized by a magnet mounted to the metal frame of the speaker. The suspension of the cone is stabilized by spider, a centering spring and damper whose compliance returns the cone to the middle of its a spider, a centering spring and damper whose compliance returns the cone to the middle of its displacement range at rest. We have chosen an 80-Watt 5-inch loudspeaker (Faital Pro 5FE120) displacement range at rest. We have chosen an 80-Watt 5-inch loudspeaker (Faital Pro 5FE120) designed designed for midrange to bass frequencies, and capable of delivering 10 N of sustained force (as for midrange to bass frequencies, and capable of delivering 10 N of sustained force (as determined determined below). Its maximum displacement range is approximately 1 cm in each direction from below). Its maximum displacement range is approximately 1 cm in each direction from the rest point. the rest point. During normal operation in the audio range of 20 Hz to 20 KHz, the displacement is During normal operation in the audio range of 20 Hz to 20 KHz, the displacement is far less, allowing far less, allowing the compliance of the spider to be assumed linear. This linearity is important in the compliance of the spider to be assumed linear. This linearity is important in audio systems to avoid audio systems to avoid distortion. Our application, however, while benefiting from the ability of the distortion. Our application, however, while benefiting from the ability of the speaker to react at such speaker to react at such frequencies, also employs frequencies all the way down to direct current frequencies, also employs frequencies all the way down to direct current (DC), permitting us to move (DC), permitting us to move the cone to any desired displacement and hold it there. Our unorthodox the cone to any desired displacement and hold it there. Our unorthodox application thus results in application thus results in greater displacements than normally used for a speaker, requiring
Machines 2016, 4, 9
4 of 12
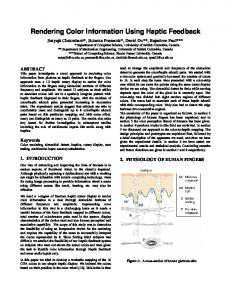
greater displacements than normally used for a speaker, requiring consideration of the non-linearity of its compliance. This, and other considerations, require us to know the actual displacement of the speaker at any given time, as will be discussed below. In determining the useful range of displacements generated by DC currents in the coil, it is important to consider the maximum power rating of the speaker. For our speaker, this is reported by the manufacturer to be 80 W, which, given 5.4 Ω electrical resistance at DC, would seem to imply a maximum DC voltage of 21 V, since DC power equals V 2 /R. We have found, however, that the safe maximum DC voltage is signficantly less, approximately 10 V. This discrepancy is due to the fact that the manufacturer’s reported maximum power is for audio frequencies, at which much of the energy put into the coil is dissipated as sound instead of heat in the coil. At DC, all of the energy is dissipated as heat, and so the voltage must be less to avoid melting the coil. We have included a force sensor (Honeywell FS-01) mounted between the attachment point and the scaffold, with a preload spring allowing measurement of push and pull forces exerted by the user at the attachment point (see Figure 1). The sensor has a total range of 6.7 N with precision of approximately ˘0.03 N and accuracy of approximately ˘0.07 N. We could theoretically compute the externally applied force without a sensor, based on the displacement of the speaker and the force delivered by the voice coil, as is done with the Maglev system described above. However, we choose to include the sensor because it provides an independent measurement with greater accuracy and speed than could be provided by such calculations. 2.2. Measuring Displacement with Inductance As a first approximation, the displacement of a speaker at steady state is proportional to the current in its voice-coil, and thus displacement might be predictable from that current. However, for a number of reasons, we require independent measurement of speaker displacement. As noted, we are moving the cone further than in normal audio applications, operating it in the range of non-linear compliance. A further nonlinearity is introduced as the voice-coil moves relative to the permanent magnet, because the force produced by a given current changes as more or less of the voice coil is positioned over the permanent magnet. Both of these nonlinearities could be compensated for by calibration. However, in our application the user will apply additional forces to the attachment point, so displacement can no longer be predicted from coil current alone. Thus we need an independent measurement of displacement. Various technologies are available to measure displacement, including those based on resistance, capacitance, inductance, reluctance, optical encoding, reflected and transmitted light intensity, and coherent light. Some of these require physical contact, which would increase the mass of the moving component, while others do not. Each has advantages and disadvantages in terms of accuracy, range, complexity, expense, etc. We choose instead to make use of information provided by the speaker itself, namely, changes in the electrical inductance of the voice coil as it moves over the permanent magnet. Electrical inductance is a component of electrical impedance, whose magnitude can be measured by injecting a sinusoidal voltage and monitoring the resulting sinusoidal current at the same frequency. The impedance of a speaker, as a function of frequency, is due to a number of sources, both electrical and mechanical. If we understand these sources, we can isolate the coil’s electrical inductance from its total electrical and mechanical impedance. Electromechanical systems are often understood in terms of lumped parameter models. Figure 2 shows a simplified lumped parameter model for a speaker adapted from [8], with terms defined in Table 1. The left and right halves of the diagram depict, respectively, the electrical and mechanical properties of the speaker. Notice that electrical symbols are used on both sides, representing, on the right side, their analogous mechanical properties, i.e., inductance represents mass, resistance represents friction or damping, and capacitance represents compliance. The mass of the moving portion (cone + voice-coil + scaffold, etc.) is represented by “inductance” Mms . The air resistance of
Machines 2016, 4, 9
5 of 12
the cone2016, and4, damping in the spider is shown as Rms . The mechanical compliance is represented Machines 9 5 ofby 12 Machines 2016, 4, 9 5 of 12 “capacitance” Cms (x), and is a function of displacement x because, as noted above, it is nonlinear at the extremes of displacement. Ontothe electricalZside the model, wewith havedisplacement the DC resistance Re and the the electrical impedance due inductance L(x),of which changes and thus should the electrical impedance due to inductance ZL(x), which changes with displacement and thus should electrical to inductance ZL (x), which changes with displacement andother thus should allow allow us impedance to make a due measurement of displacement, if we can isolate it from the elements in allow us to make a measurement of displacement, if we can isolate it from the other elements in us to make a measurement of displacement, if we can isolate it from the other elements in the model. the model. the model.
Figure 2. Lumped parameter model of a loudspeaker, relating electrical and mechanical properties in Figure Figure2.2. Lumped Lumped parameter parameter model model of of aa loudspeaker, loudspeaker,relating relatingelectrical electricaland andmechanical mechanicalproperties propertiesin in terms of impedance (see Table 1 for definition of terms). terms termsof ofimpedance impedance(see (seeTable Table11for fordefinition definitionofofterms). terms). Table 1. Parameters in in Lumped Model Model (see Figure Figure 2). Table Table1.1.Parameters Parameters inLumped Lumped Model(see (see Figure2). 2).
Parameter Parameter Parameter Re Re Re
ZL(x) ZL(x)
ZL (x)
Bl(x) Bl(x)
Bl(x)
Cms(x) Cms (x) C (x) ms
Mms MM ms ms Rms Rms Rms
Description Value in Specified Speaker Description ValueininSpecified Specified Speaker Description Value Speaker Electrical resistance at DC 5.4 Ω Electrical resistance at DC 5.4 Ω Electrical resistance at DC varies with 5.4 Ω Electrical impedance due to inductance, Electrical impedance due to inductance, varies with see Figure 3 see Figure 3 Electrical impedance due to inductance, varies with voice-coil displacement x over magnet. see Figure 3 voice-coil displacement x over magnet. voice-coil displacement x over magnet. Electro-dynamical force factor, varies with Electro-dynamical force factor, varies with 6.9 N/amp (at rest) 6.9 N/amp (at rest) Electro-dynamical force factor, with voice-coil displacement x overvaries magnet. 6.9 N/amp (at rest) voice-coil displacement x over magnet. voice-coil displacement x over magnet. Compliance of mechanical suspension, varies with Compliance of mechanical suspension, varies with 0.55 mm/N at rest (x = 0 mm) Compliance mechanical suspension, varies with 0.55 mm/N at rest (x = 0 mm) voice-coilofdisplacement x over magnet. 0.55 mm/N at rest (x = 0 mm) voice-coil overmagnet. magnet. voice-coildisplacement displacement xx over Mechanical mass of loudspeaker diaphragm Mechanical mass of loudspeaker diaphragm 11 g (23 g with scaffold and Mechanical massair of loudspeaker diaphragm g with scaffold and assembly, including load and voice coil (plus 11 g11(23g g(23 scaffold and force assembly, including air load and voice forcewith sensor included) assembly, including air load and voicecoil coil(plus force sensor included) sensor included) added masses). added masses). (plus added masses). Mechanical friction and drag of total loudspeaker. Negligible at low velocity Mechanical friction totalloudspeaker. loudspeaker. Negligible low velocity Mechanical frictionand anddrag drag of of total Negligible atat low velocity
Figure 3. Impedance magnitude of the speaker used in our prototype as a function of frequency Figure3.3.Impedance Impedancemagnitude magnitude speaker used in prototype our prototype as a function of frequency Figure of of thethe speaker used in our as a function of frequency across across the audio range (adapted from Faital Pro 5FE120 specification). across therange audio(adapted range (adapted fromPro Faital Pro 5FE120 specification). the audio from Faital 5FE120 specification).
The transduction between the electrical and mechanical halves of the lumped parameter model The transduction between the electrical and mechanical halves of the lumped parameter model The transduction the electrical andfactor mechanical of thefor lumped parameter is is represented by the between electro-dynamical force Bl(x), halves accounting energy transfermodel in both is represented by the electro-dynamical force factor Bl(x), accounting for energy transfer in both representedElectrical by the electro-dynamical force coil factor Bl(x), accounting for energy in both directions. current in the voice I causes the mechanical forcetransfer that moves thedirections. speaker, directions. Electrical current in the voice coil I causes the mechanical force that moves the speaker, Electrical current in mechanical the voice coil I causes the mechanical force the speaker, represented on represented on the side by “voltage” V. Energy is that also moves transferred in the other direction, represented on the mechanical side by “voltage” V. Energy is also transferred in the other direction, with mechanical motion of the coil resulting in an opposing electrical voltage in the voice coil. Thus with mechanical motion of the coil resulting in an opposing electrical voltage in the voice coil. Thus mechanical properties of the speaker (such as its mechanical resonance) show up as part of its mechanical properties of the speaker (such as its mechanical resonance) show up as part of its electrical impedance. electrical impedance.
Machines 2016, 4, 9
6 of 12
the mechanical side by “voltage” V. Energy is also transferred in the other direction, with mechanical motion of the coil resulting in an opposing electrical voltage in the voice coil. Thus mechanical Machines 2016, 4, 9 6 of 12 properties of the speaker (such as its mechanical resonance) show up as part of its electrical impedance. The electrical impedance as as aa function of frequency for our speaker is is shown in The electrical impedance function of frequency for our particular particular speaker shown in Figure 3. Impedance is a complex quantity, and the graph displays only its magnitude. The impedance Figure 3. Impedance is a complex quantity, and the graph displays only its magnitude. The extends from the electrical DCelectrical resistance (not shown at 0 Hz due at to 0logarithmic scale), up through impedance extends from the DCReresistance Re (not shown Hz due to logarithmic scale), mechanical resonance at approximately 60 Hz. The mechanical resonance is due to a minimum up through mechanical resonance at approximately 60 Hz. The mechanical resonance is due toin a the mechanical impedance at that frequency, with the mass and compliance establishing a resonant minimum in the mechanical impedance at that frequency, with the mass and compliance system. Thisaminimum impedance translatedimpedance into a maximum electricalinto impedance by establishing resonantmechanical system. This minimum is mechanical is translated a maximum Bl(x), which, as may be recalled, converts electrical current into mechanical “voltage,” thus replacing electrical impedance by Bl(x), which, as may be recalled, converts electrical current into mechanical the definition impedance its reciprocal. “voltage,” thusofreplacing the with definition of impedance with its reciprocal. At higher frequencies, Figure of At higher frequencies, Figure 33 shows shows aa slowly slowly increasing increasing value value due due primarily primarily to to inductance inductance of the voice coil. As already noted, Z (x) changes as the voice coil moves over the ferromagnetic material the voice coil. As already noted,L ZL(x) changes as the voice coil moves over the ferromagnetic in the permanent magnet, and it is this value use we for will computing It also changes material in the permanent magnet, and it iswe thiswill value use fordisplacement. computing displacement. It as a function of frequency, increasing because of the fundamental nature of inductance: also changes as a function of frequency, increasing because of the fundamental nature of inductance:
Z = jωL jw L ZL “
(1) (1)
where ω𝜔 isisfrequency frequencyininradians radiansper persecond secondand andLLisisthe theinductance. inductance. where To measure Z L(x), we introduce a sinusoidal voltage at a frequency well above mechanical To measure ZL (x), we introduce a sinusoidal voltage at a frequency well above mechanical resonance, andininfact, fact,above above audio range entirely, to create an audible signal. For resonance, and thethe audio range entirely, so asso notastonot create an audible signal. For reasons reasons discussed below, havethat chosen that frequency to be 30 KHz. discussed below, we have we chosen frequency to be 30 KHz. Figure 4 shows the configuration of our system to measure the impedance ZLinductance. (x) due to Figure 4 shows the configuration of our system to measure the impedance ZL (x) due to inductance. Alinear high-power linear push-pull amplifier (PA74A, Apex Microtechnology) used to A high-power push-pull amplifier (PA74A, Apex Microtechnology) was used to movewas the speaker move the speaker with low-frequency (including DC) current, as well as to introduce the 30 with low-frequency (including DC) current, as well as to introduce the 30 KHz signal, with theKHz two signal, with the twobefore signals added before the amplifier. Since the amplifier is essentially a signals being added thebeing amplifier. Since the amplifier is essentially a voltage source, changes in voltage source, changes in Z30 L(x) result in changes in the 30 KHz voltage across the transformer ZL (x) result in changes in the KHz voltage across the transformer primary in series with the speaker. primary in series with the speaker. air-core transformer was used to avoid due to An air-core transformer was used toAn avoid non-linearity due to saturation in anon-linearity ferromagnetic core. saturation in a ferromagnetic core. The transformer was constructed from two coils (Jantzen Audio The transformer was constructed from two coils (Jantzen Audio 0.50 mH Crossover Coil) mounted 0.50 mH and Crossover Coil) mounted adjacentinand KHz voltage in thedetector secondary was adjacent coaxially. The 30 KHz voltage the coaxially. secondaryThe was30 processed by a peak to yield processed by a peak detector to yield voltage V out. The peak detector produced a greater voltage voltage V out . The peak detector produced a greater voltage when the inductance of the speaker was when inductance of the coil speaker wastransformer reduced, because theformed speaker coil anddivider the transformer reduced,the because the speaker and the primary a voltage across the primary formed a voltage divider across the linear amplifier output. linear amplifier output.
Figure 4. Configuration Configuration of of system system to control speaker displacement and measure displacement by means of changes in inductance.
To achieve aa maximum maximum change changein inVVout with ZL(x), we matched the impedance of the transformer To achieve out with ZL (x), we matched the impedance of the transformer primary Z T with that of the voice coil at rest, ZL(0), approximately 0.50 mH. Let us denote the primary ZT with that of the voice coil at rest, ZL (0), approximately 0.50 mH. Let us denote the amplitude amplitude of the 30 KHzatsinusoid at theoutput amplifier output as VS. Assuming that Re is much less than of the 30 KHz sinusoid the amplifier as V S . Assuming that Re is much less than |ZL (x)| |Z L(x)| at 30 KHz (which is supported by Figure 3), and assuming that the DC resistance of the at 30 KHz (which is supported by Figure 3), and assuming that the DC resistance of the transformer transformer primary is negligible (its wire gage is much thicker than the voice coil), and that the transformer and peak detector are both 100% efficient, then a reasonable approximation for Vout is:
Vout = VS
ZT ZT + ZL ( x )
(2)
Machines 2016, 4, 9
7 of 12
primary is negligible (its wire gage is much thicker than the voice coil), and that the transformer and peak detector are both 100% efficient, then a reasonable approximation for V out is: Machines 2016, 4, 9
|ZT | 7 of 12 (2) |ZT | ` |ZL pxq| which changes monotonically with impedance ZL(x), and thus with displacement x. Proper which changes impedancemeasurement ZL (x), and thus displacement x. Proper calibration calibration of monotonically Vout against anwith independent of with displacement should therefore permit of V against an independent measurement of displacement should therefore permit determination out determination of x by inductance. of x by inductance. We have chosen 30 KHz, because at higher frequencies the circuit shown in Figure 4 encounters We have 30 KHz, because higher frequencies theresulting circuit shown Figure currents 4 encounters an an additionalchosen resistance Reddy (not atshown in Figure 2) fromin eddy in the additional resistance R (not shown in Figure 2) resulting from eddy currents in the ferromagnetic ferromagnetic magneteddy of the speaker. At a high enough frequency, Reddy dominates the coil magnet of theand speaker. At a in high enough(3), frequency, Reddythe dominates the of coil inductance, and shown inductance, as shown Equation this reduces sensitivity Vout to changes in as ZL(x) and in Equation (3), this reduces the sensitivity of V to changes in Z (x) and thus to changes in x. out L thus to changes in x. Vout “ VS
|ZZT | T ˇ VV out “=V VSSˇˇ ˇ out ˇZZT `+ZZL pxqx`+RR eddy ˇ T
L
( )
(3) (3)
eddy
We Weexplored exploredthe theeffect effectofofRR eddy by by recording recording VVout out before and after placing a 400 g g weight weight on on the the eddy scaffold scaffold to to cause causeaaconsistent consistentdisplacement. displacement. This This displacement displacement changed changedVVout out by a a percentage percentage that that depended depended on on the the frequency frequency of ofthe thesinusoidal sinusoidalvoltage. voltage. Figure Figure 55 shows shows the theresulting resultingdata. data. Above Above the the upper thethe audio frequencies (20 KHz), the percentage decreases monotonically to zero because upperlimit limitofof audio frequencies (20 KHz), the percentage decreases monotonically to zero of increasing Reddy . Reddy. because of increasing
Figure caused by by displacement displacement by Figure5. 5. Percentage Percentagechange changein inVVout out caused by 400 400 gg weight weight goes goes to to zero zero as as resistance resistance RReddy comes to dominate coil inductance at high frequencies. eddy comes to dominate coil inductance at high frequencies.
These results results led led us us to tochoose choose aafrequency frequency just just above abovethe the audio audio range range at at 30 30 KHz KHz to to measure measure the the These coilinductance. inductance. coil 2.3. 2.3. Optical Optical Displacement Displacement Measurement Measurement To To provide provide aa means means ofof evaluating evaluating the the inductance-based inductance-based displacement displacement measurement, measurement, we we implemented high-speed system to measure speakerspeaker displacement based onbased a reflective implementedananindependent independent high-speed system to measure displacement on a optical sensor (Vishay This device consists an infrared at 940 nm reflective optical sensorTCRT5000L). (Vishay TCRT5000L). This deviceof consists of an emitter infraredoperating emitter operating at and in a leaded blocksthat visible light. As shown 6, ainlightweight 940 phototransistor nm and phototransistor in package a leadedthat package blocks visible light.in AsFigure shown Figure 6, a diffuse reflector (made of stiff paper) was paper) glued to theglued outside of outside the speaker cone. Thecone. reflector lightweight diffuse reflector (made of stiff was to the of the speaker The is wedge-shaped and positioned relative torelative the stationary optical sensor, thatsuch as the speaker reflector is wedge-shaped and positioned to the stationary opticalsuch sensor, that as the speaker moves down the reflector moves closer to the sensor and also presents a wider area to the sensor. The apparatus, thus, provides a voltage that varies monotonically with displacement, whether generated by current through the speaker coil or force independently applied to the speaker. The optical system was calibrated to a mechanical gage, as discussed below, and will be used in evaluating the inductance-based measure. Assuming the new inductance-based measure proves
Machines 2016, 4, 9
8 of 12
moves down the reflector moves closer to the sensor and also presents a wider area to the sensor. The apparatus, thus, provides a voltage that varies monotonically with displacement, whether generated by current through the speaker coil or force independently applied to the speaker. The optical system was calibrated to a mechanical gage, as discussed below, and will be used in evaluating the inductance-based measure. Assuming the new inductance-based measure proves accurate enough, we will no longer require the optical system in subsequent devices. Until such time, however, the optical Machines 2016, 4, 9 8 of 12 system will serve to provide a displacement measurement for haptic rendering.
Figure 6. speaker displacement using a reflective optical sensor and Figure 6. System Systemto toindependently independentlymeasure measure speaker displacement using a reflective optical sensor a wedge-shaped diffuse reflector attached to the outside of the speaker cone. and a wedge-shaped diffuse reflector attached to the outside of the speaker cone.
2.4. Real-Time Computation 2.4. Real-Time Computation and and Control Control Our application for the Our application for the haptic haptic rendering rendering device device involves involves simulating simulating tissues tissues for for microsurgical microsurgical intervention. Theinputs inputs these models include force applied byuser the as user as measured the intervention. The to to these models include force applied by the measured by the by sensor sensor in Figure 1, and displacement as measured by voice-coil inductance or optical reflectance as in Figure 1, and displacement as measured by voice-coil inductance or optical reflectance as just just described. The output from these models consists the voltage to thecoil voice coil to described. The output from these models consists of the of voltage appliedapplied to the voice to control control the speaker displacement. inputs outputs, wanttoto simulate simulate tool-tissue the speaker displacement. GivenGiven these these inputs and and outputs, wewe want tool-tissue interactions by generating generating forces forces and and displacements with various various relationships relationships to to each each other other and and to to interactions by displacements with time, using time, using feedback feedback from from the the force force sensor sensor and and displacement displacement measurements measurements to to guarantee guarantee accurate accurate rendering of these parameters. For this purpose, we have constructed a real-time computation platform rendering of these parameters. For this purpose, we have constructed a real-time computation (see Figure that includes a dedicated microprocessor (Analog Devices ADuC7026, platform (see7)Figure 7) that includes a dedicated microprocessor (Analog Devices ADuC7026,16 16ˆ× 12-bit 12-bit analog-to-digital, 44׈12-bit 12-bitdigital-to-analog) digital-to-analog) capable of operating a consistent rate of 5while KHz analog-to-digital, capable of operating at a at consistent rate of 5 KHz while providing real-time updates to reasonably complex models of tool-tissue interaction. providing real-time updates to reasonably complex models of tool-tissue interaction. The The microprocessor communicates to aa standard standard laptop laptop computer, computer, with microprocessor communicates to with the the microprocessor microprocessor acting acting as as the the master in protocol via via Serial (SPI), through master in aa master-slave master-slave communications communications protocol Serial Peripheral Peripheral Interface Interface (SPI), through an an intervening programmable interface (Wixel, from Pololu). The Wixel converts SPI to the universal serial intervening programmable interface (Wixel, from Pololu). The Wixel converts SPI to the universal bus (USB) This permits the computer to log data synchronously and provide graphical serial bus protocol. (USB) protocol. This permits the computer to log data synchronously anda provide a user interface (GUI) through which the researcher can issue low-bandwidth commands without graphical user interface (GUI) through which the researcher can issue low-bandwidth commands interrupting real-timereal-time operationoperation of the model. without interrupting of the model. The computer is currently logging 5 bytes of data during each cycle of of the the microprocessor’s microprocessor’s operation (5 KHz) without significant data loss, each byte requiring 2.5 µs from a total µs available operation (5 KHz) without significant data loss, each byte requiring 2.5 μs from200 a total 200 μs in each cycle. Given our current simple algorithm on the microprocessor real-time control available in each cycle. Given relatively our current relatively simple algorithm on the for microprocessor for of the haptic renderer, this leaves 140 µs ofthis idleleaves time in140 each fortime us toin tap, as our control real-time control of the haptic renderer, μscycle of idle each cycle for usalgorithms to tap, as become more complex and as we log complex additional values. our control algorithms become more and as we log additional values.
without interrupting real-time operation of the model. The computer is currently logging 5 bytes of data during each cycle of the microprocessor’s operation (5 KHz) without significant data loss, each byte requiring 2.5 μs from a total 200 μs available in each cycle. Given our current relatively simple algorithm on the microprocessor for Machines 2016, 4, 9 of the haptic renderer, this leaves 140 μs of idle time in each cycle for us to tap, 9 of 12 real-time control as our control algorithms become more complex and as we log additional values.
Figure System design for real-time model computation, high-level control, and data logging. Machines Figure 2016, 4, 7. 97. System design for real-time model computation, high-level control, and data logging.
9 of 12
3. Results Resultsand andDiscussion Discussion The optical displacement sensor was calibrated using a mechanical gage with a digital readout (iGaging 35-128 DigiIndi), shown in Figure 8. The gage has a nominal resolution of 0.01 mm and is mounted such such that thatits itscontact contactpoint pointrides rides and down with scaffold attached the speaker upup and down with the the scaffold attached to thetospeaker cone. cone.gage The was gagezeroed was zeroed the displacement resulting no current its coil. The at theat displacement resulting from from no current in its in coil. This This zero zero pointpoint was was affected byweight the weight the moving element the making gage, making it than lowerthe than the resting point affected by the of theofmoving element of the of gage, it lower resting point would would have been without the by approximately have been without the gage bygage approximately 1 mm. 1 mm.
Figure 8. Apparatus for calibration of displacement using mechanical gage, shown with a current in the voice coil causing the speaker cone to be displaced downward by 0.20 0.20 mm. mm.
Using the mechanical gage apparatus, we gathered readings from the optical and inductance Using the mechanical gage apparatus, we gathered readings from the optical and inductance systems at specific displacements over a −3 mm to +3 mm displacement range, using a precision systems at specific displacements over a ´3 mm to +3 mm displacement range, using a precision 5-turn potentiometer to control the DC voltage to the speaker. The results are shown in Figure 9 (red 5-turn potentiometer to control the DC voltage to the speaker. The results are shown in Figure 9 (red and green curves, respectively). and green curves, respectively). As can be seen, while the optical system is monotonic with displacement, the inductance system is not. The inductance system appears to show an increase in inductance (decrease in voltage) with displacement in either direction from 0 displacement, which would make displacement measurements in the positive and negative directions difficult to differentiate. We needed to determine whether this
Figure 8. Apparatus for calibration of displacement using mechanical gage, shown with a current in the voice coil causing the speaker cone to be displaced downward by 0.20 mm. Machines 2016, 4, 9
10 of 12
Using the mechanical gage apparatus, we gathered readings from the optical and inductance systems at specific displacements over a −3 mm to +3 mm displacement range, using a precision 5-turn potentiometer to control thethe DCposition voltageof tothe thecoil speaker. The are shown 9 (red non-monotonic behavior is due to relative toresults the magnet, or to in theFigure DC current and curves, respectively). in thegreen magnet saturating the magnetic core of the speaker.
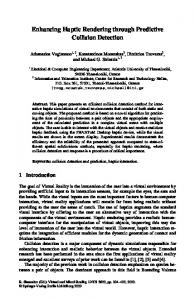
Figure 9.9.Output Outputofofthe theoptical optical(red) (red) and inductance (green) displacement measuring systems Figure and inductance (green) displacement measuring systems withwith DC DC current used to generate displacement. Inductance system (blue) without DC current is also current used to generate displacement. Inductance system (blue) without DC current is also shown, in shown,displacement in which displacement wasby generated by an external force. which was generated an external force.
To determine the effect of the DC current on the inductance measurement, a separate experiment was conducted in which the speaker was moved through the same range of displacements using an externally applied force, with no DC current present in the speaker coil. These results are shown in Figure 9 (blue curve). As can be seen, the resulting function is now monotonic, although demonstrating a lower total dynamic range over the ´3 mm to +3 mm displacement range. Thus, if we can separate the effects on inductance of current and displacement when using a DC (or more generally low frequency) current, we can still achieve a monotonic measure of displacement based on inductance. This will be discussed further in the Conclusions section. The inherent noise in the optical and inductance systems was determined by recording root-mean-squared AC voltages in each (optical: 1.2 mV; inductance: 3.1 mV). Using the maximum range of voltages observed over the ´3 mm to +3 mm displacement range (optical: 1.4 V; inductance 0.28 V) yielded a signal-to-noise (S/N) of 61 dB for the optical system and 39 dB for the inductance system. We then determined displacement vs. speaker voltage over the ´3 mm to +3 mm displacement range, shown in Figure 10. The non-linearity in the compliance of mechanical suspension is evident. The non-linearity is asymmetrical in part due to the offset in displacement introduced by the mechanical gage (~1 mm, as discussed above). The data also probably reflect changes in the efficiency of the voice-coil due to coil location relative to the magnet. Finally, we measured the voltage required to produce 0.98 N (100 g) at zero displacement, the result being 0.95 V. Since force is approximately a linear function of voltage at a given displacement, and we can safely deliver 10 V DC to the speaker coil, this means the system can deliver approximately 10 N of force in either direction at zero displacement. The deliverable force will be less as displacement increases, since the mechanical compliance of the speaker must be overcome.
inductance system. We then determined displacement vs. speaker voltage over the −3 mm to +3 mm displacement range, shown in Figure 10. The non-linearity in the compliance of mechanical suspension is evident. The non-linearity is asymmetrical in part due to the offset in displacement introduced by the mechanical gage (~1 mm, as discussed above). The data also probably reflect changes in the Machines 2016, 4, 9 11 of 12 efficiency of the voice-coil due to coil location relative to the magnet.
Figure10. 10.Speaker Speakerdisplacement displacementvs. vs.coil coilvoltage. voltage. Figure
Finally, we measured the voltage required to produce 0.98 N (100 g) at zero displacement, the 4. Conclusions result being 0.95 V. Since force is approximately a linear function of voltage at a given displacement, a novel 1-DOF haptic basedthis on ameans readilythe available and We wehave can developed safely deliver 10 V DC to the renderer speaker coil, system inexpensive can deliver electronic device, the loudspeaker. The design and construction of an initial prototype haswill been approximately 10 N of force in either direction at zero displacement. The deliverable force be completed. The renderer exhibits bandwidth,compliance low friction, and low hysteresis, which are less as displacement increases, sincehigh the mechanical of the speaker must be overcome. advantages it shares with the Maglev haptic rendering device from Butterfly Haptics. As opposed to Maglev, however, whose flotor weighs 500 g, the entire moving apparatus of our devices 4. the Conclusions weighs 23 g (11 g from the speaker itself and 12 g from our scaffold, sensor, preload spring, and We have developed a novel 1-DOF haptic renderer based on a readily available inexpensive attachment point). The total cost of parts, including microprocessor and custom 3D printing in our electronic device, the loudspeaker. The design and construction of an initial prototype has been rapid prototyping center of the scaffold, is approximately $600. completed. The renderer exhibits high bandwidth, low friction, and low hysteresis, which are Our design incorporates a novel method of measuring displacement from inductance. Initial analysis of this displacement measurement shows a precision of approximately 1% (39 dB) of full displacement, which given our test range of ´3 mm to +3 mm, translates to ~0.06 mm. Full calibration of displacement will need to account for the observed interaction between the low frequency current used to displace the speaker and the 30 KHz sinusoid used to measure inductance, due to non-linearity in the ferrite core of the speaker. We have shown this interaction to be significant when those low-frequency currents are at DC, and further study will be conducted to establish if additional interactions occur at non-DC low frequencies. Given that we control, and therefore know, the magnitude of the low frequency current, a calibration of the inductance measurement that takes those currents into account should be possible. With the new haptic rendering device, we expect to develop various models of tissue behavior for use in experiments to explore the psychophysics of tool-tissue interactions. In particular, we expect the device to be central to testing new surgical tools we are developing that augment force perception [5,9]. The haptic rendering device lends itself to simulating 1-DOF procedures such as needle insertion, fluid injection and withdrawal, membrane pealing, etc. Others in the haptics research community may find the device useful for their own experiments, or may even wish to participate in its development. To that end, we are developing the new platform in an open-source format, providing complete specifications for use by others. It is our hope that other researchers will agree about the need for such a low-cost, flexible, and high-performance platform for haptics research, and possibly contribute their own haptic models to the platform. Acknowledgments: Supported by NIH grant R01EY021641, NSF grant IIS-1518630, grants from Research to Prevent Blindness and the Coulter Foundation, and a Gerald McGinnis Fellowship.
Machines 2016, 4, 9
12 of 12
Author Contributions: A.K., R.L., A.M., and Z.Y. each designed, constructed, and tested specific portions of the prototype system. R.K., M.S., and S.S. provided essential insights and guidance to the project. G.S. oversaw the entire design and drafted the paper. Conflicts of Interest: The authors declare no conflict of interest.
References 1. 2.
3.
4. 5.
6.
7. 8. 9.
Okamura, A.M.; Richard, R.; Cutkosky, M.R. Feeling is believing: Using a force-feedback joystick to teach dynamic systems. J. Eng. Educ. 2002, 91, 345–350. [CrossRef] Gassert, R.; Metzger, J.C.; Leuenberger, K.; Popp, W.L.; Tucker, M.R.; Vigaru, B.; Zimmermann, R.; Lambercy, O. Physical Student–Robot Interaction With the ETHZ Haptic Paddle. IEEE Trans. Educ. 2013, 56, 9–17. [CrossRef] Gillespie, R.B.; Hoffinan, M.B.; Freudenberg, J. Haptic interface for hands-on instruction in system dynamics and embedded control. In Proceedings of the 11th Symposium on Haptic Interfaces for Virtual Environment and Teleoperator Systems, Los Angeles, CA, USA, 22–23 March 2003. Hollis, R.L.; Salcudean, S.; Allan, A.P. A six-degree-of-freedom magnetically levitated variable compliance fine motion wrist: Design, modeling, and control. IEEE Trans. Robot. Autom. 1991, 7, 320–332. [CrossRef] Wu, B.; Klatzky, R.; Lee, R.; Shivaprabhu, V.; Galeotti, J.; Siegel, M.; Schuman, J.; Hollis, R.; Stetten, G. Psychophysical Evaluation of Haptic Perception under Augmentation by a Hand-Held Device. Hum. Factors 2014. [CrossRef] Klatzky, R.; Gershon, P.; Shivaprabhu, V.; Lee, R.; Wu, B.; Stetten, G.; Swendsen, R. A model of motor performance during surface penetration: From physics to voluntary control. Exp. Brain Res. 2013, 230, 251–260. [CrossRef] [PubMed] Gershon, P.; Klatzky, R.; Lee, R. Handedness in a Virtual Haptic Environment: Assessments from Kinematic Behavior and Modeling. Acta Psychol. 2015, 155, 37–42. [CrossRef] [PubMed] Dodd, M.; Klippel, W.; Oclee-Brown, J. Coil Impedance as a Function of Frequency and Displacement. Available online: http://www.aes.org/e-lib/browse.cfm?elib=12835 (accessed on 14 March 2016). Stetten, G. Portable Haptic Force Magnifier. U.S. Patent No. 8,981,914, 17 March 2015. © 2016 by the authors; licensee MDPI, Basel, Switzerland. This article is an open access article distributed under the terms and conditions of the Creative Commons by Attribution (CC-BY) license (http://creativecommons.org/licenses/by/4.0/).