Invited Paper
Optical alignment with computer generated holograms James H. Burge, Rene Zehnder, Chunyu Zhao College of Optical Sciences, University of Arizona, Tucson, AZ 85721
ABSTRACT Computer generated holograms (CGHs) have been successfully used for wavefront correction for measuring aspheric surfaces. Features on the CGHs have assisted the alignment of the optical test equipment. CGHs can also be used to provide alignment references for other complex optical systems. This paper discusses the types of CGHs that can be used for optical alignment and gives some examples. Keywords: Optical alignment, computer generated holograms, optical testing
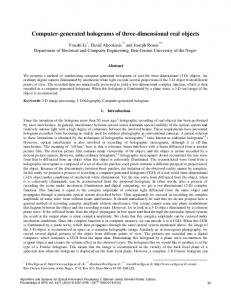
1. INTRODUCTION Computer generated holograms consist of patterns that are fabricated onto glass substrates that use diffraction to create a desired optical effect. The pattern designs are performed using numerical simulation that includes the diffraction and propagation of the light. The holograms for optical testing and alignment can usually be defined using scalar theory and treating the pattern as a diffraction grating that has spatial variation of the lines. The ruling pattern defines the phase front created by the CGH, and variations in the line width can be used to define the amplitude variations. A representative CGH pattern that creates a wavefront with spherical aberration is shown in Figure 1. The operation of the CGH can be explained in two equivalent ways. The change in angle upon diffraction from the CGH follows the grating equation, where the line spacing and direction vary with position. Alternately, the CGH operating at the mth order of diffraction diffracts light to add exactly m waves to the wavefront for each line. The pattern acts as a contour map with contours equal to mλ. Using these simple ideas, we can calculate patterns that transform one wavefront into another. These patterns can be manufactured using lithographic techniques that were developed for created integrated circuits. Modern electron beam writing machines can make patterns > 100 mm on a side with < 0.1 µm pixels. With > 1012 pixels, the CGH can encode a large amount of information and a wide dynamic range. We utilize the flexibility of CGHs to create patterns that create multiple wavefronts simultaneously which maintain registration by the accuracy of the fabrication.
Figure 1. Example of a pattern that acts as a computer generated hologram.
For optical alignment, the CGH is designed to create multiple wavefronts that provide reference for position, shape, or angle. We can create wavefronts that come to a sharp focus in an optical space which is typically quite aberrated. We can also create light distributions which will cause a sharp cross to appear in the desired location, which provides an excellent target for visible alignment. The patterns can create virtually any combination we desire. The CGH is used as a reference for numerous degrees of freedom. This paper gives an overview of methods and applications for using computer generated holograms for optical alignment. Methods of designing CGH patterns that create multiple wavefronts are discussed in Section 2. Section 3 gives the design, analysis, and an application for using the CGH pattern as the reference for positioning the CGH itself. Section 4 discussed the use of the CGH to create wavefront references that are used for aligning and testing aspheric surfaces. The creation of projected references and methods of using them are covered in Section 5. *
[email protected]; phone 520-622-0170, fax 520-621-3389
Optical System Alignment and Tolerancing, edited by José M. Sasian, Mitchell C. Ruda, Proc. of SPIE Vol. 6676, 66760C, (2007) · 0277-786X/07/$18 · doi: 10.1117/12.735853
Proc. of SPIE Vol. 6676 66760C-1
2. CREATING MULTIPLE WAVEFRONT FROM THE SUBSTRATE A single CGH substrate can be used to create multiple wavefronts for aligning different degrees of freedom in an optical system. The different patterns can be multiplexed onto the substrate in two different ways •
Space division multiplexing where different regions on the substrate are used for different wavefronts
•
Amplitude division multiplexing where a single pattern is defined which creates the different wavefronts.
2.1 Space division multiplexing In space division multiplexing, the different CGHs are placed at different position within the illuminated aperture. An example of such a CGH is shown in Figure 2, where the central pattern creates an aspheric wave front for surface testing, the 4 patterns within small circles project reference spots to align subsequent optics, the ring pattern is used to align the CGH substrate, the pattern in the bottom rectangle projects a line to get the clocking and the 3 patterns within the remaining rectangular apertures the position of the tested surface.
((((((((((i II))) ll))))))
The area on the substrate can be divided into large regions, as shown in Figure 2. These patterns are easy to define and the crosstalk between different patterns is minimal. Alternatively, the CGH be divided into very small regions, with each region itself unresolved in the far field diffraction. In this case, the details of the subdivision must be carefully analyzed for interference from one pattern to another. Also, the pattern of the subdivision itself will create far field diffraction effects that must be controlled.
Figure 2. Multiple CGH patterns on the same substrate. The pattern was scaled for visualization. (Each line here represents 700 lines in the actual CGH.)
iiiH((fISt\
2.2 Amplitude division multiplexing A second method for multiplexing different wavefronts uses a single pattern to create multiple wavefronts. This pattern is calculated by simply making a binary representation of the sum of complex amplitudes for the individual patterns. Liu1 showed how to combine N CGHs (Eq. 1) with their amplitude An and phase Φn functions, creating a single CGH with wavefront phase variation α(x,y) where x and y give the position on the CGH substrate. This technique allows each wavefront to have its own amplitude An defined to achieve favorable intensities in the projected references. A normalization factor M must be included.
e
iα ( x, y )
An ( x, y ) i φn ( x , y ) e n =1 M ( x, y ) N
=∑
Eq. 1.
An example of this type of CGH was developed to bring light to focus at four different points along the axis. The application of this type of CGH is discussed later. The four phase fronts were calculated and applied to Eq. 1 where the amplitudes were all set to be equal. The CGH pattern for the resulting complex amplitude was determined using the concept discussed in Section 1. The binary representation is the same as the contours of α(x,y) with 2π steps in phase. The resulting CGH was encoded as a binary amplitude pattern – which is the same as opaque lines drawn on the CGH substrate. The far field diffraction from this pattern was simulated and shown to create the spots focused at the appropriate locations. Figure 3 shows the pattern itself as it was encoded and the intensity distribution it creates. This figure shows how the light comes to very well defined focus at the desired locations.
Proc. of SPIE Vol. 6676 66760C-2
a) Pattern that projects spots to 4 different distances
b) Peak intensities along the z axis Relative peak intensity at different propagation distances 100 90
Relative peak intensity [%]
80 70 60 50 40 30 20 10 0 500
c) Peak at z=720mm
d) Peak at z=1080mm
1000
1500 Propagation distance [mm]
e) Peak at z=1440mm
2000
2500
f) Peak at z=1790 mm
Figure 3: a) Binary amplitude for a multiplexed CGH that brings light to focus at 4 separate locations along the axis b) Relative peak intensities at different propagation distances from the CGH, and c),d) e) f) spot shapes at desired distances. All these are simulated results.
3. CGH ALIGNMENT TO WAVEFRONT The alignment of the CGH itself can be performed by creating a pattern which uses Littrow diffraction to autoreflect the illumination wavefront as shown in Figure 4.. For the case of a point source, the CGH is made to act as a spherical surface, with center of curvature at the source point. If the illumination is provided by an interferometer or a point source microscope, then it is possible to measure the reflection directly and move the CGH to the appropriate location. 3.1 CGH alignment to spherical wavefront For example, the CGH used for measuring the primary mirror for the New Solar Telescope2 was designed to be illuminated by a converging spherical wavefront. An annular pattern outside the clear aperture of the test was written to enable this alignment, shown in Figure 5. Since the CGH is aligned to the point focus, there are only three degrees of freedom which are constrained, which appear as tip, tilt, and focus in the interferometer. The remaining three, which correspond to rotation about the point source are not defined here, and are not important.
Proc. of SPIE Vol. 6676 66760C-3
When using an interferometer, it is important to align the system so that the null interferogram corresponds to wavefront alignment. This can be done in a Twyman-Green interferometer using a corner cube to align the reference mirror and a shear plate to measure focus and spherical aberration. Spherical wavefront
w
Interferometer
Reflection CGH
Figure 5. Representation of a CGH with alignment pattern outside the clear aperture. (Each line here represents 700 lines in the actual CGH.)
Figure 4. The autoreflection from the CGH is useful for aligning the CGH to the wavefront.
For the case of a narrow annulus, it is difficult to determine the axial position accurately because the power in the wavefront is poorly sampled. The change in reflected wave front due to axial shift can be written as3 2
2
W = 4( f #In − f #Out )∆z
Eq. 2.
Where the subscript Out indicates the f/# calculated based on the outer CGH diameter and correspondingly subscript In is the f/# calculated on the inner diameter. Assuming that the phase can be measured over this annulus to 1/m*λ the uncertainty for the axial alignment becomes
u∆z =
1 mλ 2 2 4( f # In − f #Out )
Eq. 3.
Assuming m=1 (1 fringe), the uncertainty for the NST CGH becomes
u∆z =
1 1λ = 0.2µm 2 2 4( f 1.75 − f 1.5 )
Diffraction effects on the edges of the apertures within the alignment pattern, substrate errors and errors in the illumination wave front can significantly increase the uncertainty especially if the measured wave becomes discontinuous (made from discrete unconnected areas). 3.2 CGH alignment to aspherical wavefront Given a known incident wavefront, a CGH can be designed and made to match it in autoreflection . It is only a special case to align a CGH to spherical wavefront. As the intermediate wavefront in an optical system is often aspheric, patterns can be made to autoreflect the aspheric wavefront to align a CGH to the wavefront itself. An example for an aspheric autoreflection is the reference CGH used in the GMT null test system4 as shown in Figure 6. The measurement system for the off axis segments of the Giant Magellan Telescope uses a null corrector composed of a
Proc. of SPIE Vol. 6676 66760C-4
transmission CGH and two spherical mirrors. The large sphere is aligned to the rest of the system through the use of this intermediate CGH, which is designed to autoreflect the aspheric light back into the interferometer. So when this CGH is aligned, the position of the CGH itself represents the wavefront at that location. Subsequently, the large mirror is aligned to the CGH which effectively aligns it to the wavefront. Alignment errors in the other optics are fully compensated. Reference CGH, inserted into aspheric wavefront
U.W
Large mirror (3.75m in diameter)
Interferometer and transmission CGH
GMT mirror
II
Figure 6. Illustration of the GMT null test system and the reference CGH between the two spherical mirrors, used for alignment.
Figure 7. Representation of a CGH with alignment pattern outside the clear aperture. (Each line here represents 700 lines in the actual CGH.)
The CGH for the GMT test is shown in Figure 7. As this wavefront is highly aberrated, the location of the CGH for the null return is fully constrained in all 6 degrees of freedom. A spherical pattern leaves three degrees of freedom unconstrained.
4. CGH CREATION OF WAVEFRONT REFERENCES Computer generated holograms are routinely used as null correctors to transform a spherical wavefront into an aspheric wavefront that propagates to match the surface being measured, as shown in Figure 8. These types of CGHs are well known and are not discussed in detail here, other than as an application of the CGH alignment. Spherical wavefront
aspherical wavefront
Aspheric surface to be measured
Interferometer
CGH
Figure 8. Null testing for aspherical surfaces
The CGH could also create other wavefronts to compensate aberrations from an optical subsystem. This is useful for systems that have several subsystems which are not individually corrected for aberrations, but use one subsystem to compensate for aberrations in another. The CGH test allows a null wavefront measurement for each of the subsystems alone.
Proc. of SPIE Vol. 6676 66760C-5
5. CGH CREATION OF PROJECTION REFERENCES CGH patterns are used to project points in space, which can be used for optical alignment. The positions of the focused spots are used as references for alignment. One application for this technique is for aligning aspheric surface to the optical test. The CGH for this configuration includes a pattern that provides a null test of the aspheric surface. It also contains patterns that create these alignment references, as shown in Figure 9 which depicts such a test for an off axis asphere.
Figure 9. The CGH for the null test of the aspheric surface incorporates patterns that project alignment references which can be located with a CCD. The aspheric mirror under test is then aligned to these reference points.
This alignment was performed for the measurement of a 50 cm paraboloidal mirror was 1.5 m away from the parent axis.5 The CGH created 4 patterns that appear as crosses. The test is then easily aligned by moving the mirror to the center of these patterns, then tilting the mirror to return the light into the interferometer.
Figure 10. Measurement of a 50 cm aspheric mirror was enabled with a CGH that projected four alignment marks with the configuration shown where the four patterns appear as crosses exactly 50 mm from the outer edge of the mirror. The position of the aspheric mirror could be determined to < 0.5 mm visually. The use of a CCD enables much higher accuracy, as the central lobe of the pattern is 100 µm FWHM.
These references provide accurate information for lateral position and clocking of the optic, but they provide poor resolution for axial position. The axial position must be determined using other metrology.
Proc. of SPIE Vol. 6676 66760C-6
5.1 Sensitivity analysis for different techniques of measuring focus position The lateral position of projected references can be detected by direct measurements with a CCD or position sensing detector as above. Alternatively, the focus position can be determined by reflection from a spherical ball. Lateral displacements of the ball will cause a walk off of the reflected cone of light as well as a tilt term in its phase as depicted in Figure 11.
z’
r
CCD
r
S’
S’
∆B
∆B S
∆Ι
a)
S
b)
c)
Figure 11. a) Direct detection using a CCD camera, b) Indirect detection measuring lateral displacement ∆I(z’), c) detecting tilt of the reflected wave front, where ∆Β is the lateral displacement of the ball, S is the virtual focus of the projected light and S’ its displaced image due to a misalignment of the ball. The reflected light can be interrogated for any value of z’ with the use of an imaging lens.
Analysis of the reflected light is presented here which is based on geometric optics for the reflected light. This is valid when the ball radius of curvature r is large compared to diffraction limited depth of focus. A more complete relationship which includes diffraction will be published in a subsequent paper. Interpreting the reflected light from the ball with radius r, the lateral displacement of the reflected cone described with focal ratio f/# can be written as
∆ I ( z' ) =
2 ( z '−r ) ∆ B . r
Eq. 4.
The geometrical optical spot diameter at z’ after the reflection is
D' =
1 f #
z' .
Eq. 5.
∆B .
Eq. 6.
The wavefront tilt across a half diameter of the reflected beam is
W11 =
2 f #
The spot diameter at best focus, as measured by a CCD can be written as
Ddiffr = 2.44 λ f # .
Proc. of SPIE Vol. 6676 66760C-7
Eq. 7.
Assuming that the spot position can be determined to accuracy of D/n, the uncertainty of direct detection using a CCD becomes
uCCD =
2.44 λ f #. n
Eq. 8.
Applying this same factor, the uncertainty for detecting the lateral ball position by measuring the displacement of the reflected cone becomes
u∆ B ,I =
1 z' . 2 n f # ( z '− r )
Eq. 9.
For the special case where z’=0, which requires the use of a lens, the uncertainty becomes
u∆ B ,I , z '=0 =
2.44 λ f #. 2n
Eq. 10.
Assuming that wave front tilt is measured to λ/m accuracy the uncertainty in detecting the lateral ball position becomes
u∆ B , phase =
λ 2m
f #.
Eq. 11.
If we assume that the spot position can be detected to D/10 and wave front tilt to λ/4 the dependence on the f/# is shown in Figure 12. for some special cases. Uncertainty detecting spot position dependent on the f/# 20 18 16
Uncertainty [um]
14 12 10 8 6 4 2 0 0
5
10
15
20
25
30
35
40
45
50
f/# Spot direct
Phase
Return spot (at z'=0)
Return spot (at z'=-r)
Return spot (at z'=2*r)
Figure 12. Uncertainties for different methods of detecting lateral positions of projected reference spots assuming the image can be found to 1/10 of its diameter and the wavefront tilt can be measured to λ/4. For the chosen values, detecting the return spot displacement at z’=0 is identical to measuring the wavefront tilt.
Proc. of SPIE Vol. 6676 66760C-8
In order to detect the lateral displacement of a ball with respect to the reference spot a ball alignment tool (BAT) is required.6 The BAT detects lateral displacements of the ball by measuring the displacement of the reflected light cone at position z’. An imaging lens relays the spot onto a CCD (See Figure 13). The BAT itself needs to be aligned to the incoming beam, therefore some light is split off with a beam splitter to generate a reference spot. The position of the reference spot needs to be calibrated. z’
mirror
mirror BS
BS
r
r
S’ S
S’
∆B
∆Ι
S
∆B
Imaging lens
Imaging lens
Reference spot
Alignment spot CCD
CCD
b)
a)
Figure 13. Ball Alignment Tool (BAT) layout. This includes a lens which can put the image of the CCD at any position z’, and shows a) Light path for alignment of the BAT b) light path to align the ball with respect to the beam.
Assuming that the BAT calibration is limited by D/n and the alignment of the BAT in the beam causes an error of same value, the RSS uncertainty for this method becomes
u∆ B ,I =
3 z' 2 n f # ( z '− r )
Eq. 12.
Combined uncertainties detecting spot position dependent on the f/# 20 18 16
Uncertainty [um]
14 12 10 8 6 4 2 0 0
5
10
15
20
25
30
35
40
45
50
f/# Spot direct
Phase
Combined uncertainty for return spot (at z'=-r)
Figure 14. Uncertainties for lateral spot position detection assuming D/10 centroiding accuracy, ¼ waves accuracy in phase measurement and the mentioned combined uncertainty measuring the return spot.
Proc. of SPIE Vol. 6676 66760C-9
5.2 Use of multi-focusing CGH for aligning lenses The utility of the CGH for optical alignment is demonstrated with an example for lenses, shown in Figure 15. The CGH provides a more sensitive version of a common alignment technique that typically uses a laser beam or an axicon. The CGH is set up so that it focuses light onto a position sensitive detector PSD. As subsequent lenses are added, different wavefronts from the CGH are used such that a good focus is always obtained at the PSD. Since all of the wavefronts are made from the same CGH, their registration is excellent. When using such a CGH, the light is always focused onto the PSD, so this device can be chosen to have excellent accuracy. Using the common technique with a laser beam without the multiplexed CGH, the beam will typically suffer significant defocus at the PSD, which limits resolution.
Figure 15. A single multiplexed CGH provides references for building up a set of lenses. This brings light to focus onto a position sensitive detector for each of the configurations above. Since the light is focused for each step, very high resolution may be obtained.
This same based method can be used for non-axisymmetric systems as well, but this becomes more complicated. The CGH can compensate high order aberration in the optical system as well as power. The CGH can provide subsystem information as well as alignment. For example, the CGH for the above lenses is designed to create a diffraction limited image for each focus. It would be easy to see if one of the images suffered from some aberration. This would allow the source of the aberration to be discovered during initial assembly, isolated to determine the source of the problem, and corrected.
Proc. of SPIE Vol. 6676 66760C-10
6. CONCLUSION Computer generated holograms are used to accurately create multiple wavefronts. These can provide ideal tools for defining references for aligning complex optical systems. We present a variety of configurations for using such computer generated holograms. The holograms can create reference wavefronts for optical surfaces as well as autoreflect aspheric wavefronts. The CGHs can also focus light at discreet points which can be transferred to other mechanical or optical references.
References 1) H. Liu, Z. Lu, and F. Li, “Redistribution of output weighting coefficients for complex multiplexed phase-diffractive elements,” Optics Express 12, 4347-4352 (2004). 2) H. M. Martin, J. H. Burge, S. D. Miller, B. K. Smith, R. Zehnder and C. Zhao, “Manufacture of a 1.7-m prototype of the GMT primary mirror segments”, in Optomechanical Technologies for Astronomy, ed. E. Atad-Ettedgui, J. Antebi and D. Lemke, Proc. SPIE 6273, 62730G (2006). 3) J. E. Greivenkamp, Field Guide to Geometrical Optics (SPIE Press, 2004) 4) J. H. Burge, L. B. Kot, H. M. Martin, C. Zhao and R. Zehnder, “Design and analysis for interferometric testing of the GMT primary mirror segments”, in Optomechanical Technologies for Astronomy, ed. E. Atad-Ettedgui, J. Antebi and D. Lemke, Proc. SPIE 6273, 6273GM (2006). 5) J. Burge, P. Koudelka, “Optical test alignment using computer generated holograms” in Optical Fabrication and Testing, (Optical Society of America, Washington DC, 2002) pp. 105-107. 6) R. Zehnder, J. H. Burge and C. Zhao, “Use of computer-generated holograms for alignment of complex null correctors”, in Optomechanical Technologies for Astronomy, ed. E. Atad-Ettedgui, J. Antebi and D. Lemke, Proc. SPIE 6273, 62732S (2006).
Proc. of SPIE Vol. 6676 66760C-11