Dec 31, 1993 -
OPTIMIZATION-BASED CONTROLLER TUNiNG USING THE Q-PARAMETERIZATION By Alan F. Lynch B.A.Sc. University of Toronto, Toronto, Ont. 1991
A THESIS SUBMITTED IN PARTIA.
FULFILLMENT OF
THE REQUIREMENTS FOK PHE DEGREE OF MASTER OF APPLIED SCIENCE
in PHE FACULTY
F C
DU E S
DEPARTMEN OF ELI’:i IICAL I
We accept this
t
to the requil
s as
iDlES
GINEEBINC
nforming
standard
THE UNIVERSITY OF BRITISH COLUMBIA
December 1993
©
Alan F. Lynch, December 31, 1993
In presenting this thesis in partial fulfilment of the requirements for an advanced degree at the University of British Columbia, I agree that the Library shall make it freely available for reference and study. I further agree that permission for extensive copying of this thesis for scholarly purposes may be granted by the head of my department or by his or her representatives. It is understood that copying or publication of this thesis for financial gain shall not be allowed without my written permission.
Department of Electrical Engineering The University of British Columbia 2075 Wesbrook Place Vancouver, Canada V6T 1W5
Date:
3
/
/
Abstract
We consider the problem of tuning a closed-loop linear controller for a continuous-time linear, lumped, exponentially stable plant using measurements. A two-step tuning method is proposed based on an “internal model” controller structure. The motivation for developing the method is to reduce the effect of modeling error on the design and to reduce the amount of computation required compared to a similar design performed off-line. The first step is to solve a controller design problem formulated as a sequence of convex optimization problems in which the cost and constraint functionals and their descent directions are computed directly from plant measurements. The designer is comfortable in specifying desired performance by adjusting the weights of a weighted-max cost function composed of a wide range of time and frequency domain performance functionals. To implement the “internal model” controller, a plant model is obtained in the second step. The identification objective makes the plant model depend on the desired closed-loop performance. To ensure a robust design, the model satisfies a worst-case error bound which depends on information about the plant, the experiment duration, the noise level, and the order of the model.
11
Table of Contents
ii
Abstract
vii
List of Figures
x
List of Tables
xi
Notation
xiii
Acknowledgements 1
2
1
Introduction 1.1
Feedback system
1
1.2
Control design step
2
1.2.1
Background on linear controller design methods
2
1.2.2
Using plant measurements to perform an optimization-based design
8
1.3
Control-oriented identification step
9
1.4
Statement of problem
10
1.5
Contributions
11
1.6
Thesis outline
11
Control design step of the tuning method
13
2.1
Closed-loop transfer matrix
13
2.2
Parameterization of the controller
13
2.3
Stable plant
2.2.1
Internal model controller structure
2.2.2
Implementation of the design parameter
Q
14
for optimization-based controller design 15 17
Controller design problem 2.3.1
Performance functionals
17
2.3.2
Performance specifications
17
2.3.3
Form of the optimization problem
18
111
2.3.4
3
Tuning procedure
.
19
2.4
Performing a design on P
20
2.5
Optimization algorithms
23
2.6
Internal model controller structure
Unstable plant
24
Computing the performance functionals in the control design step 3.1
3.2
3.4
3.5
27
The step response functional 3.1.1
Using measurements to evaluate the step response functional
3.1.2
Using measurements to evaluate a subgradient of the step response functional
3.1.3
Computational cost
30
3.1.4
A step response functional example
31
29 .
.
Norms of particular response functionals 3.2.1
3.3
27
30
31
Using measurements to evaluate the norm of a particular response functional and its subgradient
35
3.2.2
Computational cost
35
3.2.3
An example of using the “L norm” functional
35
The “peak gain norm” functional
37
3.3.1
Using measurements to evaluate the “peak gain norm” functional
38
3.3.2
Using measurements to evaluate a subgradient of the “peak gain norm” functional
39
3.3.3
Computational cost
40
3.3.4
An example of using the “peak gain norm” functional
40 41
2 norm” functional The “H 3.4.1
2 norm” functional Using measurements to evaluate the “H
3.4.2
2 norm” functional Using measurements to evaluate the subgradient of the “H
3.4.3
Computational cost
43
3.4.4
2 norm” functional An example of using an “H
45
42 .
.
43
45
The “H norm” functional 3.5.1
Using measurements to evaluate the “H, norm” functional
3.5.2
Using measurements to evaluate a subgradient of the “H,,, norm” functional
3.5.3
Computational cost
48
3.5.4
An example of using the “Hc,, norm” functional
48
iv
47 .
.
47
50
4 Identification step of the tuning method
5
4.1
Identification method
50
4.2
Deriving the bound for the unweighted model error
51
Transformation to the z-plane via the bilinear transformation
52
4.2.2
Assumed knowledge about the plant
52
4.2.3
Approximation error of a linear spline interpolant
53
4.2.4
Error bound for truncating a Taylor series
54
4.2.5
An expression for the model error bound
54 56
Simulation examples 5.1
5.2
6
4.2.1
Example 1: Stable plant
56
5.1.1
An analytic solution
57
5.1.2
Open-loop tuning and another interpretation of the design problem
59
5.1.3
Results of the identification step
Example 2
Unstable plant, the ACC’ benchmark problem
71
5.2.1
Statement of the design problem
71
5.2.2
Performance specifications
72
5.2.3
Results of the control design step
76
Conclusions/Future work
85
6.1
85
6.2
Conclusions 6.1.1
Control design step
85
6.1.2
Identification step
86 87
Future work
89
A Some rules for computing subgradients A.1 Basic definitions
89
A.2 Rules for computing subgradients
89
B A two-step design for strongly stabiizable plants ‘ACC stands for the American Control Conference.
V
91
C Cost of evaluating the performance functionals 0.1 The step response functional
93 93
0.1.1
Evaluating the functional using a plant model
93
0.1.2
Evaluating the functional using measurements
97
0.2 Norms of a particular response functional
97
0.2.1
Evaluating the functional using a plant model
97
0.2.2
Evaluating the functional using measurements
100 100
C.3 The “peak gain norm” functional 0.3.1
Evaluating the functional using a plant model
100
0.3.2
Evaluating the functional using measurements
102 103
2 norm” functional 0.4 The “H 0.4.1
Evaluating the functional using the plant model
103
0.4.2
Evaluating the functional using measurements
105 109
0.5 The “H, norm” functional 0.5.1
Evaluating the functional using the plant model
109
0.5.2
Evaluating the functional using measurements
111
D Cost of computing a time domain response in MATLAB
114
Fl Loop Transfer Recovery (LTR) design method
115
E.1
Linear Quadratic Gaussian (LQG) design method
115 118
E.2 LTR design procedure F Obtaining the frequency response data for the identification step
119
Bibliography
121
vi
List of Figures
1.1
Closed-loop system
2
1.2
Open-loop system
8
1.3
Tradeoff between uncertainty and achievable performance
9
2.4
Controller structure for a stable plant
14
2.5
An equivalent open-loop system
14
2.6
Parameterization of the design parameter
2.7
Iterations of the ellipsoid algorithm
25
2.8
Controller structure for a strongly stabilizable plant
26
3.9
Open-loop system
27
Q
15
3.10 The step response functional
28
3.11 Computational cost : The step response functional
31
The step response functional
32
3.12 Computational cost
3.13 A step response for the step response functional example 3.14 Computational cost
The norm of a particular response functional
33 36
3.15 A step response for the norm of a particular response functional example
37
3.16 Actuator effort for the norm of a particular response functional example
38
3.17 Computational cost : The “peak gain norm” functional
40
3.18 A step response for the “peak gain norm” functional example
41
3.19 Actuator effort for the “peak gain norm” functional example
42
3.20 Computational cost
The “H 2 norm” functional
44
3.21 Computational cost
The “H 2 norm” functional
45
2 norm” functional example 3.22 A response due to white-noise excitation for the “H 3.23 Computational cost
The “H® norm” functional
46 48
3.24 A Bode magnitude plot for the “H norm” functional example
49
5.25 Example 1: An augmented plant used in the LTR design method
58
vii
5.26 Example 1: A weighting transfer function used in the LTR design method
59
5.27 Example 1: Performing the analytic design method
60
5.28 Example 1: Another interpretation of the analytic design problem
61
5.29 Example 1 : Optimal cost function values versus the number of controller parameters.
.
63
5.30 Example 1: Number of functional evaluations to obtain the solution
64
5.31 Example 1: A tradeoff curve
65
5.32 Example 1: Assumed information about the plant
66
5.33 Example 1 : Worst-case model error bounds
67
5.34 Example 1: A step response of the optimal controller
69
5.35 Example 1: Bode plots of the open-loop gain
70
5.36 Example 2: A benchmark problem
71
5.37 Example 2: Describing uncertainty in the plant
73
5.38 Example 2 : Measuring an impulse response
75
5.39 Example 2: A gain margin specification
76
5.40 Example 2 : Bode magnitude plots of the optimal solution
79
5.41 Example 2 : Bode magnitude plots of the optimal solution
80
5.42 Example 2 : Bode plots the optimal open-loop gain
81
5.43 Example 2 : Time domain responses of the optimal solution
82
5.44 Example 2: A tradeoff curve
83
5.45 Example 2: Convergence of the optimization algorithm
84
A.46 An example of a convex nondifferentiable functional
90
C.47 Cost of evaluating the step response functional
95
C.48 Cost of evaluating the norm of a particular response functional
98
C.49 Cost of evaluating the “peak gain norm” functional
101
2 norm” functional C.50 Cost of evaluating the “H
104
2 norm” functional C.51 Relative cost of evaluating the “H
109
C.52 Cost of evaluating the “H, norm” functional
112
C.53 Relative cost of evaluating the “H norm” functional
113
E.54 LQG controller structure
116
viii
E.55 An augmented plant used in the LTR design method
117
F.56 Identification experiment setup
119
ix
List of Tables
5.1
Example 1: An analytic solution
5.2
Example 1: An optimal controller
5.3
Example 2
5.4
Example 2: Optimal controller parameters
.
61 68
Optimal values of the objectives
x
77 78
Notation
Notation
Meaning
arg mm
A minimizer of the argument.
arg inf
An infimizer of the argument.
C
The complex numbers.
Co+
{s
e CIRs> O}, the open right-half plane.
B,,
{s
e Clisi < p}.
B
1 B
FIX
The expected value of a random variable X.
Hba
The closed-loop transfer function from signal a to signal b.
=
{s
e Cilsi < 1}, the open unit disk.
The imaginary part of the complex number s. inff
The infimum of a function.
.1 1 L
One-sided inverse Laplace transform operator.
max
The maximum of a function or set.
mm
The minimum of a function or set.
N
The nonnegative integers.
R, R
The Real numbers and nonnegative Real numbers, respectively.
RN
The vector space of n-component real vectors. The space of functions
{f:
+ 0 C
The space of functions
{f
B
—*
—+
÷ and sup 0 Cif is analytic in C €C+ 5
Cif is analytic in B and supEB
RH,,,
The space of proper real-rational transfer functions.
2 RH
The space of strictly proper real-rational transfer functions.
Js
The real part of a complex number s.
sgn(.)
The signum function.
sup
The supremum of a function.
If(z)L
The complex conjugate of the complex number s. AH
The complex conjugate transpose of the matrix A with complex entries. xi
If(s)I
1/2.
(F-F) 02 1-Q
To summarize, since performance functionals of the’ ‘ontrol design step are computed ftom measure ments of F and assuming the values of the estimated I unctionals are exact, the tuning method has a clear advantage in performance over the design performed off-line on an incorrect model.
Chapter 2. Control design step of the tuning method
2.5
23
Optimization algorithms
Two optimization algorithms were investigated to solve the optimization problem (2.16): the ellipsoid algorithm, and a modified sequential quadratic programming (SQP) method. This section discusses the advantages and disadvantages of both algorithms. Ellipsoid algorithm
Recently the ellipsoid algorithm, which is thoroughly discussed in [GLS88 and the references therein, is receiving much attention in control system lzarature (see for example [BB91, Z093, BCFB93]). Roughly speaking, the ellipsoid algorithm generates a sequence of ellipsoids decreasing in volume; the minimizer is contained in the intersection of this sequence. At each iteration the algorithm requires the value of the objective and its subgradient. (See Appendix A for the definition of a subgradient.) The ellipsoid algorithm has the following merits: • It is simple to implement; the number of lines of code required are a fraction of that required for other algorithms [EK85]. • The functionals minimized need only be convex so that the algorithm is guaranteed to converge. • When the functionals are nonconvex exam eles have shown that in many cases the algorithm finds
the global solution [EKS5]. However, the algorithm has disadvantages: • It requires a large number of functional and subgradient evaluations to obtain a small error in the solution [EK85]. • It is not a descent method; although at each iteration the distance to the solution decreases, functional values may increase. This is because the negative of the subgradient of a function is a descent direction for the distance to the
minimizer
and not a descent direction for the function
itself. In addition, particularly on the first few iterations when the initial ellipsoid is large, the value of objective can vary wildly. Sequential quadratic programming method
The modified sequential quadratic programming (SQP) method implemented in [GraOO] has the following benefit:
Chapter 2. Control design step of the tuning method
24
• It requires less functional and gradient evaluations than other algorithms to obtain small errors in the solution [EK85]. The algorithm has the disadvantage: • The cost and constraint functional must be of the form max{cbk(x),1c
where
k 5 c
C {1,...,n}},
must have continuous first and second derivatives for convergence to be guaranteed
[Gra9O]. This implies that the convergence of a problem minimizing the L 1 norm (which is nondifferentiable) of a response of the system canuo be guaranteed using the SQP method. An example The behaviour of the two algorithms is illustrated with the following simple convex problem mm
max{fri
—
1)2, (z 2
—
g(x) < 0}, 2 1)
xeR2
gfr) 0 The solution to (2.20) is x
=
=
2+ x
ni
—
1.
(2.20)
[0.5, 0.5]. The ellipsoid method, with an initial sphere of radius 106
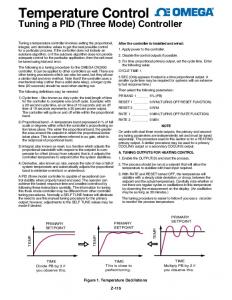
centered at [0,0], (using deep-cuts in both the constraint and objective iterations) finds the solution in 23 iterations. Figure 2.7 shows several iterations
.$gorithm with the values of the cost function
labeled. Note that for the second iteration the value ol the objective functional is large (1.09 x io). On the other hand, the SQP method converges in only 5 iterations with a maximum objective value over all iterations of 8. The absolute error in the cost and constraints functionals is 10—6 and the absolute error in the solution is 10i. Simulations have shown that for more useful control system design examples the SQP method still converges in less iterations than the ellipsoid algorithm. For this reason it is used in the simulation exam ples presented. However, either algorithm can be usEd and when discussing the performance functionals in Chapter 3 the ellipsoid method allows a wider range of functionals to be considered.
2.6
Internal model controller structure: Unstable plant
As mentioned in Section 2.2.1, when the plant model is exact (P
=
F), then a necessary and sufficient
condition for an IMC controller to provide internal stability is for F and
Q to be stable.
Hence the IMC
Chapter 2. Control design step of the tuning method
25
C%I
x
-500
0
500
1000
x(1)
Figure 2.7: Three iterations of the ellipsoid algorithm for the example problem (2.20). Note the large value of the cost function at the second iteration. structure shown in Figure 2.4 can not be used for unstable P. However, the IMC controller can still be used in a two-step design procedure if a nominal stabilizing stable controller exists (i.e. the plant is strongly stabilizable). (A condition for checki. bether a plant is strongly stabilizable is given in [DFT9O].) The first step of the design procedure is to obtain a nominal stable controller K 0 that stabilizes P. The second step is to modify the dynamics of the stabilized system using the IMC controller structure as shown in the Figure 2.8. The expression for the controller is K(P,
Q)
=
0 + Q(1 K
-
, 1 H(P)Q)
Q e RII,
where H(P)
=
. 1 P(i + KP)
(2.21)
Although not obvious, because the nominal controller is stable the two-step design procedure is over all stabilizing controllers when
P=
P (see [Mac89] or Appendix B for an explanation).
Finally, it is important to note that when P
=
P the closed-loop transfer matrix in terms of P, K 0
Chapter 2. Control design step of the tuning method
26
+
Figure 2.8: The IMC controller K(P, and
Q
Q)
=
0 + Q(1 K
—
1 for a strongly stabilizable plant. H(P)Q)
is
H(P,K(P,Q))
2 ) 0 (1+PK
=
P((1 + PK ) 0
-
PQ)
(1 + P1< 0 -PK ) 0 —P((1 + PK ) 0 an affine function of
Q
-
-
PQ
PQ)
as for the stab1 plant.
) 0 (1 + PK 0 -PK
-
P1< + ) -(Ko(1 + 0 “t1
0 + PK
—
PQ
Q)
PQ)
(1 + PK 0 PK ) + PQ 0 P1< + ) Ko(1 + 0 0 1+ PK
-
Q
PQ
Chapter 3
Computing the performance functionals in the control design step
This chapter describes the performance functionals and their subgradients’ in detail. It gives the steps for computing the functionals and their subgradients for all entries of the closed-loop transfer matrix (2.5) from measurements of the open-loop system shown in Figure 3.9. As well, the amount of compu tation required to evaluate the functionals using a model is compared with that using measurements. Throughout the chapter it is assumed that the responses measured are exact, and to reduce the notation
Q
will be used instead of QN.
U,
HQix)
H
U3
Figure 3.9: Open-loop system used to evaluate performance functionals and their subgradients using measurements.
3.1
The step response functional
Consider the step response functional =
max
max{s(x,t)
a(t),,BQ)
—
s(x,t),0},
(3,22)
where s is the unit step response of the transfer function H which is an entry of (2.5) {BB91]. The functions a and 3 are piecewise continuous upper and lower bound functions chosen by the designer. Figure 3.10 gives an example of a step response and typical bounding functions a and t(x)
fi
such that
0 or the upper bound is violated then
=
V(s(x, to)
=
vr(L’
—
a(to))
(:‘)
(to))
1 (fjjfJ) (to) L =
1 L
(3.23)
,
.
(“) (to)
where Hk is the partial derivative of H with respect to
xk.
If
sj(x) =
) 0 9(t
—
sfr,to) > 0, or the lower
Chapter 3. Computing the performance function als in the control design step
29
bound is violated then =
V(i3(to)
=
[
—L
—
s(x,to))
(4ü) (to) (3.24)
.
(!J 1 ±I) (to) —L’ 2 Finally, if &tfr)
=
0 then =
0.
(3.25)
It is important to note the possibility there be several maximizers of (3.22). That is, there may be several times at which the maximum of the functional is attained. In this case any of the times can be used to compute a subgradient as described above. Using measurements to evaluate the step response functional
3.1.1
The following steps are used to evaluate (3.22) from measurements of the open-loop system. Step 1 is performed before optimization begins, and Steps 2—5 are performed at each iteration of the optimization algorithm. 1. A step input is applied at at u 3 for 0 f(length(f))); H=[H; Z(ind)); f=[f f_o(ind)];
else H=Z;
f=f o; end flops_acc=flops_acc÷flps; % Increase sampling frequency. fsfs*lO; end % Interpolate to obtain logarithmcally spaced points. f_inter=logspace(-4, 3,370); H_inter_mag=interp2(f,abs(H) ,f_inter); H_inter_ph=interp2(f,unwrap(angle(H) ) ,f_inter); H=H_inter_mag. *exp( ((H_inter_ph) *sqrt (-1))); flops_acc=flops; % State speace form for B_i. N=20;p=l; % p is arbitrary Aq=-ones(N) *2*p; Aq=tril(Aq,0)÷p*eye(N); Bq=ones (N, 1); Cq(l:N)=_2*p*ones(l,N); Dq=l; % Compute frequency reponse of PB_i and count the number of operations. flops(0) % Compute frequency response of PB_k and count the number of operations. % Balance A [t,a] = balance(Aq); b = t \ Bq; c = Cq * t; % Reduce A to Hesenburg form [pa] = hess(a); % Apply similarity transformations from Hessenberg reduction to B and C: b c g
= = =
* p b; c * 1tifr(a,b,sqrt(_l)*f_inter);
% Compute frequency response of PBk. for k=l:N, PB(k,l:length(f_inter)) = (c end flops_acc=flops+flops_acc;
*
Appendix C. Cost of evaluating the performance function als
108
function [Z, f_o, flps]=compute_trispectrum_average(fs, P,M) fsq=P*fs/M; % P periods of square wave. % Increase sampling frequency by inc. inc=4; t=0: (1/ (inc*fs)) : (((M/fs)-(l/ (fs)))); % input square wave. u=. 5*square(2*pi*fsq*t); [a,b,c,d]=tf2ss(l,[l 1]); y=lsim(a,b,c,d,u,t); % decrease sampling rate u=decimate(u, mc); y=decimate(y, mc); flops(0); % Compute transfer function using trispectrum % average. p=spectrum(u,y,length(uH; [mT,nT]=size(p); Z=p(2: (mT) ,4) f_base=(l: ( (M/(2) )—l) )*(fs/M) % .8 times bw due to filtering in ‘decimate’. % take only the frequency components at which square % wave has energy. f_o=f_base(P:2*P:length(f_base) *.8) Z=Z (P: (2*P) : (length(Z) * .8)); flps= flops; At each iteration of the optimization algorithm the computation of the frequency response of requires N (2N 8
—
pQN
1) flops, and the integral requires 2N 3 + 1 flops. The relative cost is therefore Relative Cost
=
2 2N (2N + 1)Np:s + 1
Since N 3 is typically larger than the number of controller parameters N, the relative cost is less than 1.
Hence, evaluating (C.87) using a plant model is more efficient than using measurements during
optimization.
109
Appendix C. Cost of evaluating the performance function als
/ /
40 1.0
/ / , /
1.0
/
11.4 01.2 cLl E 0.8 0.6
--
:1O
12
14
Number of states in plant model
16
18
20
Figure C.51: The cost of estimating the frequency response of PBk at 370 (dashed) and 92 (solid) points from measurements relative to using a plant model versus the number of states in the plant model. C.5
The “H norm” functional
(s) = 0, and H = PQ 2 Consider the “H norm” functional (3.44) with Wi(s) = 1, W )Hinf(X) = 4
C.5.1
sup IP(jw)QN(z,jw)I.
(C.91)
Evaluating the functional using the plant model
The method used to evaluate (C.91) is to discretize an interval [0, Wma], where
is a sufficiently
large frequency, by N 3 points, and to find the maximum magnitude of the frequency response of PQ” on the interval. Expressing pQN as a function of x, p(s)QN(s)
=
XkPBk
=
B, 1 s
(C.92)
where A, B and Ck are the state space matrices of PBk. It is obvious that by computing the frequency
Appendix C. Cost of evaluating the performance function als
response of FBk before the optimization begins, the frequency response of
110
pQN
can be obtained by
multiplication at each iteration of the optimization algorithm. The frequency response of PB,, is com puted from its state-space form. In MATLAB this is done by first computing A, the Flessenberg form of A, and applying the similarity transformation T associated with the llessenberg transformation to B and Ck. Then the frequency response is computed using PBk(s) =
—
B, 1 A)
(C.93)
where A = THAT, B = THB, and Ck = CkT (the superscript H denotes the complex conjugate transpose). Including all matrix multiplications the cost of evaluating (C.93) at N 3 frequency points requires about 6N + 2(2N
—
Na) + (Na 3 + N + 2Na
—
5 flops, where Na is the dimension of 1)N
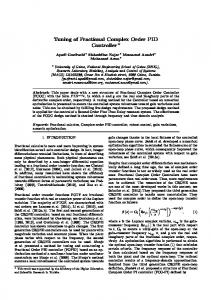
, and the cost of the matrix division 3 A. The cost of obtaining the flessenberg form of A is roughly N 3+N 2 [Mac89j, For example, with Na = 40, N in (C.93) is about N 8 = 370, the total cost is about 25 Mflops. The cost computing the frequency response of PBk using simulation versus the number of states in the plant model is in Figure C.52. Note that the cost obtained in simulation at 20 model states is 26 Mflops which agrees with the estimate obtained above.
Appendix C. Cost of evaluating the performance function als
111
The MATLAB program used to generate Figure C.52 is: clear flops_hin_accum=
[1;
% Plant transfer function denominator. denon=l; % 370 frequency pts. f=logspace(—4,3,370) % State space form of B_i. N=20;p=l; % p is arbitrary Aq=-ones (N) *2*p; Aq=tril (Ag, 0) +p*eye (N); Bq=ones(N,l); Cq(l:N)=_2*p*ones(l,N); Dq=l; for k=l:20, % Plant P_k=l/(l+s)”k. denon=conv(denom, [1 1]); [Ap,Bp,Cp, Dpi =tf2ss(l,denon); % PB_i. [Apq,Bpq,Cpq,Dpqi=series(Ap,Bp,Cp,Dp,Aq,Bq,Cq,Dq); flops(0) % Compute frequency response of PB_k and count % the number of operations. % Balance A ft,ai = balance(Apq); b = t \ Bpq; c = Cpq * t; % Reduce A to I-lesenburg form [p,ai = hess(a); % Apply similarity transformations from Hessenberg % reduction to B and C: b c p
= = =
p * b; 1 c * p; ltifr(a,b,aqrt(_l)*f);
% Conpute frequency response of PBk. for k=l:N, PB(k,l:length(f)) = (c * g); end flops_hin_accum = [flops_hin_accum flops); end plot (1:20, flops_hin_accum) xlabel(’Nunber of states in plant model’) ylabel (‘Floating point operations’)
At each iteration of the
optimization
algorithm, (2N— 1)N flops
are
required
to perform
the
matrix
multiplication in (C.92). C,5.2
Evaluating the functional using measurements
The method to evaluate (C.91) using measurements is similar to the one used in Section C.4.2 for the “H 2 norm” functional. The cost of estimating the frequency response of PBk at 370 points from
Appendix C. Cost of evaluating the performance functionals
112
C’) C 0 C’) El)
a 0 C 0
al 0) C C’)
01. U-
4
2
6
8
10
12
14
16
18
20
Number of states in plant model
Figure C.52: The number of flops versus the number of states in the plant model to evaluate the frequency response of PBk, k = 1, ,20, at 370 freqnency points. .
.
.
measurements relative to using the plant model versus the number of states in the plant model is shown in Figure C.53. The same programs are used to compute the cost of obtaining the frequency response of
PBk from measurements in Section C.4.2; the relative cost is the cost obtained in Section C.5.1 divided by cost using measurements. Since at each iteration the multiplication in (C.92) must be performed regardless of whether measure ments or the plant model is being used, the relative cost of evaluating the functional during optimization is one.
Appendix C. Cost of evaluating the performance functionals
2
4
6
8 10 12 14 Number of states in plant model
113
16
18
20
,20 at 370 Figure C.53: The relative cost of computing the frequency response of PBk, Ic = 1, frequency points using the plant model and using measurements versus the number of states in the plant model. .
.
.
Appendix D
Cost of computing a time domain response in MATLAB
This appendix outlines the cost of computing a time domain response using MATLAB. First the continuous-time system is discretized using a zero-order hold. This involves computing the exponential of a matrix. The state-space matrices of the discretized system are Ad and Bd, given by =
Ad
exp fh
J
Bd =
exprAdrB,
0
where h is the sampling interval. MATLAB uses a scaling and squaring with diagonal Pade approxima tion method to compute the exponential of a matrix. This method is described in {GL89] and requires roughly (6 +
j + )N flops, where j
N
= b
+
a, a
=
max{O, 1 + floor(log (AII))}, 2
is the dimension of A, and nb the number of columns in B.
The state-space equations of the discretized system are
x(k + 1)
=
Adx(k) + Bdu(k)
y(k)
=
Cx(k) + Du(k).
(D.94)
2 + N) length(u) flops and the response obtained from Hence, the state history can be obtained in (2N the state in (2N + 1)length(u) flops. Hence, including the cost of calculating the exponential of a matrix the total cost of computing the response is (6 + j + 1/3)(na + i) + (2n + example, if the plant has 10 states,
0 IIAII,
=
3fla
+ 1) length(u) flops. For
1, and the number of time points is 100 then the cost of
computing a time response is roughly 33000 flops.
114
Appendix E
Loop Transfer Recovery (LTR) design method
E.1
Linear Quadratic Gaussian (LQG) design method
The plant is assumed described by
where
and
, 8 V
th
=
Ax+B’Up+Wproc
Yp
=
CX+Vsens,
(E.95)
are independent zero-mean Gaussian stochastic processes with spectral density
matrices W > 0 and V > 0 respectively. The LQG method finds the controller which minimizes the cost Ru(t)}, T Qx(t) + u(t) T lirnE{x(t) where
Q
and R are weighting matrices satisfying
Q
> 0 and R
(E.96) 0. The standard assumptions are
that the systems with state-space realizations (A, B, C, 112 0) and (A, W Q , C, 0) are stabilizable and 2 / 1 detectable. The LQG-optimal controller is given by K(s)
=
j, —K,(sI—A+BK+KjC) K 1
where the optimal state feedback matrix is =
R_iBTP,
(E.97)
and P is the solution to the Lyapunov equation ATP + PA
-
PBRl BTP +
Q
=0.
(E.98)
The Kalman filter gain matrix is 1 = 1 K P CT V_i ,
115
(E.99)
Appendix E. Loop Transfer Recovery (LTR) design method
116
where P 1 is the solution to the Lyapunov equation AT 1 1+P AP
-
i CT V’CP 1 1 + W =0.
(E.100)
The block diagram of the LQG controller structure is shown in Figure E.54.
Figure E.54: The LQG controller structure. The difficulty with the LQG method is that only rules of thumb exist to select the weights W, V,
Q, R
(see [BH75] for example). Design methods such Loop Transfer Recovery (LTR) have been developed which systematically adjust the design parameters required for the LQG method [BBB+88]. In this thesis it is convenient to consider the augmented plant shown in Figure E.55 which allows us to apply the LTR design method in a more flexible way. First we show how this plant can be described by state-space equations of the form (E.95). The process noise d is filtered white-noise with power spectral density Wd having a realization [Ad, Bd, Cd, Dd]. The state space equations for the process noise are = d
Ad(+Bdv
(E.101)
=
where v is Gaussian white noise. The state-space equations for the measurement noise in are
in
=
Amn+Bmp
=
Cml)+9,
(E.102)
Appendix P2. Loop Transfer Recovery (LTR) design method
117
Figure E.55: The augmented plant used in the LTR design method. where S and p are Gaussian white-noise, and the transfer function Wm in Figure E.55 has the realization [Am, Bm, Cm, 0]. As well, it is assumed p, S and v are independent. Combining (E.101), (E.102) and the state-space equations of the plant yields th
0
ABCd
x
BDd
B
0 ii
(
=
0 0
7)
Yp
=
[c
0
Ad 0
0
Am
Cm]
( 7]
+
Bd
+
0
0
Up
IA 0
Bm
0
(E.103)
Since (E.103) is of the form (E.95) the LQG method can be applied. There are two reasons for augmenting the plant: it makes the selection of the LQG design weights more intuitive (discussed in the next section) and it gives us a another interpretation for the LTR cost function allowing a comparison between the solution obtained by the analytic design and that obtained using the tuning method (see the discussion in Chapter 5).
Appendix F. Loop Transfer Recovery (LTR) design method
L2
118
LTR design procedure
This section discusses how the LTR design procedure is used in the first example in Chapter 6 (involving a SISO plant). The procedure is: 1. Choose the spectral factor transfer matrices Wd, Wm so that —G(sI
—
K is a desirable 1 A)
open-loop gain by increasing Wd relative to Wm at frequencies where K 1 is desired large. Either Wd or Wm can be chosen to shape —C(sI
—
. In the example problem in Chapter 5, 1 A)
iii
is
taken as white noise (Am, Bm, and Cm are zero) and the spectral factor of d is used to shape —C(sI
—
. The positive gain margin of —C(sI K 1 A)
—
1 is guaranteed to be infinite and its A)
phase margin greater than 60 degrees. 2. Obtain the optimal state feedback matrix of an LQG-optimal controller K by setting
Q
= I and
1 R = p1 in (E.98). The parameter p is decreased until KP (K uses K just determined and K
from Step 1) converges to —C(sI
—
1 over a sufficiently wide range of frequencies. A)’K
Appendix F
Obtaining the frequency response data for the identification step
This section describes the experiments performed on the system shown in Figure F.56 to obtain the data (4.51). The additive noise term v is included to represent the effect of sensor noise, nonzero initial conditions, plant output disturbances or finite-length identification experiments. assumed to be unknown but bounded in magnitude for all time by
The noise term is
ij.
V +
U
y + Figure F.56: Identification experiment setup.
To obtain a bound on the error in the estimate of the frequency response it is assumed the plant’s impulse response belongs to the set
{
dt t IfQ)Ie
f
M’
The input applied to the system is uQ)
=
ae’, 0
(n
t
—
1)T.
The nth sample of the output of the system y(nT)
=
(p * u)(nT) + v(nT),
where T is the sampling interval. An estimate of the plant’s frequency response is —
y((n
—
119
—
1)T)
(F.104)
Appendix F. Obtaining the frequency response data for the identification step
120
and a bound in the error in P(jw) is
lip
—
iioo
=
:+