ISSN 2278-3091 International Journal of Advanced Trends in Computer Science and Engineering, Vol.2 , No.6, Pages : 18-21 (2013) Special Issue of ICETEM 2013 - Held on 29-30 November, 2013 in Sree Visvesvaraya Institute of Technology and Science, Mahabubnagar – 204, AP, India
Optimization of ECM Process Parameter by Using Simulated Annealing Approach Shiba Narayan Sahu1 , Debasis Nayak2 , Hemanta Kumar Rana3 1
Gandhi Institute for Education and Technology, India,
[email protected] 2 Gandhi Institute for Education and Technology, India,
[email protected] 3 Centurion University of Technology and Management, India,
[email protected]
solved by the partitioning algorithm. Finally the conclusion drawn out to be the optimal value of voltage is higher when metal removal rate is the only concern, than the requirement of geometrical accuracy is also taken into consideration. M.S. Hewidy et al. [9] worked on modelling the performance of ECM assisted by low frequency vibrations and found that low frequency tool vibrations changes the physical conditions in the inter-electrode gap which enhances the circulation of the electrolyte through the interface thereby increases the use of higher current densities and the gap pressure helps in flushing of sludge products. So the quality of the resultant surface obtained to be good. F. Klocke et al. [10] did modelling and Simulation of the ECM material removal process for the manufacture of aero engine components. They took fluid flow, electric field and heat transfer as process parameters for manufacture of a real compressor blade and simulated in one aerodynamic cross-section in two different ways. In their simulation they used the blade target geometry in order to calculate the cathode shape by inverting the electric field and both simulations showed good results compared to reality. M.S. Hewidy [11] proposed a mathematical model to control the metal removal thickness in ECM process. He utilized simultaneous rotation and movement of electrode; this helped in removing a specific amount of material from pre machined holes and rods of hardened steel specimen. Through a matrix of fine holes distributed along one of the electrode surface, the electrolyte was pumped into the gap between the tool and the work piece. Experimental data validated with the mathematical model and removal of layer thickness up to 200 µ was observed, which can be concluded as very good finishing process. S. Hinduja et al. [12] worked on modelling of ECM parameters. They coined models to calculate the current density distribution in ECM by potential models and to simulate the anodic dissolution in ECM by moving boundary models. The main objectives of these models were to predict work piece shape, cycle times, optimum process parameters, with continuous and pulsed dc for which tool was taken as cathode and work piece as anode. For the first case they found that conservation of charge is equal to ke ∇.(∇V) = 0 (1) Where ke (electrical conductivity) can be written as ke=F2 ∑k zk2 ukck (2) Where F = Faraday’s constant zk is the charge of species k c is the molar concentration of species k u is the mechanical mobility of species k
Abstract : Electro chemical machining is a non conventional machining process to machine conducting hard materials using anodic dissolution. The process parameters are needed to be optimized to get better result of material removal rate (MRR) and surface roughness (SR). In this paper MRR and SR values are optimized by Simulated Annealing (SA) and the effect of input parameters are determined by Taguchi Design while machining EN-19 tool steel. Key words: ECM, EN-19, Taguchi Design, SA
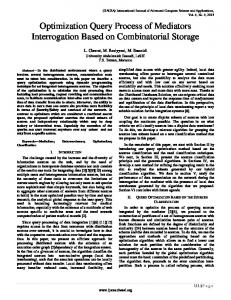
INTRODUCTION Electrochemical machining (ECM) uses a set of complex process to create a negative image of tool on workpiece by high rate anodic dissolution. This process is used to drill holes of variable cross section, removes defective surface layers to get improved surface finish. The tool in ECM, progressively advances towards workpiece maintaining an optimum working gap, typically in the order of one or several tenth of a milimeter [1]. The schematic diagram of ECM is shown in Figure 1. Electrochemical machining (ECM) is one of the best methods to machine hard materials of complex geometry. Hard materials shows better surface integrity and accuracy when machined by ECM, which makes it most popular and have increased use in industries like aircraft industries to machine turbine blades [2-5], casting industries to make dies [3] etc. So it is always needed to enhance the process capabilities of ECM. Researchers are trying to increase the performance level of ECM by modifying the tool shape [4], rotating the tool [5], use of fuzzy logic controller to control the feed rate of tool and the flow rate of electrolyte [6]. Using both conventional optimization tools like Design of Experiments (DOE), Mathematical Iterative Search and non conventional optimization tools like Metaheuristic search, Problem Specific Heuristic Search [7]. Both conventional and non-conventional optimization techniques are best suited to enhance the performance capabilities of ECM. The performance capability refers to meal removal rate, surface roughness, geometrical accuracy and total process cost. B. G. Acharya et al. [8] proposed a model in which they formulated highly non-linearized equations which was solving a multi objective problem. They linearized the equations by regression analysis and converted into a goal programming format. Finally, the problem is
18
ISSN 2278-3091 International Journal of Advanced Trends in Computer Science and Engineering, Vol.2 , No.6, Pages : 18-21 (2013) Special Issue of ICETEM 2013 - Held on 29-30 November, 2013 in Sree Visvesvaraya Institute of Technology and Science, Mahabubnagar – 204, AP, India
Similarly for the moving boundary problem, the momentary slow change in work piece is considered due to anodic dissolution of the work piece. The rate of dissolution at a point on the work piece is governed by Faraday’s law dh/dt = ( ηM / ρzF) J (3) Where η is the current efficiency, M the atomic mass, h the inter-electrode gap, and J the normal current density which is given by J=ke q (4) Neelesh K. Jain et al. [13] worked on optimization of different process parameters of different machining processes using genetic algorithms. Genetic algorithm is a kind of non-conventional optimization tool based on Metaheuristic search technique. To solve optimization and search problems, this technique utilizes the natural process of evolution. The three main operators in GA are reproduction, crossover and mutation. The process parameters are optimized as encoding them as genes by binary encoding. Jain et al. [14] utilized this technique by encoding tool feed rate, electrolyte flow velocity as process parameters to binary form as genes in ECM to get geometrical accuracy and got improved geometrical accuracy. Similarly another Metaheuristic search technique is Simulated Annealing (SA). It was first proposed by Kirkpatrick, Gelatt, and Vecchi [15] in 1983 to find global optima of cost function having several local optima. This technique converts the objective function that gives global optimal solution to random numbers. Marko Kovacevic et al. [16] made a software prototype, which validates the machining optimization solutions obtained with these meta-heuristic algorithms for different machining processes. EXPERIMENTAL DESCRIPTION
applied across two electrode terminal with a small gap size (0.1 mm – 0.5 mm) and with a high current density around 2000 A/cm2. Electrolytes typically NaCl was supplied to run through the gap with a velocity of 10-20 LPM. Surface -roughness is considered by Talysurf Profile meter. RSM was implemented to design the experiment and the effect of the factors on the responses was studied. The machining parameters Voltage (V), Feed rate (f) and Flow rate (F) were considered as process parameter to the L18 Taguchi design. Table 1 shows the Design of Experiments with Inner Array as Voltage (V), Feed rate (f) and Outer Array as Flow rate. MULTI OBJECTIVE OPTIMIZATION USING SA This paper deals with the optimisation of the ECM process based on the SA. In this work two contradicting objective functions MRR and SR (MRR is to be maximised at the same instance SR is to be minimised) has been optimized. For this a composite objective function was formed as f (V, f, F) = −MRR + SR, subjected to boundary condition 8≤V≤12, 0.1 ≤f≤0.5 and 10≤F≤20. To consider equal weightage of two responses, in each iteration individual responses were normalized in the range 0 to 1 before the composite function was evaluated.SA was implemented for minimization of composite objective function with related process parameters. RESULT AND DISCUSSION Experimental Results Using the above mentioned L18 Taguchi Design the experiment was conducted and obtained result has been tabulated in Table 2. Influence of ‘V’ on MRR The voltage has considerable effect on MRR. MRR increases with increase in ‘V’ up to 10 volt considerably and is almost linear. Then further increase in voltage to 12 volt causes reduction in MRR. This can be depicted in the figure 2.
In this investigation two contradicting response parameters MRR and SR were considered for analysis. MRR was measured in terms of volumetric loss and SR was measured in terms of arithmetic mean of the departures of the profile from the mean line.SR measurement was carried out using a portable stylus type profilometer, Talysurf.ECM was performed on EN-19 tool steel workpiece (70mm diameter, 20mm height), and a cylindrical hollow copper tube was used as electrode. In this ECM process, a low voltage (8-12V) is
Influence of ‘f’ on MRR Feed rate is the first most influencing factor to decide the MRR value. MRR increases when feed increases from 0.1 to 0.5 mm/min. INNER ARRAY
OUTER ARRAY LEVEL
FACTOR
FACTOR 1
Voltage (V)
Feed Rate (f)
LEVEL
UNIT
Volt
mm/ min
8
0.1
2
10
0.3
3
12
0.5
1
Flow Rate Of Electroly te (F)
Table 1: Design of Experiments Fig 1: Schematic diagram of ECM
19
UNIT
LPM
10
2
20
ISSN 2278-3091 International Journal of Advanced Trends in Computer Science and Engineering, Vol.2 , No.6, Pages : 18-21 (2013) Special Issue of ICETEM 2013 - Held on 29-30 November, 2013 in Sree Visvesvaraya Institute of Technology and Science, Mahabubnagar – 204, AP, India
powerful tool. The table 3 and table 4 shows that the feed rate has significant effect on both MRR and SR. Contribution of feed rate is 55.44% and 45.28% for MRR. Similarly voltage has a contribution of 26.22% and 30.23% towards MRR and SR respectively.
Influence of ‘F’ on MRR Flow rate is the third most influencing factor to show corresponding value of MRR. With increase in ‘F’, MRR increases. This can be shown by the figure 2.
Fig 2: Main effect plot for MRR
Influence of ‘V’ on SR Similarly voltage is also a deciding factor to get the value of corresponding SR as in case of MRR. SR decreases considerably with increase in value of voltage. This can be qualitatively understood from the figure 3. Influence of ‘f’ on SR As in case of MRR, here also Ton is the first most influencing factor to decide the value of SR. Here SR value increases with increase in feed rate up to 0.3mm/min then its start declining.
Voltage (V)
Feed Rate (f)
Flow rate (F)
MRR
Ra
8
0.1
10
14.20779
4.466667
8
0.3
10
1.376623
3.2
8
0.5
10
43.63636
3
10
0.1
10
21.4026
4.6
10
0.3
10
47.71429
4.266667
10
0.5
10
28.23377
6.6
12
0.1
10
11.27273
5.6
12
0.3
10
32.31169
3.333333
12
0.5
10
50.36364
4.933333
8
0.1
20
26.96104
3.666667
8
0.3
20
63.09091
3.933333
8
0.5
20
19.14286
3.666667
10
0.1
20
10.54545
5.333333
10
0.3
20
57.8961
3.6
10
0.5
20
31.19481
4.066667
12
0.1
20
5.428571
6.4
12
0.3
20
44.25974
5.866667
12
0.5
20
33.94805
3.533333
Table 2: Experimental Result
Table 3: Analysis of Variance for MRR 3
Influence of ‘F’ on SR Flow rate is the third most influencing factor to show corresponding value of SR. With, increase in flow rate SR decreases.
Source Feed Voltage Flow Rate Feed*Voltage Feed*Flow Rate Voltage*Flow Rate
MRR(mm /min) F P 146.86 0.000 69.45 0.001 56.73 0.002 5.53 0.063* 3.89 0.115* 3.24 0.145* 2 S = 1.605 R = 99.2% 2 R (adj) = 96.8%
% contribution 55.44 26.22 10.70 4.178 1.46 1.22
Table 4: Analysis of Variance for SR SR(µm) Source F P % contribution Feed 105.46 0.000 45.28 Voltage 70.42 0.001 30.23 Flow Rate 88.44 0.001 18.98 Feed*Voltage 2.12 0.242* 1.82 Feed*Flow Rate 6.03 0.062* 2.59 Voltage*Flow 0.55 0.616* 0.24 Rate 2 S = 0.1618 R = 99.1% 2 R (adj) = 96.4%
Fig. 3: Main effect plot for Ra
ANOVA for MRR and SR By using analysis of variance (ANOVA), the significant machining parameters are determined and to obtain optimal levels of machining parameters for MRR and SR, it is a
The corresponding values of MRR and SR represented in terms of two regression equations named as equation 1 and 2 respectively. 20
ISSN 2278-3091 International Journal of Advanced Trends in Computer Science and Engineering, Vol.2 , No.6, Pages : 18-21 (2013) Special Issue of ICETEM 2013 - Held on 29-30 November, 2013 in Sree Visvesvaraya Institute of Technology and Science, Mahabubnagar – 204, AP, India
CONCLUSION MRR= -163.484+ (V * 23.5944) + (f * 193.577) + (F* 6.33990)-((V^ (2))* 0.999459)-((f^ (2))*410.335) + (V*f* 14.3750)-(V*F*0.502381)-(f*F*2.83333) (1)
To find a best trade-off between the two contradicting objectives of ECM process SA was successfully integrated with regression model equation. The optimum process parameters were found out to be f= 0.3mm/min, V= 9volt and F= 20LPM, to generate optimal responses.
SR= -9.85231+ (V* 2.57153) + (f*0.347222)-(F *0.0103704)-((V^ (2))*0.111111) + ((f^ (2))*15.5556)-((V*f)*0.645833) + ((V*F)*0.0111111)-(f*F*0.333333) (2)
REFERENCES [1]
Optimization of Process parameters by SA The variation of functional values with respect to number of iterations is shown in Fig.4. The same Figure shows best point vs. number of variables plot (f, V and F has been assigned as number of variable 1, 2 and 3 respectively). This means final optimal process parameter value has been shown. The optimal process parameters obtained from the result of SA and their respective Regression equation predicted values are shown inTable5.
[2]
[3] [4]
[5]
[6]
[7]
[8] Table 5: Optimal result obtained from SA [9] Optimal parameter
process
f (mm/ min)
V(volt )
0.3
10
Optimal response parameter [10]
F (L PM ) 20
Predicted Value MRR (mm3 /min) 53.9537
Ra (µm) 3.859
Experimental Value MRR(mm3 Ra(µ /min) m) 57.8961 3.6
[11]
[12]
[13]
[14]
[15] [16]
Fig. 4 Function value vs. Iteration
21
Davydov AD, Volgin VM, Lyubimov VV. Electrochemical machining of metals: fundamentals of electrochemical shaping. Russ J Electrochem 2004;40(12):1230–65 translated from Elektrokhimiya 2004;40(12):1438–80]. Tsuneo Kurita, Mitsuro Hattori, “A study of EDM and ECM/ECM-lapping complex machining technology”, International Journal of Machine Tools & Manufacture 46 (2006) 1804–1810 V. K. Jain and K. P. Rajurkar, “An integrated approach for tool design in ECM”, Precision Engineering, April 1991 vol 13 no 2 M.S. Hewidy, K.P. Rajurkar, G. Royo, M. Fattouh, Theoretical and experimental investigation of electrochemical ballizing, Int. J. Prod. Res. (1989) 1335. S.I. Instrument, Stabilization of electrolyte flow in electrochemical machining with rotating electrode, Machines and Tooling 50 (1979) 29. A.W. Labib, V.J. Keasberry, J. Atkinson, H.W. Frost, “Towards next generation electrochemical machining controllers: A fuzzy logic control approach to ECM”, Expert Systems with Applications 38 (2011) 7486–7493 Mukherjee, I., & Ray, P. K. (2006). A review of optimization techniques in metal cutting processes. Computers and Industrial Engineering, 50(1–2), 15–34. B. G. Acharya, V. K. Jain and J. L. Batra, “Multi-objective optimization of the ECM process”, PRECISION ENGINEERING, April 1986 vol 8 no 2 M.S. Hewidy, S.J. Ebeid, T.A. El-Taweel, A.H. Youssef, “Modelling the performance of ECM assisted by low frequency vibrations”, Journal of Materials Processing Technology 189 (2007) 466–472 F. Klocke, M. Zeis, S. Harst, A. Klink, D. Veselovac, M. Baumgärtner, “Modeling and Simulation of the Electrochemical Machining (ECM) Material Removal Process for the Manufacture of Aero Engine Components”, 14th CIRP Conference on Modeling of Machining Operations (CIRP CMMO), Procedia CIRP 8 ( 2013 ) 265 – 270 M.S. Hewidy, “Controlling of metal removal thickness in ECM process”, Journal of Materials Processing Technology 160 (2005) 348–353 S. Hinduja, M. Kunieda, “Modelling of ECM and EDM processes”, CIRP Annals - Manufacturing Technology xxx (2013) xxx–xxx, G Model CIRP-1108; No. of Pages 23 Neelesh K. Jain, V.K. Jainb, Kalyanmoy Deb, “Optimization of process parameters of mechanical type advanced machining processes using genetic algorithms”, International Journal of Machine Tools & Manufacture 47 (2007) 900–919 Jain, N. K., Jain, V. K., & Deb, K. (2007). Optimization of process parameters of mechanical type advanced machining processes using genetic algorithms. International Journal of Machine Tools and Manufacture, 47(6), 900–919. Kirkpatrick, S., Gelatt, C. D., Jr., & Vecchi, M. P. (1983). Optimization by simulated annealing. Science, 220(4598), 671–680. Marko Kovacevic, Milos Madic, Miroslav Radovanovic, “Software prototype for validation of machining optimization solutions obtained with meta-heuristic algorithms”, Expert Systems with Applications 40 (2013) 6985–6996