Engineering Letters, 20:1, EL_20_1_12 ______________________________________________________________________________________
Optimization of Neural Networks for the Identification of Persons using Images of the Human Ear as a Biometric Measure Patricia Melin, Danniela Romero, Fevrier Valdez, Jose Victor Herrera-Rivera Abstract―Biometrics of the ear is a recent tool for the recognition of people with the great advantage that ears seem to maintain their structure with age. This paper describes the application of modular neural network architecture, with pre-processing, to improve the recognition of people using images of the Ear as a biometric measure. The Ear database used in this work was obtained from the University of Science and Technology of Beijing (USTB). We show the results obtained with the modular neural network, the optimization using genetic algorithms, and the integration using different methods: Winner Takes All (WTA), type-1 fuzzy integration and fuzzy integration optimized by genetic algorithms. The behavior of the simulations show a good identification, using the appropriate pre-processing, integrators and the best structure found by the genetic algorithm. Index Terms— Artificial Neural Network, Ear Biometry, Optimization, Genetic Algorithms.
I. INTRODUCTION The methods of human identification with possessions as credentials, keys, cards, or knowledge as a password, are becoming obsolete because they are slowly being replaced by biometrics whose advanced computer technology to identify individuals has been enhanced in recent years. Recognition of individuals is of great importance, since it allows us greater control over when a person has access to Manuscript received on September 1, 2011. This work was supported by the National Science and Technology Council from Mexican United States (Consejo Nacional de Ciencia y Tecnología –CONACYT– de los Estados Unidos Mexicanos). Danniela Romero is student of the Master in Computer Science program at the Instituto Tecnológico de Tijuana, Unidad Tómas Aquino, C.P. 22379 Tijuana, B.C., México. (e-mail:
[email protected]), Patricia Melin is Professor of Computer Science in the Graduate Division, Tijuana Institute of Technology, Tijuana, Mexico. Instituto Tecnológico de Tijuana, Unidad Tómas Aquino, C.P. 22379 Tijuana, B.C., México. (e-mail:
[email protected]). Fevrier Valdez is Professor of Computer Science in the Graduate Division, Tijuana Institute of Technology, Tijuana, Mexico. Instituto Tecnológico de Tijuana, Unidad Tómas Aquino, C.P. 22379 Tijuana, B.C., México. (e-mail:
[email protected]). Jose Victor Herrera-Rivera is student of the Master in Computer Science program at the Instituto Tecnológico de Tijuana, Unidad Tómas Aquino, C.P. 22379 Tijuana, B.C., México. (e-mail:
[email protected]),
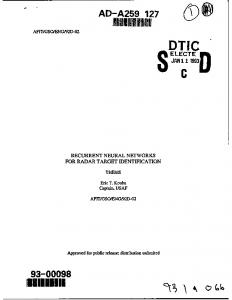
certain information, area, or simply to determine if the person is who they say they are. Recognizing a person by their physical or behavioral characteristics is becoming increasingly important. With the current systems of authentication by passwords and / or cards there are many drawbacks, including the ability to forget, copy, loss, damage or theft of the same. However, biometric systems are very versatile and also cannot forget. Examples of this technology are fingerprint identification, iris or voice by [1]. Security, in its many aspects, is a constant problem that has always worried mankind, human beings need to feel secure and dedicated it wit, effort and large sums of money [2]. Biometrics plays an important role in public safety and to accurately identify each individual and distinguishes them from each other [3]. Today there are many lines of research to authenticate a person using biometric characteristics [4] [5] and for measuring certain parameters that indicate the physical and psychological state of a person before performing an action [6] [7]. Biometric identification systems are those based on physical characteristics or morphology of human beings to do some kind of recognition [8]. This paper describes different computer vision techniques for pre-processing the image of the ear, which considered the most important features of the ear, which are Helix, Shell and lobe (included in Fig. 1). We use two-dimensional images, which is important because it allows using less specialized equipment, plus it is computationally less extensive because less information processing. We describe in the following sections the process on the different tests to find the appropriate architecture for the modular neural network and type-1fuzzy logic integrators.
Fig. 1 Main features of the ear. The helix is the outer contour of the ear, the shell is the cavity where is located the entrance to the ear, and the final roll is called lobe.
(Advance online publication: 27 February 2012)
Engineering Letters, 20:1, EL_20_1_12 ______________________________________________________________________________________ A. Modular Artificial Neural Networks An artificial neural network (ANN) is a system composed of many simple processing elements connected in parallel, whose function is determined by the structure of the network, the strength of connections and the processing performed by the elements in the nodes [9]. A neural network is said to be modular if the computation performed by the network can be decomposed into two or more modules (subsystems) that operate on distinct inputs without communicating with each other [10]. Modular neural networks are composed of modules that can be grouped according to both different structure and functionality that are integrated together through an integrated unit. With functional classification, each module is a neural network that performs a different task of identifying sub. Furthermore, using these approach different types of learning algorithms can be combined perfectly [11] [12]. In recent decades, Artificial Neural Networks have received particular interest as a technology for data mining, since it provides the means to model effective and efficient large and complex problems [13]. The ANN is a method to solve problems, individually or in combination with other methods for tasks of classification, identification, diagnosis, optimization or prediction on which the balance data / knowledge leans data and where, additionally, may have learning needs at runtime and some fault tolerance. In these cases the ANNs dynamically adapt constantly readjusting "weights" of their interconnections [14] [15]. B. Type 1 Fuzzy Logic Fuzzy logic was first proposed in the mid-sixties at the University of California at Berkeley by the brilliant engineer Lofty A. Zadeh. Who proposed what is called the principle of incompatibility: "As system complexity increases, our ability to be precise instructions and build on its behavior diminishes until a threshold beyond which the accuracy and sense are mutually exclusive characteristics [16] [17]. He then introduced the concept of a fuzzy set (fuzzy set), which is the idea that the elements on which to build human thinking are not numbers but linguistic labels. Fuzzy logics, because in fact we can talk about them in the plural, are essentially multi-valued logics that extend the classical logic [18] [19]. The latter impose on their statements true or false values only. Although they have successfully modeled a large part of the natural reasoning, it is true that human reasoning uses truth values are not necessarily as deterministic. For example, calling it the sky is blue one is tempted to graduate blue how, in fact, is heaven, and equally, if a fast-moving vehicle, also is required to consider how fast the vehicle, although this does not necessarily mean vehicle speed quantify with precision [20]. Fuzzy logic attempts to create mathematical approaches in solving certain types of problems. C. Genetic Algorithms A genetic algorithm is a search technique based on the theory of Darwinian evolution, which is represented as a new search
technique based on the theory of evolution and is known as the genetic algorithm [21]. This technique is based on the selection mechanisms that nature uses, according to which the fittest individuals of a population are those who survive, to adapt more easily to changes in their environment, were first introduced by a professor at the University of Michigan named John Holland was aware of the importance of natural selection, and in the late 60s developed a technique that was to make computers learn by themselves [22]. A technique invented by Holland was originally called "reproductive plans," but became popular under the name "genetic algorithm" after the publication of his book in 1975 [23][24]. A fairly comprehensive definition of a genetic algorithm is proposed by John Koza: "It is a highly parallel mathematical algorithm that transforms a set of mathematical objects with respect to time individual transactions using modeled after the Darwinian principle of reproduction and survival of the fittest and after having presented a series of naturally occurring genetic operations, most notably sexual recombination.[25][26] Each of these mathematical objects is usually strings of characters (letters or numbers) of fixed lengths that fits the model chains chromosomes and are associated with a certain mathematical function that reflects its fitness [26]. D. Integration Methods We can distinguish different methods of integration or combination of modules that have been considered [27][28]: Integration by Gating Network: A decomposition of a learning task into sub tasks learned by the modules of cooperation, the benefits of working with the Gating Network are: Best overall performance, reuse of existing patterns heterogeneity classifiers expert need not be the same type, different features can be used for different classifiers. The mechanism of "winner takes all: you can only use it in systems that perform similar tasks experts and offer consistent results, which is not the case of tasks such as parking a truck in which the outcome (the angle of rotation of the wheel) is a function of the position of the cab and trailer [29]. Models in series: the output of a model is used as input for the next. Fuzzy logic: We define a fuzzy membership function that indicates the model used, which provides a smooth transition between the models to give more or less weight to each model according to a set of fuzzy variables [29]. Sugeno Fuzzy Integral: For integration of the modules uses the Fuzzy Sugeno Integral. The reason this method is used is because in past research were obtained very good results in such problems as pattern recognition with modular neural networks [29]. II. PREPROCESSING THE BIOMETRIC IMAGE OF THE EAR Performing a pre-processing of the data has several advantages; the main one among them is that it can reduce the dimensional quality of data, which improves system performance substantially, especially when using a methodology such as neural networks [30]. In this stage we can pre-process the input pattern so that all images have the same size (scale) getting from this that the system does not change the scaling. Besides this, also seeks to
(Advance online publication: 27 February 2012)
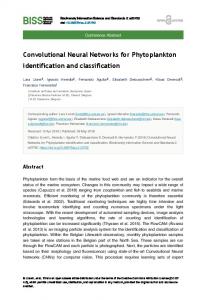
Engineering Letters, 20:1, EL_20_1_12 ______________________________________________________________________________________ ensure that the system does not change the translation. When a system does not change the translation and scaling of the patterns, says the system has prior knowledge [30]. Ear images used were acquired from University of Science and Technology Beijing (USTB). The database was developed in November 2003 and January 2004 with 77 individuals, four images of the left ear for each, giving us a total of 308 images. The images are with different contrast and angle, as shown in Fig. 2.
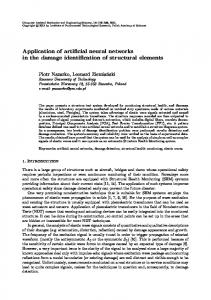
want to remove the variability associated with cover types present in the image thus standardizing response. There are several possibilities: Median Filter, assigned to the central pixel the average of all pixels included in the window. The filtering matrix would consist of some values and the divisor would be the total number of elements in the array (see Fig. 4).
Fig. 4 Median Filter Fig. 2 Images of the ear.
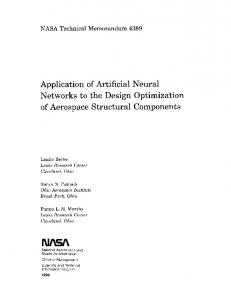
Since images of faces are regularly taken at different times, this results in the different images of a person with variations in lighting, orientation, and size of the face. Therefore, it is necessary that the image is preprocessed before it can be used. Among the pre-processing tasks can find common: extracting the facial image of a larger image that contains information irrelevant to the recognition, normalization in size, all images of the faces are larger similar, and the application of a filtering method is needed to improve the quality of the image. The pre-processing began with the algorithm for cropping the image, we used different techniques of vision to find the area of interest, one of the most important was the binarization of the image where you were cut parts leaving only black and white party, using for and “imcut” Matlab function, once you have the image with the area of interest. The next step, which is the normalization of the image, where each image is resized to another array, depending on the image containing the largest ear, leaving the image of 300x400 pixels becomes 184 * 256 pixels, as shown in Fig. 3.
Fig. 3 Cut and Standardization of the image of the ear.
To improve image quality and achieve better recognition it was decided to apply various techniques of vision indicated as follows. A. Median Filter Low Pass Filters: Its objective is to soften the image, are useful when it is assumed that the image has a lot of noise and you want to delete. They can also be used to highlight the information on a certain scale (size of the filter matrix), for example in case you
B. Contrast It is defined as the relative difference in intensity between an image point and its surroundings (see Fig. 5). It was applied to the image with an enhanced level of 0.5, according to the membership of each element of the array, the image that has an enhanced level of greater than 0.5 the image is not applied [31].
Fig. 5 shows the image contrast.
C. 2d Wavelets Finally, the compressed images using wavelet analysis in 2D with fixed threshold method, which is a technique used to reduce the size of the images without losing the necessary facial [32]. This method basically relies on the regularity of the signal in the Wavelet domain signal is for this reason that a fairly accurate approximation, and can be represented with a minimum number of coefficients. For our wavelet function was used like "Symmlet" order written as sym8 8, with 2 levels of decomposition. For details of wavelet coefficients was used to eliminate noise criteria "hard-thresholding" at 20% intensity. III. PROBLEM STATEMENT AND PROPOSED METHOD
This work studied several methods of integration that are applied to modular neural networks for recognition of people using images of the ear as a biometric measure, in addition to developing alternative methods for the integration of the network, such as the gating network, where the image without partitions is the winner, and the winner takes it all, for its acronym in English, "Winner takes All" (WTA), where the image is partitioned into three equal parts.
(Advance online publication: 27 February 2012)
Engineering Letters, 20:1, EL_20_1_12 ______________________________________________________________________________________
We first worked with a modular neural network, which uses a partition of the image into 3 parts, to get a better decision when it has to identify the person, in this case we will have 3 parts of the ear: shell, helix and lobe, which are parties to enter each module of the network, with 3 modules in each module, 3 sub-modules with a total of 9 sub-modules, as shown in Fig. 6, each sub module is trained with different training method and different number of neurons, and as we exit the integrator (WTA), which will decide which of the three parts of the ear or that of the three sub-module is the one with the highest activation, so that if we have a winner module ear or part of the winning we will identify the person. Below in Table I the parameters of the modular neural network, which were tested empirically, are shown. TABLE I Parameters of the Modular Neural Network Parameter Trainscg Traingda Traingdx No. of Neurons Epochs Learning Rate
Definition Scaled Conjugate Gradient Gradient Descent with Momentum and Adaptive Gradient Descent with Adaptive learning factor Undefined 5000 and 8000 0.01 (when not adaptive)
Each sub module is fed with different information, to find a suitable architecture for each of the 9 sub modules, helix, conch and lobe each with different methods and different number of neurons, so that each part has been learned by the network differently, where a study empirically, to see how many neurons and are appropriate times for the ANN has an acceptable learning, according to the type of training used, will depend on the number of neurons used for such training, and which may or may learn faster or slower and therefore have a bad or good learning, it must adapt to the neurons with the method of learning along with the times, modular neural networks (MNN) in each module feeds vectors or different data, leading to architectures that are not uniform. Integration links the results of each module and the result is divided by the number of elements, as shown in the following equation. The equation for the recognition rate of each module is
(1)
Where Idc: images identified, Timg: Total images. The results of each module of our modular network integrator Winner takes it all with arbitrary parameters, without pre-processing (the result of the integration of the 3 modules) are shown in Table II.
TABLE II Results of the Modular Neural Network without preprocessing of the image Best 1 2 3 4 5 6 7 8 9 10 11 12 13
Method Traingda Traingdx Trainscg
gdx,gdx,scg gdx,scg,gda gda,gdx,scg scg,gdx,gda
Traingda Traingdx Trainscg gda,gdx,scg gdx,scg,gda gda,gdx,scg
Epoch
8000 8000 8000 8000 8000 8000 8000 5000 5000 5000 5000 5000 5000
Neurons 200, 150 200, 150 200, 150 200, 150 200, 150 200, 150 200, 150 100, 50 100, 50 100, 50 100, 50 100, 50 100, 50
Time
00:07:32 00:05:23 00:04:43 00:04:31 00:07:22 00:07:40 00:07:27 00:07:13 00:05:19 00:02:39 00:04:22 00:06:58 00:07:33
% Ident. 89.80 91.02 90.57 92.18 89.97 87.93 90.68 90.90 89.98 90.12 89.05 90.43 90.23
Table II shows some results obtained from various trainings conducted in each of the modules, the best training was the number 4, 2 8, with 8000 times respectively, and a target error of 0.00001 for the ANN, these trainings were performed without pre-processing the image, uncompressed image, this training as well as the results leave us a little unhappy, because there are parameters that have a very large range, such as neurons, where put neurons put never know that many neurons are optimal and / or appropriate to have a low margin of error for this reason has chosen to make a genetic algorithm to find an appropriate percentage of identification, and thus get the kind of training and the number of neurons, once we get these parameters take the mean and standard deviation of many times the genetic algorithm can find a high percentage of identification. The results of each module of the modular neural network with gating network integration and arbitrary parameters with pre-processing (the result of the integration of the 3 modules) are shown in Table III. TABLE III Results of the MNN in the image preprocessing Best 1 2 3 4 5 6 7 8 9 10 11 12 13
Method Traingdx Trainscg Traingda gda,gdx,scg gdx,scg,gda gda,gdx,scg scg,gdx,gda Traingda Traingdx Trainscg gda,gdx,scg gdx,scg,gda gda,gdx,scg
Epoch 8000 8000 8000 8000 8000 8000 8000 5000 5000 5000 5000 5000 5000
Neurons 200,150 200,150 200,150 200,150 200,150 200,150 200,150 100,50 100,50 100,50 100,50 100,50 100,50
Time 00:06:30 00:04:12 00:04:02 00:03:41 00:06:29 00:05:03 00:06:21 00:06:17 00:04:20 00:02:05 00:03:47 00:05:51 00:03:58
% Ident. 91.82 94.33 92.05 93.55 90.80 88.91 92.75 92.49 91.93 92.09 91.51 90.81 91.46
Table III shows the results of the trainings performed, pre-image processing and compression, where one can observe that the percentages increased considerably identification with the same parameters previously performed training, methods with high percentage were 1, 2 and 4, 8000, times respectively, and an error of the ANN target of 0.00001.
(Advance online publication: 27 February 2012)
Engineering Letters, 20:1, EL_20_1_12 ______________________________________________________________________________________ A. Architecture Optimization The architecture of the modular neural network was optimized using a genetic algorithm (GA) that allows variation in the number of layers, number of neurons, and the learning methods. Once we have seen that the GA has found a good result, we decided to run the GA 10 times to find the standard deviation and average of neurons, methods, and the number of layers for understanding the behavior in training with the GA. The real chromosome is composed of 2 layers {1, 2}, and each layer is composed of 100 neurons in the first hidden layer and 80 in the 2nd hidden layer, training methods 3. The training methods are:
TABLE V Best architecture for the module 2 Method
subMOD1 TRAINSCG MOD2
MOD2
B. Role of the genetic algorithm
Objective functions of the genetic algorithm.
MOD2
(2) The objective function is the same for each of the modules of the neural network, whether we get a different architecture. C. Behavior of Neural Network Training Once the 10 runs of the GA were achieved, we obtained the best architectures of different trainings. The following tables IV, V and VI show the different architectures with a good percentage obtained in each module. The best architecture for module 1, which can be seen in Table IV for all sub modules get 100% recognition, ie recognition to the 26 images of the ear of the 26 people for a module. With a variation of neurons per layer between 14 and 20, which tells us that few neurons we better training and a lower run time. This requires to be repeated for the other two modules with the respective sub-module as shown in Tables V, VI for both neurons per layer still feel the same as module 1 few neurons increases identification. TABLE IV Best architecture for the module 1
MOD1
MOD1
MOD1
Method
C1
C2
subMOD1
TRAINSCG
20
18
subMOD2
TRAINSCG
18
16
subMOD3
TRAINSCG
21
15
Method
C1
C2
subMOD1
TRAINSCG
17
15
subMOD2
TRAINSCG
19
14
subMOD3
TRAINSCG
22
19
Method
C1
C2
subMOD1
TRAINSCG
21
19
subMOD2
TRAINSCG
20
19
subMOD3
TRAINSCG
22
20
% Iden
img
100
26/26
% Iden
img
100
26/26
% Iden
img
100
26/26
C1
C2
16
14
subMOD2
TRAINSCG
19
14
subMOD3
TRAINSCG
14
12
Method
C1
C2
subMOD1
TRAINSCG
19
18
subMOD2
TRAINSCG
18
18
subMOD3
TRAINSCG
18
17
Method
C1
C2
subMOD1
TRAINSCG
13
12
subMOD2
TRAINSCG
19
16
subMOD3
TRAINSCG
20
10
% Iden
img
100
26/26
% Iden
img
100
26/26
% Iden
img
100
26/26
TABLE VI Best architecture for the module 3 Method
C1
C2
subMOD1
TRAINSCG
20
17
MOD3 subMOD2
TRAINSCG
18
16
subMOD3
TRAINSCG
21
20
Method
C1
C2
subMOD1
TRAINSCG
19
11
MOD3 subMOD2
TRAINSCG
16
12
subMOD3
TRAINSCG
13
13
Method
C1
C2
subMOD1
TRAINSCG
18
15
MOD3 subMOD2
TRAINSCG
18
18
subMOD3
TRAINSCG
16
15
% Iden
img
100
25/25
% Iden
img
100
25/25
% Iden
img
100
25/25
D. Validate the Structure of the Modular Neural Network Table VII shows the results of cross-validations for the 3 modules, this is done with the best architecture obtained from the genetic algorithm as shown in Tables IV, V and VI, with a variation of rates between 92 to 100% identification. We choose the best architecture that can fit the percentages obtained from cross-validations for each module, whether we get a complete architecture, as shown in the following Table VIII. The experimental results of cross validation applied 4 times the best architecture, the integrator using the winner-take-all (WTA), are shown in Table IX. As shown in Table XIII, in some cases 100% of recognition was obtained, but only in some modules of the neural network, with the highest percentage of recognition validation 4, which on average has 100% recognition the 4 data validations. Once we have found the right architecture of the ANN, according to the percentage above the integrator (WTA) we chose to implement a fuzzy integrator to a greater degree of uncertainty in the time a decision is in the 3 activations that enter the fuzzy system integrator. Each module will be trained differently for variety of results, for the first module would be as follows,
(Advance online publication: 27 February 2012)
Engineering Letters, 20:1, EL_20_1_12 ______________________________________________________________________________________ module 1 (trainscg), 2nd module (trainscg) and 3rd module (trainscg), maintaining the same number of neurons. TABLE VII Result of applying cross-validation to each architecture
M1
M2
M3
V1
V2
V3
V4
%Total
96.15
92.31
92.31
100
95.19
92.31
96.15
96.15
100
96.15
96.15
96.15
96.15
100
97.11
V1
V2
V3
V4
%Total
97.69
100
100
100
99.42
100
100
100
100
100
84.6
96.15
100
100
95.18
V1
V2
V3
V4
%Total
100
100
100
100
100
92
96
92
100
95
96
96
100
100
98
The integrator is a system of fuzzy inference with type-1 fuzzy rules, in this case has worked with Mamdani type with 3 linguistic input variables and one linguistic output variable, with three membership functions. The three membership functions (MF) Triangular type used for input variables are (low, medium, high) for Helix, Shell (low, medium, high) and lobe (low, medium, high) in the output variable (winner) are three membership functions (FM), which are called (Helix, Shell, lobe) type triangular, 2 tests were conducted with different membership functions in the first case in the second triangular and Gaussian case, and its range value ranges from 0 to 1 and 24 fuzzy rules, where each FIS (fuzzy Inference System), is specialized in each module of the neural network, which will have the option of deciding which is the highest activation according to the 3 Sub modules found in each module, in order to obtain a better decision based on the activation winner. The results of the validation with the integrator Mamdani type fuzzy membership functions with triangular and Gaussian types are shown below in Tables X and XI. TABLE X Results of the Mamdani type fuzzy integrator (MF triangular). V1
TABLE VIII Best architecture obtained by the GA Method
C1
C2
subMOD1
TRAINSCG
21
19
MOD1 subMOD2
TRAINSCG
20
19
subMOD3
TRAINSCG
22
20
Method
C1
C2
subMOD1
TRAINSCG
19
18
MNN MOD2 subMOD2
TRAINSCG
18
18
subMOD3
TRAINSCG
18
17
Method
C1
C2
subMOD1
TRAINSCG
20
17
MOD3 subMOD2
TRAINSCG
18
16
subMOD3
TRAINSCG
21
20
MNN % Iden
V2
% Iden.
img
100
26/26
% Iden.
img
100
26/26
% Iden.
img
100
25/25
V4
25/26
96.15
25/26
96.15
25/26
100
26/26
100
26/26
100
26/26
100
26/26
100
26/26
100
25/25
100
25/25
100
25/25
100
25/25
76/77 00:12:03
76/77 00:12:09
98.71
100
Total img Time
76/77 00:11:23
METHOD
C1 C2 21-20-22/ trainscg 19-19-20
19-18-18/ 100 100 96.15 trainscg 18-18-18 MOD2 96.15 00:00:54 00:01:05 00:01:01 00:00:48 20-18-21/ 96 92 96 trainscg 17-16-21 MOD3 100 00:00:46 00:00:41 00:00:43 00:00:45 96.72 TOTAL 97.43 % 97.31 % 96.05 % 96.10 %
With the results shown, in case 1 where functions are triangular in validation one obtains a percentage of 97.43% and on average 96.72% was obtained for triangular. In case 2, where we worked with Gaussian membership functions, validation 3 obtained a 98.71% of identification, an average of 97.41%.
V1
V2
V3
V4
96.15 96.15 96.15 MOD1 96.15 00:01:05 00:01:02 00:00:59 00:00:58
96.15
98.71
V4
TABLE XI Results of the Mamdani type fuzzy integrator (MF Gaussian)
V3
98.71
V3
96.15 96.15 96.15 MOD1 96.15 00:01:00 00:01:04 00:01:02 00:01:10
TABLE IX Result 4 cross-validations for the best architecture. V1
V2
77/77 00:11:55
MOD2 96.15
96.15
100
96.15
METHOD C1
C2 21-20-22/ trainscg 19-19-20 19-18-18 trainscg /18-18-18
00:00:38 00:00:28 00:00:39 00:00:39 MOD3 100 0:00:56 TOTAL 97.43 %
20-18-21/ 96 100 100 trainscg 17-16-21 00:00:46 00:00:36 00:00:39 96.10 % 98.71% 97.43% 97.41 %
E. Optimizing Fuzzy Integrator In the optimization of the fuzzy integrator with a genetic algorithm (GA) to move the membership functions for the 2 cases triangular and Gaussian, and thus have a higher percentage of recognition, genetic algorithm parameters for both cases are 50 generations and 10 individuals.
(Advance online publication: 27 February 2012)
Engineering Letters, 20:1, EL_20_1_12 ______________________________________________________________________________________ For the fuzzy integrator with triangular functions each point of each gene function is therefore a triangular membership function has 3 points so we have 3 genes in a range from 0 to 1 at each point and each variable we have 9 genes, this in the input variables and output variable in the chromosome is composed of total 36 genes, which moves the genetic algorithm to find a better fuzzy in ference system (FIS). For the fuzzy integrator with Gaussian MFs each point of each function is a gene, so a membership function has 2 parameters, which are the mean and standard deviation in each of the input variables we can observe that 18 genes in each one of the modules. Once we have optimized the fuzzy inference system (FIS) for each of the cases (triangular and Gaussian), its architecture was validated, by 4 cross-validations, the results are shown below for Triangular and Gaussian. The results of integrator cross-validations with triangular membership functions, an average of 99.35% was obtained for recognition. IV. CONCLUSIONS The best result for the recognition of people using the biometric measurement of the ear was obtained using modular neural network architecture with 2 layers in each module, with 21 in the 1st hidden layer and 16 neurons in the second hidden layer. The average percentage in each generation the genetic algorithm run was 97.43%, with an average error for the first module was 0.030, for 2nd with 96.15% module was 0.0461 and average error for the third module of 100%, with a average error of 0, for winner takes it all integration 4 times validating the architecture it was 99.03%, for the fuzzy integrator with Triangular type membership functions, validating the integrator 4 times was 96.72% for the fuzzy integrator with Gaussian membership functions of validating the fuzzy integrator 4 times was 97.41% for the integrator optimized fuzzy membership functions and triangular validating type 4 times was 99.35%. Since the results were not satisfactory in the integration of fuzzy systems, we decided to apply an evolutionary approach to optimize the membership functions of this system. After applying the genetic algorithm a better recognition rate was achieved, which means that better results were obtained with the optimized system. ACKNOWLEDGMENTS We would like to express our gratitude to CONACYT, Tijuana Institute of Technology for the facilities and resources provided for the development of this research. REFERENCES
[1] B. Moreno, A. Sanchez, J. Velez, “On the Use of Outer Ear Images for Personal Identification in Security Applications”, IEEE 33rd Annual Carnahan Conference on Security Technology, pp. 469-476, 1999. [2] J. Huidobro, “Técnicas de Seguridad Biométricas”, Perspectiva empresarial, Nº 2, Marzo / Abril 2006 [3] R. Abiyev, K. Altunkaya, “Personal Iris Recognition Using Neural Network” , Near East University, Department of Computer Engineering, Lefkosa, North Cyprus, Abril, 2008. [4] A. Jain, A. Ross, S. Pankanti, “Biometrics: A Tool for Information Security", IEEE Transactions on Information Forensics and Security Vol. 1, No. 2, pp. 125-143, June 2006. [5] S. Prabhakar, S. Pankanti, A. Jain, “Biometric Recognition: Security and Privacy Concerns", IEEE Security & Privacy Magazine, Vol. 1, No. 2, pp. 33-42, March-April 2003.
[6] A. Barreto, J. Zhai, M. Adjouadi,“Non-intrusive Physiológical Monitoring for Automated Stress Detection in Human-Computer Interaction", LNCS 4796, pp 29-38, Springer-Verlag Berlin Heidelberg 2007 [7] J. Healey, A. Picard, R. W., “Detecting Stress During Real-World Driving Tasks Using Physiológical Sensors", IEEE Transaction on Intellignet Transportation Systems, Vol. 6, No. 2, Junio 2005. [8] C. Madrigal, J. Ramirez, J. Hoyos, D. Fernandez, “Diseno de un sistema biométrico de identificación usando sensores capacitivos para huellas dactilares”, Revista Facultad de Ingenieria Universidad de Antioquia, No. 039, Universidad de Antioquia, Colombia, Marzo 2007, pp. 21-32. [9] J. Jang , C. Sun , E. Mizutani, “Neuro-Fuzzy and Soft Computing”, Prentice Hall, New Jersey, 1997. [10] T. Lee “Structure level adaptation for artificial neural networks”, Kluwer Academic Publishers, 1991. [11] G. Sotolongo, M. Guzmán, “Aplicaciones de las redes neuronales. El caso de la Bibliometría”, Ciencias de la Información. Cuba 2001. [12] D. Matich, “Redes neuronales: conceptos básicos y aplicaciones”, En: Informática aplicada a la ingeniería de procesos I. Universidad Tecnológica Nacional, Facultad Regional Rosario. Marzo de 2001. [13] F. Azam, H. VanLandingham, “A modular neural network method for robust handwritten character recognition. In Artificial Neural Networks for Intelligent Engineering”, ANNIE’98, volume 8, pp. 503–508, 1998. [14] E. Castillo; A. Cobo; J. Gutiérrez, R. Pruneda “Introducción a las Redes Funciónales con Aplicaciones - Un Nuevo Paradigma Neuronal”, Paraninfo, España, 1999. [15] J.A. Freeman, D. Skapura, “Redes Neuronales. Algoritmos, aplicaciones y técnicas de propagación”, México: Addison-Wesley. 1993; p. 306. [16] L. A. Zadeh, “Fuzzy Sets”, Journal of Information and Control, Vol. 8, 1965, pp. 338–353. [17] W. Wang, S. Bridges, “Genetic Algorithm Optimization of Membership Functions for Mining Fuzzy Association Rules”, Department of Computer Science Mississippi State University, March 2, 2000. [18] G. Morales, “Introduccion a la lógica difusa”, Centro de Investigacion y Estudios Avanzados del IPN (CINVESTAV-IPN), Febrero 2002. [19] P. Melin, O. Castillo, “Hybrid Intelligent Systems for Pattern Recognition Using Soft Computing”, Springer-Verlag, Abril 2005 [20] J.A. López, “Lógica Difusa: Introducción y ConceptosBásicos”, http:// members.tripod.com/jesus_alfonso_lopez/FuzzyIntro2.html, (acceso diciembre 2008). [21] C. Darwin, “On the Origin of Species by Means of Natural Selection”, Murray, London.1859. [22] O. Castillo, P. Melin, “Soft Computing for Control of Non-Linear Dynamical Systems”, Springer-Verlag, Heidelberg, Germany, 2001. [23] M. Okamura, H. Kikuchi, R. Yager, S. Nakanishi, "Character diagnosis of fuzzy systems by genetic algorithm and fuzzy inference," Proceedings of the Vietnam-Japan Bilateral Symposium on Fuzzy Systems and Applications, Halong Bay, Vietnam 1998., pp. 468-473. [24] M. Varas, A. Urrutia, "Bases de Datos Difusas Modeladas con UML". VIII Congreso Argentino de Ciencias de la Computación. CACIC, Buenos Aires, Argentina, 2002. [25] J. Jang , C. Sun , E. Mizutani, “Neuro-Fuzzy and Soft Computing”, Prentice Hall, New Jersey, 1997. [26] J. Rodríguez, “Lógica Difusa”, Universidad De Carabobo, Facultad De Ingeniería Área De Postgrado, Inteligencia Artificial, Venezuela, Noviembre 2008. [27] J. Pozas, N. Vazquez, “Algoritmos Genéticos. Aplicación al Juego de las N Reinas”, Universidad Carlos III de Madrid, España. [28] M. Gestal, “Introduccion a los Algoritmos Genéticos”, Departamento Tecnologias de la Informacion y las Comunicaciones. Universidad de Coruña. [29] D. Goldberg, Genetic Algorithms in Search, Optimization and Machine Learning, Addison Wesley, 1989. [30] Gregory D. and Kentaro T., “X Vision: A Portable Substrate for Real-Time Vision Applications”, Department of Computer Science, Yale University, P.O. Box 208285, New Haven, Connecticut 06520, January, 1998. [31] P. Mahinda and G. Özdemir, “Edge-end Pixel Extraction for Edge-based Image Segmentation”, World Academy of Science, Engineering and Technology 2 2005. [32] L. Chao-Chun, D. Dao-Qing, “Local Discriminant Wavelet Packet Coordinates for Face Recognition”, Center for Computer Vision and Department of Mathematics, Sun Yat-Sen (Zhongshan) University, Guangzhou, 510275 China, May, 2007.
(Advance online publication: 27 February 2012)