Optimization of phase modulation with arbitrary waveform generators for optical spectral control and suppression of stimulated Brillouin scattering Achar V. Harish and Johan Nilsson∗ Optoelectronics Research Center, University of Southampton, Southampton, SO17 1BJ, UK ∗
[email protected]
Abstract: We investigate the use of an arbitrary waveform generator to phase-modulate a laser source and externally broaden its linewidth. Through nonlinear optimization in a computer, we find modulation signals that produce top-hat-shaped optical spectra of discrete lines with highest total power within a limited bandwidth and limited peak spectral power density. The required modulation bandwidth is comparable to the targeted optical bandwidth. Such spectra are attractive for suppressing stimulated Brillouin scattering in optical fiber. Experimentally, we generate 15 lines in a 0.5 GHz optical linewidth. However, the method can also be used to generate other optical spectra. © 2015 Optical Society of America OCIS codes: (060.2320) Fiber optics amplifiers and oscillators; (190.5890) Scattering, stimulated; (140.3518) Lasers, frequency modulated; (060.5060) Phase modulation.
References and links 1. R. Smith, “Optical power handling capacity of low loss optical fibers as determined by stimulated raman and brillouin scattering,” Appl. Opt. 11, 2489–2494 (1972). 2. A. Liem, J. Limpert, H. Zellmer, and A. Tunnermann, “100-W single-frequency master-oscillator fiber power amplifier,” Opt. Lett. 28, 1537–1539 (2003). 3. T. Torounidis, P. A. Andrekson, and B. Olsson, “Fiber-optical parametric amplifier with 70-dB gain,” IEEE Photon. Technol. Lett. 18(10), 1194–1196 (2006). 4. S. Yoo, C. Codemard, Y. Jeong, J. Sahu, and J. Nilsson, “Analysis and optimization of acoustic speed profiles with large transverse variations for mitigation of stimulated Brillouin scattering in optical fibers,” Appl. Opt. 49, 1388–1399 (2010). 5. F. H. Mountfort, S. Yoo, A. J. Boyland, A. S. Webb, J. Nilsson, and J. K. Sahu, “Temperature effect on the Brillouin gain spectra of highly doped aluminosilicate fibers,” CLEO Europe, Munich, Germany, paper CE.P.23 (2011). 6. Y. Jeong, J. Nilsson, J. K. Sahu, D. B. Soh, C. Alegria, P. Dupriez, C. A. Codemard, D. N. Payne, R. Horley, L. M. B. Hickey, L. Wanzcyk, J. Chryssou, J. A. Alvarez-Chavez, and P. W. Turner, “Single-frequency single-mode plane-polarized ytterbium-doped fiber master-oscillator power amplifier source with 264 W output power,” Opt. Lett. 30, 459–461 (2005). 7. Y. Jeong, J. Nilsson, J. K. Sahu, D. N. Payne, R. Horley, L. M. B. Hickey, and P. W. Turner, “Power scaling of single-frequency ytterbium-doped fiber master oscillator power amplifier sources up to 500 W,” IEEE J. Sel. Top. Quantum Electron 13, 546–551 (2007) (invited). 8. Y. Jeong, J. K. Sahu, D. B. S. Soh, C. A. Codemard, and J. Nilsson, “High-power tunable single-frequency single-mode erbium:ytterbium co-doped large-core fiber master-oscillator power amplifier source,” Opt. Lett. 30, 2997–2999 (2005). 9. G. Goodno, S. McNaught, J. Rothenberg, T. McComb, P. Thielen, M. Wickham, and M. Weber, “Active phase and polarization locking of a 1.4 kW fiber amplifier,” Opt. Lett. 35, 1542–1544 (2010).
#230648 - $15.00 USD (C) 2015 OSA
Received 18 Dec 2014; revised 16 Feb 2015; accepted 16 Feb 2015; published 9 Mar 2015 23 Mar 2015 | Vol. 23, No. 6 | DOI:10.1364/OE.23.006988 | OPTICS EXPRESS 6988
10. C. Yu, S. Augst, S. Redmond, K. Goldizen, D. Murphy, A. Sanchez, and T. Fan, “Coherent combining of a 4 kW, eight-element fiber amplifier array,” Opt. Lett. 36, 2686–2688 (2011). 11. Y. Aoki, K. Tajima, and I. Mito, “Input power limits of single-mode optical fibers due to stimulated Brillouin scattering in optical communication systems,” J. Lightwave Technol. 6(5), 710–719 (1988). 12. A. Mussot, M. Le Parquier, and P. Szriftgiser, “Thermal noise for SBS suppression in fiber optical parametric amplifiers,” Opt. Commun. 283(12), 2607–2610 (2010). 13. V. I. Kovalev, R. G. Harrison, and A. M. Scott, “The build-up of stimulated Brillouin scattering excited by pulsed pump radiation in a long optical fibre,” Opt. Commun. 185(13), 185–189 (2000). 14. C. Zeringue, I. Dajani, S. Naderi, G. Moore, and C. Robin, “A theoretical study of transient stimulated Brillouin scattering in optical fibers seeded with phase-modulated light,” Opt. Express 20(19), 21196–21213 (2012). 15. S. Hocquet, D. Penninckx, J-F. Gleyze, C. Gouedard, and Y. Jaouen, “Nonsinusoidal phase modulations for highpower laser performance control : stimulated Brillouin scattering and FM-to-AM conversion,” Appl. Opt. 49(7), 1104–1115 (2010). 16. Y. Liu, Z. Lu, Y. Dong, and Q. Li, “Research on stimulated Brillouin scattering suppression based on multifrequency phase modulation,” Chin. Opt. Lett. 7, 29–31 (2009). 17. C. Dorrer, “Spectral and temporal properties of optical signals with multiple sinusoidal phase modulations,” in CLEO: 2014, OSA Technical Digest (online) (Optical Society of America, 2014), paper STu3F.5. 18. J. C. Mauro , S. Raghavan, and A. Ruffin, “Enhanced stimulated brillouin scattering threshold through phase control of multitone phase modulation,” Opt. Eng. 0001 49(10), 100501 (2010). 19. J. Coles, B. Kuo, N. Alic, S. Moro, C. Bres, J. Boggio, P. Andrekson, M. Karlsson, and S. Radic, “Bandwidthefficient phase modulation techniques for Stimulated Brillouin Scattering suppression in fiber optic parametric amplifiers,” Opt. Express 18(17), 18138–18150 (2010). 20. S. Radic and C. J. McKinstrie, “Two-pump fiber parametric amplifiers,” Opt. Fiber Technol. 9(1), 7–23 (2003). 21. C. Robin , I. Dajani , C. Zernigue , A. Flores, B. Pulford, A. Lanari, and S. Naderi, “Pseudo-random binary sequency phase modulation in high power Yb-doped fiber amplifiers,” Proc. SPIE 8601, Fiber Lasers X: Technology, Systems, and Applications, 86010Z (2013). 22. S. K. Korotky, P. B. Hansen, L. Eskildsen, and J. J. Veselka, “Efficient phase modulation scheme for suppressing Stimulated Brillouin scattering,” in Tech. Dig. Int. Conf. Integrated Optics and Optical Fiber Comm.vol 1, paper WD2-1 (1995), pp. 110-111. 23. H. Achar Vasant and J. Nilsson, “Arbitrary Phase Modulation for Optical Spectral Control and Suppression of Stimulated Brillouin Scattering,” in Advanced Solid State Lasers, OSA Technical Digest (online) (Optical Society of America, 2014), paper AM5A.47. 24. W. Wei, L. Yi, Y. Jaoun, and W. Hu, “Bandwidth-tunable narrowband rectangular optical filter based on stimulated Brillouin scattering in optical fiber,” Opt. Express 22(19), 23249–23260 (2014). 25. T. Schanze, “Sinc interpolation of discrete periodic signals,” IEEE Trans. Signal Process. 43(6), 1502–1503 (1995). 26. A. V. Oppenheim, A. S. Willsky, and I. T. Young, Signals and Systems (Englewood Cliffs, Prentice-Hall, 1983). 27. S. Lin and B. W. Kernighan, “An effective heuristic for travelling-salesman problem,” Oper. Res. 21, 498–516 (1973). 28. D. Johnson, C. Aragon, L. McGeoch, and C. Schevon, “Optmization by simulated annealing : An experimental evaluation; part I, graph partitioning,” Oper. Res. 37(6) (1989). 29. Y. Dong, Z. Lu, Q. Li, and Y. Liu, “Broadband Brillouin slow light based on multifrequency phase modulation in optical fibers,” J. Opt. Soc. Am. B 25, C109–C115 (2008).
1.
Introduction
Stimulated Brillouin scattering (SBS) is the lowest-threshold nonlinear effect in optical fibers in case of continuous-wave (CW) light at narrow linewidth (e.g., below 1 GHz) [1]. This limits the power of systems such as the single-frequency MOPA (master oscillators - power amplifier), in which the output from a so-called single-frequency seed laser, which operates on a single longitudinal mode (SLM), is boosted in a fiber amplifier [2, 3]. Since the SBS threshold increases for linewidths larger than the SBS gain bandwidth, the output from a SLM seed laser (linewidth typically narrower than 1 MHz) is often spectrally broadened before it is amplified, to allow for higher output powers. The SBS gain bandwidth is intrinsically around 15-50 MHz in silica fiber in the 1-2 μ m wavelength range, but can be broader, effectively, e.g., as a result of acoustic waveguide engineering [4] and thermal effects[5–8] . Coherent beam combining can tolerate linewidths of well over 100 MHz or even several GHz [9, 10], which opens up for broadening beyond the effective intrinsic Brillouin gain bandwidth.
#230648 - $15.00 USD (C) 2015 OSA
Received 18 Dec 2014; revised 16 Feb 2015; accepted 16 Feb 2015; published 9 Mar 2015 23 Mar 2015 | Vol. 23, No. 6 | DOI:10.1364/OE.23.006988 | OPTICS EXPRESS 6989
Several modulation approaches have been used to broaden the linewidth. Pure phase modulation is attractive in that it can in principle be lossless and does not modulate the power [11]. Conventional techniques make use of sine-wave [3] or white-noise [12] sources to drive a phase modulator and broaden the linewidth. However, they cannot control the details of the spectrum. These details are important for SBS suppression, which calls for spectra for which the power within the intrinsic SBS gain bandwidth, as obtained with an unbroadened single-frequency laser, is smaller than the Brillouin critical power for every period of time that exceeds the corresponding SBS build-up time of the system. It is straightforward to achieve such broadening and thus suppress SBS by making it sufficiently large, but at the same time, it is often desirable to keep the linewidth as narrow as possible. These conflicting requirements are best met if the power spectrum, as measured with the resolution of the intrinsic SBS gain bandwidth, is constant within the overall linewidth. To ensure that this is the case for every period of time longer than the SBS build-up time, it is possible to use periodic modulation with a period equal to the build-up time. Then, the ideal spectrum becomes a number of equal-amplitude spectral lines in a given bandwidth, without spill-over of spectral power outside that bandwidth. There are several complications to this simple picture. Thus, while the build-up time can be determined by the intrinsic SBS gain bandwidth, it can also be longer in case of long fibers [13]. The SBS gain bandwidth can also depend on the fiber length, for short fibers , and the details of the Brillouin gain with a broadened pump further depends on the Brillouin lineshape [14]. Specifically, from [14], with a discrete periodic optical spectrum, the SBS threshold increases as the line spacing increases from about half the SBS bandwidth up to five times the Brillouin gain bandwidth. However, our objective is to investigate spectral control rather than the details of Brillouin suppression. For simplicity, we use a phase modulation frequency of ∼ 35 MHz which is approximately equal to the intrinsic SBS gain bandwidth, and is a good compromise between SBS suppression and total optical linewidth. As it comes to spectral control, phase modulation does not distribute the power evenly, generally, and there is always some power present outside a given bandwidth. In fact, with pure phase modulation it is impossible to achieve the ideal spectrum [15], but with the right modulation signal, it is possible to come close. One approach is to phase-modulate with multiple sine-waves whose frequencies and amplitudes are judiciously chosen to produce an output spectrum having nearly equal spectral components over some bandwidth [16]. Each phase modulation frequency then generates an infinite number of sidebands in the modulated light wave, with a decaying amplitude given by a Bessel function [17]. Sidebands generated by sine-wave-generators at different frequencies may then be close to each other or even at identical frequencies, if the modulation frequencies themselves are harmonics of a common fundamental frequency. These sidebands will interfere, leading to temporally varying or unpredictable spectral amplitudes, unless the sideband frequencies are identical and their relative phases are locked. If the variations are slow then the power in overlapping sidebands can exceed the Brillouin threshold, even if it is below the threshold on average. This degrades the SBS suppression [18]. Furthermore, normally the number of sine-wave generators considered is small, and the highest number of power-equalized components generated in the optical spectrum in this way is so far limited to 11 [16] using three generators. These had locked phases and a common fundamental frequency. This avoids the problem of a slowly varying spectral amplitude, and furthermore allows the phases to be adjusted to achieve the desired spectrum. Similarly, [15] uses three sine-wave-generators on a common fundamental frequency, with phase and amplitude optimized so that when the combined electrical waveform is used to phase-modulate a laser source an optical spectrum close to the ideal spectrum is obtained. SBS suppression is demonstrated, too. The authors find that a
#230648 - $15.00 USD (C) 2015 OSA
Received 18 Dec 2014; revised 16 Feb 2015; accepted 16 Feb 2015; published 9 Mar 2015 23 Mar 2015 | Vol. 23, No. 6 | DOI:10.1364/OE.23.006988 | OPTICS EXPRESS 6990
high phase modulation amplitude, well beyond π radians from a single generator, improves the results. Furthermore, the peak amplitude of the combined generators, which is not immediately clear, may well be significantly higher than that of a single generator, especially when a large number of generators is combined. In another study the laser is phase-modulated with a discontinuous frequency-hopped chirp where the modulation frequency is swept within a specific range and then abruptly switched to a new frequency for a new sweep [19]. The authors targeted a continuous spectrum rather than a discrete one. In order to avoid possible slow beating of nearby spectral components, the shift to the new frequency exceeds the Brillouin gain bandwidth. Although spectral-efficiency data such as power-in-the-bucket are not quantified, good SBS suppression is obtained experimentally. Also binary (0, π ) phase-modulation with a pseudo-random binary sequence (PRBS) is proved to be effective in suppressing SBS [20, 21]. This led to Gaussian-like optical spectra, which is typical with random or pseudo-random binary modulation. However with tailoring, binary sequences may also allow for precise spectral control of the optical spectrum, although we are not aware of any demonstration. It is also possible to cascade phase modulators, driven, e.g., by sine-waves at different frequencies [22]. In this paper, we investigate an alternative approach with a fully tailored bandwidth-limited periodic phase modulation as directly achievable with an arbitrary waveform generator (AWG) to convert a narrow line into a nearly top-hat-shaped optical spectrum of discrete lines with frequency-separation determined by the intrinsic Brillouin gain bandwidth. The broadened signal can then be amplified to high power without being limited by SBS. This expands on our previous work [23] by including additional examples, in-depth discussions, and experimental results. An AWG has been previously [24] used together with an I&Q modulator (IQM) to obtain equal amplitude spectral lines. However that technique induces intensity modulation in the lightwave, unlike the pure phase modulation we consider. 2.
Approach
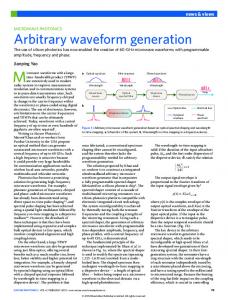
Figure 1 shows the block diagram of the scheme we consider. The AWG output is periodic, based on equidistant samples, and low-pass filtered. Nonlinear optimization is carried out to find the AWG output which when used to phase-modulate a narrow-line laser gives an optical spectrum as close as possible to the targeted, discrete, spectrum, The frequency spacing is con-
Fig. 1. Block diagram for linewidth broadening of single-frequency laser with optimized waveform generated by arbitrary waveform generator.
trolled by the period of the electrical waveform supplied by the AWG. While a top-hat spectrum of appropriately spaced discrete lines is good for suppressing SBS, and what we target, it is not
#230648 - $15.00 USD (C) 2015 OSA
Received 18 Dec 2014; revised 16 Feb 2015; accepted 16 Feb 2015; published 9 Mar 2015 23 Mar 2015 | Vol. 23, No. 6 | DOI:10.1364/OE.23.006988 | OPTICS EXPRESS 6991
necessarily optimal. However, the same approach can be used to find and realize phase modulations and spectral shapes, including those that minimize the actual SBS as calculated with sophisticated models or obtained experimentally. 3.
Nonlinear optimization procedure
We first target 29 spectral components over 1 GHz bandwidth. The problem now is to find the optimum phase modulation signal such that all the 29 spectral components have (nearly) equal power within them, with minimum power in other components. Phase modulation is a nonlinear transformation, and the optical spectrum can be wider as well as narrower than the signal used for phase modulation. The fidelity generally improves with the number of sample points in the AWG, which is proportional to the sampling frequency. We here assume a fundamental frequency fD of 35 MHz, as appropriate for SBS suppression. The period becomes 1/35 MHz = 28.57 ns. We initially consider 56 phase samples for a 1.96 GHz sampling rate and a 0.98 GHz modulation signal bandwidth, which is assumed to be given by the Nyquist frequency of half the sampling frequency. Mathematically, however, only the number of components and phase sample points matter, while the absolute frequencies are irrelevant. For the optimization we need a model for the AWG, which converts a finite number of sampled phase points into a smooth continuous modulation signal. For this, we let each sample correspond to a sinc function, and the resulting output signal is simply given by the sum of those sinc functions, each with its specific amplitude and temporal position [25]. The bandwidth of the sinc functions is equal to the Nyquist frequency, so this procedure results in the ideal recreation of a signal within the Nyquist bandwidth limit [26]. Fourier-transformation is not needed in this step, but the operation count still scales as N 2 , where N is the number of samples. This is worse than the NlogN scaling of Fourier transformation. The waveform obtained is used to drive the phase-modulator. We next Fourier-transform the resulting phase-modulated lightwave in order to find its optical spectrum. A critical point is that since phase-modulation is a nonlinear transformation which generates new frequencies in the optical domain, it is not enough to use the original sampling of the phase (here at 1.96 GHz) for this calculation. Unless otherwise stated, we resampled the reconstructed phase modulation at ten times higher frequency than the original sampling, and used this for calculating the optical spectrum. Here, we get 560 samples of the lightwave at a sampling rate of 19.6 GHz, and thus 560 frequency components over a range of ±9.8 GHz. Resampling at still-higher frequencies did not lead to further significant changes of the optical spectrum. Note that while the original number of sample points corresponds directly to the number of points used in the AWG, this resampling has no impact on a real system as it is only for computational purposes. However it makes calculations substantially slower, as we expect that the associated Fourier transformation dominates the execution time of the nonlinear optimization. An optical spectrum calculated with the original, lower, sampling of the AWG will not accurately represent the real optical spectrum, and cannot be used for optimization. For optimization, we need to assess the discrepancy between the targeted optical spectrum and the obtained spectrum. For this, we have investigated several different cost functions (also known as error or, inversely, merit functions). The cost function is then minimized in a nonlinear optimization algorithm, in order to identify the best phase modulation and optical spectrum we can find. This depends on the number of phase samples as well as the details of the target spectrum and the cost function. It also depends on the optimization algorithm, since we are not guaranteed to find the best possible solution. We used an ad-hoc optimization algorithm adapted to our problem. This gave good results, but we expect that it is possible to achieve comparable results with popular general-purpose nonlinear optimization algorithms such as hill-climbing and simulated annealing[27, 28].
#230648 - $15.00 USD (C) 2015 OSA
Received 18 Dec 2014; revised 16 Feb 2015; accepted 16 Feb 2015; published 9 Mar 2015 23 Mar 2015 | Vol. 23, No. 6 | DOI:10.1364/OE.23.006988 | OPTICS EXPRESS 6992
The cost function must reduce several desired properties into a single number. There is no unique way to do this. In case of SBS suppression, we want both as much power as possible in the 29 lines, and equal power in them. The former relates to power efficiency and the latter to SBS suppression, which are both desired properties. In the results we present, we calculate a cost function as the sum of the squares of the difference between targeted power (1/29th or 3.45% of the total power) and actual power for those 29 lines. In all cases we studied, with any number of targeted lines, we found that the peak spectral amplitude was smaller than the targeted value. In this regime, an increase of the power in any of the targeted lines reduces the cost function, but mostly when it increases in lines with low power. Thus, both an increase and a more uniform distribution of power decrease the cost function, in agreement with our objectives. It would also be possible to change their relative importance, but we did not investigate this. Note also that this sum implies there should be no power outside the 29 lines. From this sum, we subtract a fraction of the power in outlying lines that are close to the central 29 lines, since power that is outside but close to the 29 lines may still contribute to the efficacy of the lightwave. The resulting cost function becomes: Ni
No
k
k
k k )2 −Wk ∑ Poutside Cost f unction = ∑(Ptarget − Pcentral
(1)
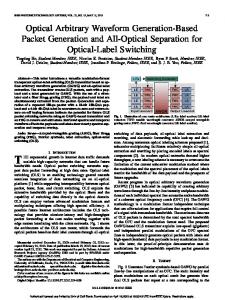
Since the first sum is quadratic in power and the second term linear, it is necessary to adjust the weight coefficients Wk to the power level used so as to properly balance the importance of the two sums. Figure 2 shows an example of the targeted spectrum, in this case with 29 central lines. We also mention that strictly, since linear terms always increase faster than quadratic terms from the origin, our cost function would not be minimized if we managed to achieve our target spectrum. In practice, however, with the weight coefficients we used, the deviations in the spectrum were always sufficiently large for this to be unimportant. Still, it illustrates the many pitfalls in the construction of the cost function.
Fig. 2. Target spectrum showing 29 spectral lines indicating lines within and outside the target bandwidth as used in Eq. (1).
4.
Numerical optimization results and discussion
Figure 3(a) shows the optimal sampled phase points and the resulting continuous electrical signal we calculated for 56 phase samples targeting equal distribution of the power over 29 discrete components with resampling rate ten times higher than the original sampling. The #230648 - $15.00 USD (C) 2015 OSA
Received 18 Dec 2014; revised 16 Feb 2015; accepted 16 Feb 2015; published 9 Mar 2015 23 Mar 2015 | Vol. 23, No. 6 | DOI:10.1364/OE.23.006988 | OPTICS EXPRESS 6993
resulting optical power spectrum, shifted to the baseband, is a good approximation of a tophat spectrum [see Fig. 3(b)]. The central 29 lines contain 85% of the power, and the power in the peak spectral component is 9% higher than the average power in those 29 lines. Figure 4 plots the cost function as described by Eq. (1) against the number of iterations in the nonlinear optimization to find the optimal phase distribution of Fig. 3(a). Initially, the cost function decays rapidly, but stays almost constant after 35 iterations.
Fig. 3. (a) Optimized phase samples with 56 points and simulated reconstruction of continuous waveform with a period of 28.57 ns and (b) Simulation of linewidth broadening over 1 GHz in 29 spectral lines of nearly equal power.
The phase distribution stretches beyond the initial range of 0 to 2π radians. There are two reasons for this. First of all, even if the sampled points stay within the [0, 2π ) range, the continuous function can still go outside of it. Furthermore, in an attempt to reduce the actual bandwidth of the modulation signal, we wanted to avoid 2π discontinuities, and thus occasionally shifted the phase by 2π in the optimization. It was not always possible to do this, since the +2π and 2π
Fig. 4. Cost function as given by Eq. (1) plotted against the iteration number during the optimization corresponding to Fig. 3.
shifts do not always cancel each other. Figure 5 shows the Fourier spectrum of the modulation signal corresponding to Fig. 3(a). While the modulation signal is strictly bandwidth-limited to the Nyquist limit, most of the power is concentrated in a fraction of this bandwidth. This #230648 - $15.00 USD (C) 2015 OSA
Received 18 Dec 2014; revised 16 Feb 2015; accepted 16 Feb 2015; published 9 Mar 2015 23 Mar 2015 | Vol. 23, No. 6 | DOI:10.1364/OE.23.006988 | OPTICS EXPRESS 6994
suggests that comparable results can be obtained with lower sampling rates and bandwidths, which would reduce system cost. Figure 6 shows optical spectra calculated with 42 (0.735 GHz modulation bandwidth) as well as 28 phase samples (0.49 GHz modulation bandwidth). The degradation is small with 42 samples, while it is more marked with 28 samples. The power in the 29 lines becomes 82% and 79%, and the power in the peak spectral component is 14% and 18% of the average power in those 29 lines for 42 and 28 phase points, respectively. We have investigated the generation of a wide range of different numbers of spectral components. Two examples are shown in Fig. 7 for 127 and 511 spectral lines. The number of phase points was 256 and 1024, respectively. The amount of power in the 127 spectral lines is 76% and the peak of the 127 spectral lines is 18% higher than the mean power in the 127 spectral lines. In case of 511 targeted spectral lines the power within them is 65 % and the peak spectral amplitude is 24 % above the mean spectral amplitude. However the nonlinear optimization is quite slow with this large number of points, and we expect that there are significantly better solutions. We have also investigated the generation of small number of lines, e.g., below ten. We have found that a modulation bandwidth that is comparable to, or slightly smaller than, the targeted optical linewidth allows for good results. This is in line with the results shown in Fig. 3 and 5.
Fig. 5. Fourier transform of the optimized waveform in Fig. 3(a).
As mentioned, one could also synthesize the same modulation signal with sine-wave generators. This approach has been used many times in the past [15, 16], and is mathematically equivalent to ours if the phases are controlled and the frequencies are harmonics of a common fundamental frequency, up to the Nyquist frequency. As discussed in [16], to achieve 11 spectral lines with equal power and 30 MHz spacing in an experiment, three different harmonic tones with optimized amplitudes and phases are added and applied to a phase-modulator. These generators provide five degrees of freedom in total, i.e., the amplitudes of the three generator and the phase differences from two of the generators to the third. Thus it is in general not possible to achieve 11 specific values, but because of the symmetry of the problem there are effectively only five target values, insofar as only relative values are specified (i.e., that they are the same). Eleven components of equal power are indeed produced in [16](See also Fig. 8 , multiple sinewave generators). Note here that there are several possible solutions to this problem [29] and the one chosen is the one that gives the smallest modulation signal amplitude. Still, the four lines adjacent to the 11 lines have nearly the same amplitude, and in total, as much as 35% of the power is outside the 11 central lines. This is not surprising, since low power in outlying lines was not a core objective of the optimization. If we do target some specific power (zero #230648 - $15.00 USD (C) 2015 OSA
Received 18 Dec 2014; revised 16 Feb 2015; accepted 16 Feb 2015; published 9 Mar 2015 23 Mar 2015 | Vol. 23, No. 6 | DOI:10.1364/OE.23.006988 | OPTICS EXPRESS 6995
Fig. 6. Optical spectrum calculated when 42 and 28 samples are optimized to demonstrate lower modulation bandwidth performance compared to Fig. 3.
power in our case) outside those 11 lines, the problem becomes over-determined. Then, a better result can be expected with a larger number of degrees of freedom, as typically provided by an AWG. We note that the problem will always be over-determined, if we consider the full, infinite, spectrum that results with sinusoidal phase modulation, rather than just the central lines. This is true also in our discrete bandwidth-limited treatment, by the factor of ten that we use for the resampling for the calculation of the optical spectrum through Fourier-transformation. Still, a better result is always expected with more degrees of freedom. Figure 8 also shows the spectrum that can be achieved with an AWG. For this, we use 24 sample points over a temporal window of (30MHz)−1 and optimize them with the same procedure and cost function as used before. The amount of power in the 11 targeted lines is 87%, which is significantly larger than the value of 65% produced with the three sine-wave generators. The peak spectral amplitude is 5% higher than the mean spectral amplitude of the 11 lines.
Fig. 7. Simulated spectra with 127 and 511 target lines generated using optimized waveforms.
We want to emphasize that regardless of practical implementation, the optimization can be performed either in the time or the frequency domain. Time-domain optimization requires Fourier transformation of a densely resampled array, whereas frequency-domain optimization requires the summation of spectral components as given by Bessel functions. The summation may be faster, especially in view of the dense resampling. These factors seem unlikely to be outweighed by the Fourier transforms more benign scaling with points - NlogN vs. N 2 (if it is not possible to truncate the spectrum generated by individual sine-wave generators).
#230648 - $15.00 USD (C) 2015 OSA
Received 18 Dec 2014; revised 16 Feb 2015; accepted 16 Feb 2015; published 9 Mar 2015 23 Mar 2015 | Vol. 23, No. 6 | DOI:10.1364/OE.23.006988 | OPTICS EXPRESS 6996
Amplitude limits on the phase modulation are straightforward to implement with timedomain optimization. This is more challenging in the frequency domain, since the temporal phase is not directly available. It is important, since the phase modulator, RF amplifier (if used), and the generators may all be limited in amplitude. Furthermore, although we have targeted 2π maximum modulation ranges, a higher value can lead to better result [19]. The generator approach that allows for the highest output signal may then be preferable, although it becomes a moot point if an RF amplifier is needed. The voltage from an AWG is often insufficient for 2π modulation, which then calls for lower-voltage or cascaded modulators or an RF amplifier. As an alternative, we found that a modulation range of 4π / 3 could also give good results, although with slightly higher modulation frequency. We believe a modulation range of π or slightly larger can suffice, but not less.
Fig. 8. Comparison of simulated spectra achieved with three sine-wave generators and with an AWG. The ideal (target) spectrum is shown, too.
We have not looked into the design of commercial AWGs. It would be possible to base them on an array of sine-wave generators, which might not have the output voltage limits encountered in practice. Perhaps the use of output amplifiers and the requirements of mainstream applications favor other implementations of commercial AWGs. In any case, the commercial availability of AWGs, albeit voltage-limited, is an important advantage of the AWG approach. Finally we mention that AWGs can insert gaps, i.e., dwell time, between periods, which could severely degrade the output spectrum as well as the SBS suppression. 5.
Experimental realization of spectra
For experiments, we used a Tektronix AWG710 in the configuration of Fig. 1, with an externalcavity tunable laser diode with sub-MHz linewidth but without any fiber amplification. The maximum sampling rate of the AWG710 is 4 GSa/s and the bandwidth of the analog output stage is 1.25 GHz. We used a ZHL-2-8 RF amplifier from Mini-Circuits with bandwidth of 1 GHz and maximum output power of 29 dBm for driving the phase modulator with Vπ = 6 V. The period of the phase modulation waveform is 30 ns, which gives a line spacing of 33.33 MHz. The AWG’s minimum sample period of 0.25 ns allows for 120 phase samples. However, for optimization we only use 30 phase samples separated by 1 ns, and target an output spectrum
#230648 - $15.00 USD (C) 2015 OSA
Received 18 Dec 2014; revised 16 Feb 2015; accepted 16 Feb 2015; published 9 Mar 2015 23 Mar 2015 | Vol. 23, No. 6 | DOI:10.1364/OE.23.006988 | OPTICS EXPRESS 6997
of 15 lines covering 0.5 GHz. The phase modulation was limited by our hardware to ±1.4π . We
Fig. 9. (a) Optimized modulation waveforms as simulated and experimentally realized in an AWG and (b) corresponding simulated optical spectrum when phase-modulated with the optimized simulated waveform.
carried out nonlinear optimization with these parameters. The resampling rate for calculating the resulting phase-modulated optical spectrum was 4 GHz. This is lower than the factor-often used above but fits to the maximum sampling rate of the AWG. The calculated optimized waveform along with the optical spectrum results are shown in Fig. 9. The optical spectrum in Fig. 9(b) shows central 15 lines which contain 86% of the total power with highest amplitude 6% above the average.
Fig. 10. a) Top-hat shaped spectrum captured in ESA when lightwave was phase modulated with waveform in Fig. 9(a) generated by AWG b) plot of backscattered SBS power from a passive optical fiber against the input Brillouin pump power which is phase modulated with proposed method compared with sinusoidal phase modulation and no phase modulation.
Figure 9(a) shows the time domain electrical waveform generated by the AWG with the optimized phase distribution along with the simulated plot. Note that while only 30 phase samples (modulation bandwidth of 1 GHz) were optimized, all the recreated phase points at 4 GHz were used in the AWG. Ideally, those extra phase points would not make a difference, but given nonlinearities in the AWG and the fact that we cannot expect ideal Nyquist filtering, we believe that this oversampling in the AWG more precisely recreates the optimized continuous modulation
#230648 - $15.00 USD (C) 2015 OSA
Received 18 Dec 2014; revised 16 Feb 2015; accepted 16 Feb 2015; published 9 Mar 2015 23 Mar 2015 | Vol. 23, No. 6 | DOI:10.1364/OE.23.006988 | OPTICS EXPRESS 6998
signal. Figure 10(a) shows the output spectrum captured by an electrical spectrum analyzer with a resolution bandwidth of 2 MHz using self-heterodyning. The peak spectral amplitude is 0.9 dB (23%) higher than the average of the 15 lines. The SNR is not sufficient to accurately determine the fraction of the power in the targeted central 15 spectral lines. Finally, In order to demonstrate the performance of the optimally phase-modulated lightwave, we launched it into a passive optical fiber and collected the backscattered SBS power. Figure 10(b) shows the resulting backscattered SBS power, together with that obtained without any modulation as well as with sinusoidal phase modulation with the same peak modulation depth (1.4π ) and period (30 ns) as that of the optimized modulation format. The optimized phase modulation is superior. 6.
Conclusion
We have investigated and demonstrated the use of an arbitrary waveform generator and an electro-optic phase modulator to broaden narrow-line laser light and thus realize optical spectra suitable for suppression of stimulated Brillouin scattering. Nonlinear optimization was used to find the optimal phase modulation. We discussed the influence of factors such as modulation bandwidth, modulation amplitude, and cost function design. In simulations, close to 90% of power is located where we want it, spectrally, in a top-hat distribution with undesirable overshoots smaller than 10%. This approach is straightforward to implement with commonly available commercial off-the-shelf components. Experimentally, we demonstrated broadening to 0.5 GHz. Future work may address the tradeoff between modulation amplitude and bandwidth, the influence and indeed optimization of the nonlinear optimization algorithm, the realization of other spectra, more precise modelling of the AWG, and the use of experimentally measured data such as SBS power in the optimization loop.
#230648 - $15.00 USD (C) 2015 OSA
Received 18 Dec 2014; revised 16 Feb 2015; accepted 16 Feb 2015; published 9 Mar 2015 23 Mar 2015 | Vol. 23, No. 6 | DOI:10.1364/OE.23.006988 | OPTICS EXPRESS 6999