Journal of Physics: Conference Series
PAPER • OPEN ACCESS
Optimization of training backpropagation algorithm using nguyen widrow for angina ludwig diagnosis To cite this article: Siti Aisyah et al 2018 J. Phys.: Conf. Ser. 1007 012050
View the article online for updates and enhancements.
This content was downloaded from IP address 38.131.138.210 on 01/05/2018 at 01:36
MECnIT IOP Conf. Series: Journal of Physics: Conf. Series 1007 (2018) 1234567890 ‘’“” 012050
IOP Publishing doi:10.1088/1742-6596/1007/1/012050
Optimization of training backpropagation algorithm using nguyen widrow for angina ludwig diagnosis Siti Aisyah*, Mawaddah Harahap, Amir Mahmud Husein Siregar, Mardi Turnip Faculty of Technology and Computer Science, Universitas prima Indonesia E-mail: *
[email protected] Abstract. Tooth and mouth disease is a co mmon disease, with a p revalence of mo re than 40% (child ren aged less than 7 years) in milk teeth and about 85% (adults aged 17 years and over) on permanent teeth. Angina Ludwig is one of mouth disease type that occurs due to infection of the tooth root and trauma of the mouth. `In this study back propagation algorithm applied to diagnose AnginaLudwig disease (using Nguyen Widrow method in optimization of t rain ing time). Fro m the experimental results, it is known that the average BPNN by using Nguyen Widrow is much faster which is about 0.0624 seconds and 0.1019 seconds (without NguyenWidrow). In contrast, for pattern recognition needs, found that back propagation without Nguyen Widrow is much better that is with 90% accuracy (only 70% with NguyenWidrow).
1. Introduction Tooth and mouth disease is a common disease, with a prevalence of more than 40% (children aged less than 7 years) in milk teeth and about 85% (adults aged 17 years and over) on permanent teeth. Dental and oral diseases can be determined by looking at various symptoms, there are 40 symptoms of dental and mouth disease with 18 types of diseases [1]. Angina Ludwig one of mouth disease type diffusa cellullitis on the base of the mouth that can soul [2]. Lack of public knowledge about this type of disease makes them unaware of the dangers that threaten their lives. In helping doctors to diagnose dental and oral diseases, some researchers propose methods of artificial intelligence, one of which is Neural Network (NN). NN is one of the most accurate methods in helping doctors analyze, model and understand complex clinical data in various medical fields such as diabetes diagnosis. [3], chest diseases [4], hepatitis [5], and skin diseases [6]. NN is accurate in nonlinear predictions and the ability to tolerate errors [7]. NN's ability is useful for generalizing, identifying nonlinear relationships and deployment in various applications [8]. One of the most wide ly used architectures by researchers is the Back propagation Neural Network (BPNN) which has the learning process and error correction in reverse. This model is widely used both for introduction and prediction with a fairly good level of accuracy [9]. BPNN is accurate to solve many real-world problems by building a trained model that runs well on some non linear problem, but lacks the need for large training data and requires high computational time to recognize patterns in high dimensions [10]. It's easy to get caught in a local flaw, causing failure to find optimal solutions and relying on initial weights, bias and parameters. Some researchers apply a heuristic algorithm to improve the accuracy of BNN, such as particle swarm optimization (PSO) [11], ant colony optimization (ACO) [12-113], bee colony algorithm (BCA) Content from this work may be used under the terms of the Creative Commons Attribution 3.0 licence. Any further distribution of this work must maintain attribution to the author(s) and the title of the work, journal citation and DOI. Published under licence by IOP Publishing Ltd 1
MECnIT IOP Conf. Series: Journal of Physics: Conf. Series 1007 (2018) 1234567890 ‘’“” 012050
IOP Publishing doi:10.1088/1742-6596/1007/1/012050
[14], and others. Nguyen Widrow is a method that can be applied to the back propagation method. This method can accelerate the initialization process of the value of the weight and value of the back propagation architecture bias so as to facilitate the achievement of its convergence value. On Nguyen Widrow initialization, initializing the bias and weights from the input unit to the output unit using the bias and scale weights within a certain range. [15]. In this research apply method of artificial neural network to diagnose dental and mouth disease angina Ludwig which optimized with Nguyen Widrow algorithm. This paper is presented as follows: Methodology Section, Results and Discussion section 3 and Conclusion Section 4. 2. Methodology Artificial neural networks provide counters that are inspired by the operating structures of the brain and the central nervous system [16]. Back propagation allows the acquisition of exponential knowledge of input-output mapping in multilayer networks [17]. Artificial neural network models require the best combination of network parameters such as training cycles, level of learning, neurons in the input layer (η), hidden and output, momentum term (α), and a good degree of accuracy of the algorithm in the prediction process [18]. The Nguyen Widrow method is the algorithm used to initialize the weights on artificial neural networks in reducing training time. Initialization of Nguyen Widrowis as follows: Set: n = input unit, p = output unit, β = scale factor = 0.7 (p) 1 / n = 0.7 √ (n & p); for each hidden unit (j = 1, ..., p), do step (c) - (f); for i = 1, ..., n (all input units), vij (old) = random numbers between -0.5 to 0.5; calculate value || vj (old) ||; initialization of the weight of the input unit (i = 1, ..., n); use the bias weight as initialization: voj = random number between -β and β. Back propagation has many layers or multi layers, the goal is to train the network to get a balance of the ability to recognize the patterns used during the training and the network's ability to respond correctly to the pattern of inputs with the patterns used during the training. The data was obtained from one of the private hospitals in Medan which was also used for studying some of the health students at the time. Table 1 Data on symptoms of Angina Ludwig is commonly felt by patients consisting of eight symptoms. Table 2 and table 3 contain the data used in this study (30 sample data) where s1 to s30 are subject and the number of symptoms of variable 8 (x1-x8). Training process and testing process using Mat lab application. The amount of data used for the training process is 20 (to be able to recognize many patterns), whereas the test uses 10 sample data. The value of variable each patient is the initialization of the perceived condition, where 1 means (yes) and 0 (no). The target on the sample data is the goal to be obtained from the data being processed. If the value generated from the testing process is still far from the target error then the iteration is done back to the target value. The sample description of column s1 in table 2 only has symptoms of pain neck (x1) and dazed (x8), so that x1 and x2 is 1 and target value 0. The description in column s2 has only neck pain (x1), difficult chew (x2) fever (x5) and dazed (x8), so that (x1) (x2) (x5) and (x8) has a value of 1 and target 1. For each description in the sample above the rest can be seen in table 2 and table 3. Table 1. Symptom data. Symptoms Neck Pain (x1) difficult chew (x2) Neck Swelling (x3) Crowded (x4) Fever (x5) Rash (x6) Ear Pain (x7) Dazed (x8)
2
MECnIT IOP Conf. Series: Journal of Physics: Conf. Series 1007 (2018) 1234567890 ‘’“” 012050
IOP Publishing doi:10.1088/1742-6596/1007/1/012050
Table 2. Sample data. s1 s2 x1 1 1 x2 0 1 x3 0 0 x4 0 0 x5 0 1 x6 0 0 x7 0 0 x8 1 1 Target 0 1
s3 s4 s5 s6 s7 s8 s9 s10 s11 s12 s13 s14 s15 1 0 0 1 0 1 0 0 0 0 1 0 1 0 1 0 0 1 1 0 1 0 1 1 1 1 0 1 0 1 0 1 1 0 1 0 0 0 1 1 1 0 0 1 1 0 0 1 0 1 1 1 0 0 0 0 1 1 0 1 1 0 0 0 0 1 1 1 0 1 1 1 0 0 1 1 1 1 1 0 0 1 1 1 0 0 0 1 1 0 1 0 0 1 0 1 0 1 0 1 1 0 1 1 1 1 0 0 1 1 0 0 1 1 1 1 1 Tabel 3. Advanced sample data.
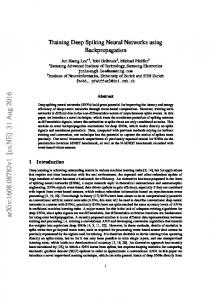
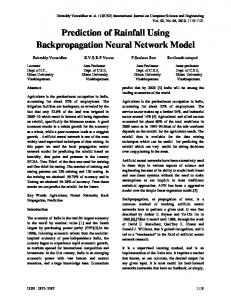
s16 s17 s18 s19 s20 s21 s22 s23 s24 s25 s26 s27 s28 s29 s30 1 1 0 0 0 1 1 0 1 0 x1 0 0 1 1 0 x2 0 1 1 0 0 1 1 0 1 1 1 1 1 0 0 x3 1 1 0 1 0 1 0 0 1 0 1 0 1 1 0 x4 0 0 1 0 1 1 0 1 1 0 0 0 1 1 0 x5 1 0 1 1 1 1 0 0 1 0 0 1 1 1 0 x6 0 1 0 0 0 1 0 0 1 1 0 1 0 0 0 x7 0 0 1 1 1 1 1 1 1 1 0 1 0 1 1 x8 0 0 1 0 1 1 0 1 0 0 1 1 0 1 1 0 1 1 1 1 0 0 1 0 1 1 1 1 0 Target 0 The design architecture in figure 1. of this research is arranged with the pattern of 8-3-1, The variables in the input layer consist of x1, x2, x3, x4, x5, x6, x7, x8 which is a symptom of the disease (8 symptoms). Hidden layers consisting of 3 variables are optional, and the output layer is the output target of the input and hidden layer. The block diagram in figure 2 illustrates how the introduction process of BPNN and Nguyen in processing the data. The dataset to be managed is called raw data (data preprocess). The raw data is divided into two groups (training and test data), where the amount of training data is greater than the test data so that more networks recognize the pattern. The next stage of normalization or scaling is done to transform the data in order to be processed. After transformation for the next process of training on the train data. Based on how to modify the weighting is divided into two things: training with supervision and unsupervision. In this learning process uses supervision training. At each training input provided to the network, when the network will process and output . The difference of between the output of the network and the target (the desired output) is the error that occurs, and the network will modify the weights accordingly. The training process also enters a further stage of propagation. the training phase will explain the steps taken in the BPNN process. Step 0: initialize the weights between neurons using small random numbers (-0.5 to 0.5); each input receives a signal and passes it across the hidden layer unit; Each hidden unit calculates the weight of the input signal; for each unit of output summing the weight of the input signal; the output unit receives a mutually appropriate pattern on the training pattern input and calculates the error information and calculates the bias weight correction; Each hidden layer unit sums the input results multiplied by a derivative of the activation function to calculate error information. From the training process obtained new weight data, this process is done repeatedly to find the appropriate weighting value. For further testing conducted by relying on training data and new weighted data on BPNN algorithm training process. At the last stage is the result of the testing process, whether Angina Ludwig disease can be recognized or not from pattern recognition. While for testing with the algorithm Nguyen Widrow for weighting using scale factor 0.7 (p) 1 / n = 0.7 √𝑝, but for the next process has the same stages with
3
MECnIT IOP Conf. Series: Journal of Physics: Conf. Series 1007 (2018) 1234567890 ‘’“” 012050
IOP Publishing doi:10.1088/1742-6596/1007/1/012050
BPNN. Testing with test data both BPNN and Nguyen done by using all sample data, so that can know the ability of network expressed in level of accuracy. x1
x2
x3 z1
x4
z2
y
x5 Output
x6
z3
hidden x7
x8
input
Figure 1. Design architecture.
Train ing Data
Angina Data
Desired Output Target
Network In Weight changes
-
+
Error Function
Out Training Algorithm (Optimization Method) Figure 2. Block diagram.
4
MECnIT IOP Conf. Series: Journal of Physics: Conf. Series 1007 (2018) 1234567890 ‘’“” 012050
IOP Publishing doi:10.1088/1742-6596/1007/1/012050
3. Results and Discussion This study focuses on the impact of the value of this activation weight during BPNN training using the Nguyen Widrow algorithm for diagnosis. Table 4 and table 5 are training data tables. The initialization given is for each variable having two terms or criterion, where the criterion are worth (Yes) or (No); Variables that contain the criterion(Yes) will get a weight of 1, while for the variable with the criterion (No) is given weight of 0. For the training process using 20 of the 30 sample data (70%), the amount of data on the Training Process is greater than the data used in the testing process, it means that the pattern is recognized by the network. Table 4. Training data. s1 s2 s3 s4 s5 s6 s7 s8 s9 s10 x1 1 1 1 0 0 1 0 1 0 0 x2 0 1 0 1 0 0 1 1 0 1 x3 0 0 0 1 0 1 0 1 1 0 x4 0 0 1 1 0 0 1 1 0 0 x5 0 1 0 0 0 0 1 1 0 1 x6 0 0 1 1 1 0 1 1 1 0 x7 0 0 1 0 0 1 1 1 0 0 x8 1 1 0 0 1 0 1 0 1 0 0 Target 0 1 1 1 0 0 1 1 0 Table 5. Advanced training data. s11 s12 s13 s14 s15 s16 s17 s18 s19 s20 x1 0 0 1 0 1 0 0 1 1 0 x2 0 1 1 1 1 0 1 1 0 0 x3 1 0 0 0 1 1 1 0 1 0 x4 1 0 1 1 1 0 0 1 0 1 x5 1 0 0 0 0 1 0 1 1 1 x6 0 1 1 1 1 0 1 0 0 0 x7 0 1 1 0 1 0 0 1 1 1 x8 1 1 0 1 1 0 0 1 0 1 1 1 1 1 0 0 1 1 1 Target 1 Based on the datasets in table 4 and 5, the next step is to normalize the matrix form with the aim to be recognized on the network architecture of BPNN. Normalization of data is done so that the network output in accordance with the activation function used. The dataset is normalized in intervals [0, 1] Binary sigmoid activation function with interval transformation data [0.1; 0.8 with equation x ^ '= (0.8 (x-a)) / (b-a) +0.1 where: a minimum data, b is maximum data, x data normalized, and x' has changed. Data processing is done in two stages, the first step is done before the training so that the pattern can be recognized, after the training continued with the testing in the second stage. In this research result of training data taken sample with log sig activation function; target error 0.1; learning rate 0.1 then the results obtained in table 6 and 7. The number of epoch given influences the outcome, the higher the epoch given the faster it will approach the target to be achieved. However in table 4 the training target results are still far from the value to be achieved. The value obtained in each sample subject on the epoch 100 is s1 0.0133, s2 0.140, s3 0.0597, s4 0.0135, s5 0.0042, s6 0.0607, s7 0.0589, s8 0.5339, s10 0.265, s11 0.0133, s12 0.1403, s13 0.0597, s14 0.0135, s15 0.0042, s16 0.0607, s17 0.0589, s18 0.5339, s19 0.0308, s20 0.781. On epoch 1000 is s1 0.0496, s2 0.0722, s3 0.0815, s4 00.531, s5 0.596, s6 0.5059, s7 0.1626, s8 0.4131, s9 0.0308, s10 0.781, s11 0.0496, s12 0.0722, s13 0.0815, s14 0.531, s15 0.596, s16 0.5059, s17 0.1626, s18 0.4131, s19 0.0308, s20 0.781. The result of the training process is still far from the target value. In the epoch 100 and 1000 still equally have not fulfilled its value, this is
5
MECnIT IOP Conf. Series: Journal of Physics: Conf. Series 1007 (2018) 1234567890 ‘’“” 012050
IOP Publishing doi:10.1088/1742-6596/1007/1/012050
because the process is still a little so the network has not really recognize the pattern. To obtain an optimal value should be done several times iterations on trained data and a large epoch value will affect the results. Table 6. Results of training. Epoch
s1 0.0133
s2 0.1403
s3 0.0597
0.0496
0.0722
0.0815
0
1
1
100 1000 Target
s4 s5 0.013 0.0042 5 0.531 0.596 1
s6 0.0607
s7 0.0589
s8 0.5339
s9 0.265
s10 0.1983
0.5059
0.1626
0.4131
0.0308
0.781
0
1
1
1
0
0
Table 7. Advanced training results. s11 s12 Epoch 0.0133 0.1403 100 0.0496 0.0722 1000 1 1 Target
s13 0.0597 0.0815 1
s14 s15 0.0135 0.0042 0.531 0.596 1 1
s16 0.0607 0.5059 0
s17 0.0589 0.1626 0
s18 s19 0.5339 0.265 0.4131 0.0308 1 1
s20 0.1983 0.781 1
The next stage is the testing process using 10 sample data, with log sig activation parameters; target error 0.1; learning rate 0.1, then the results obtained in table 8 and time calculation in table 9. BPNN test results have accuracy on each subject sample as follows: s1 80.21%, s2 50.45%, s3 88.23%, s4 81.23%, s5 78.12% , s6 77.34%, s7 79.89%, s8 80.23%, s9 81.09%, s10 78.34%. Nguyen Widrow has the following results: s1 86.98%, s250.78%, s3 49.8%, s4 80.23%, s5 43.90%, s6 88.23%, s7 76.12%, s8 79.89%, s9 92.78%, s10 87.45%. Test results using BPNN have better accuracy with 90% pattern recognition, while Nguyen Widrow recognizes 70% pattern. In table 9 is the computational time of the test results of BPNN and Nguyen Widrow. IBRA obtained the following results s1 0.08 second, s2 0.1934 second, s3 0.0469 second, s4 0.0428 second, s5 0.0296 second, s6 0.1344 second, s7 0.238 second, s8 0.135 second, s9 0.019 second, s10 0.0999 second. Nguyen Widrow obtained the following results: s1 0.1106 second, s4 0.0164 second, s3 0.0667 second, s6 0.0993 second, s7 01034 second, s8 0.0411 second, s9 0.1074 second, s10 0.0567 second. The computational time BPNN has an average iteration time of 0.1019 seconds while the Nguyen Widrow has an average iteration time of about 0.0624 seconds faster. Table 8. Test results. x1 x2 x3 x4 x5 x6 x7 x8 Target Nguyen widrow (%) BPNN (%)
s1 1 1 1 1 1 1 1 1 1 86.98
s2 1 1 0 0 0 0 1 0 0 50.78
s3 0 0 0 1 0 0 1 1 0 49.8
s4 0 1 1 1 1 1 1 0 1 80.23
s5 0 1 0 0 0 1 1 0 0 43.90
s6 1 1 1 0 0 0 0 1 1 88.23
s7 1 1 0 0 1 1 1 1 1 76.12
s8 s9 0 1 1 0 1 1 1 1 1 1 0 0 0 1 0 1 1 1 79.89 92.78
s10 0 0 0 0 0 0 1 1 0 87.45
80.21
50.45
88.23 81.23
78.12
77.34
79.89
80.23 81.09
78.34
6
MECnIT IOP Conf. Series: Journal of Physics: Conf. Series 1007 (2018) 1234567890 ‘’“” 012050
IOP Publishing doi:10.1088/1742-6596/1007/1/012050
Table 9. Computation time. Patient x1 x2 x3 s1 s2 s3 s4 s5 s6 s7 s8 s9 s10
1 1 0 0 0 1 1 0 1 0
x4 x5 x6 x7 x8
1 1 1 1 1 0 0 0 0 0 1 0 1 1 1 1 1 0 0 0 1 1 0 0 1 0 0 1 1 1 1 1 0 1 1 1 0 0 0 0 Time (seconds)
1 0 0 1 1 0 1 0 0 0
1 1 1 1 1 0 1 0 1 1
1 0 1 0 0 1 1 0 1 1
Nguyen widrow 0.1106 0.0164 0.0667 0.0059 0.0149 0.0993 0.1034 0.0411 0.1074 0.0567 0.0624
BPNN 0.08 0.1934 0.0469 0.0428 0.0296 0.1344 0.238 0.135 0.019 0.0999 0.1019
4. Conclusions This study aims to optimize the network computing time BPNN training by applying the method of Nguyen Widrow on the diagnosis of dental and mouth disease Angina Ludwig with dataset obtained from the hospital. From the experimental results it is known that the average iteration value of BPNN using Nguyen Widrow is much faster which is about 0.0624 dni 0.1019 seconds (without Nguyen Widrow). In contrast, for pattern recognition needs, it was found that back propagation without Nguyen Widrow was much better with an accuracy of 90% (only 70% with Nguyen Widrow). Reference [1] Nyoman Kusuma Wardana, Alfa Antariksa, Nazrul Effendy, 2008, Perancangan Sistem Pakar Untuk Diagnosa Penyakit Mulut Dan Gigi Menggunakan Bahasa Pemrograman Clips, Seminar Nasional Aplikasi Teknologi Informasi 2008 (SNATI 2008), 57-60 [2] Mahaputri AR, 2013, Angina Ludwig Pada Pasien Laki-laki Dewasa Muda Karena Infeksi Odontogen, Medula, Volume 1, Nomor 5, Oktober, 2013 [3] Okan Erkaymaz , Mahmut Ozer , Matjaž Perc, 2017, Performance of small-world feedforward neural networks forthe diagnosis of diabetes, Applied Mathematics and Computation, 22–28 [4] D vally, CH V Sarma, 2015, Diagnosis Chest Diseases Using Neural Network and Genetic Hybrid Algorithm. Journal of Engineering Research and Applications, ISSN : 2248-9622, Vol. 5, Issue 1, 20- 26 [5] Mehdi Neshat, Azra Masoumi, Mina Rajabi and Hassan Jafari, 2014, Diagnosing Hepatitis Disease by Using Fuzzy Hopfield Neural Network, Annual Research & Review in Biology, 2709-2721 [6] Bakpo, F. S.1 and Kabari, L. G, 2009, Diagnosing Skin Diseases Using an Artificial Neural Network, Artificial Neural Networks - Methodological Advances and Biomedical Applications, 253-270, DOI: 10.1109/ICASTECH.2009.5409725 [7] X. Shao, “Based on Two Swarm Optimized Algorithm of Neural Network to Prediction the Switch’s Traffic of Coal,” 2011 International Symposium on Computer Science and Society, pp. 299–302, Jul. 2011 [8] Bennett, C. J., Stewart, R. a., & Lu, J. W. (2014). Forecasting low voltage distribution network demand profiles using a pattern recognition based expert system. Energy, 67, 200–212 [9] Dewi, Candra dan M. Muslikh, 2013, Perbandingan Akurasi Backpropagation Neural Network dan ANFIS untuk Memprediksi Cuaca. Journal of Scientic Modelling & Computation, Vol. 1, No. 1 [10] Pan, S., Iplikci, S., Warwick, K., & Aziz, T. Z. (2012). Parkinson’s Disease tremor
7
MECnIT IOP Conf. Series: Journal of Physics: Conf. Series 1007 (2018) 1234567890 ‘’“” 012050
[11] [12] [13] [14] [15] [16] [17] [18]
IOP Publishing doi:10.1088/1742-6596/1007/1/012050
classification – A comparison between Support Vector Machines and neural networks. Expert Systems with Applications, 39 (12), 10764–10771. doi:10.1016/j.eswa.2012.02.189 B. Al-kazemi and C. K. Mohan, Training feedforward neural networks using multi-phase particle swarm optimization. ICONIP’02, Proceedings of the 9th International Conference on Neural Information Processing Orchid Country Club, Singapore, (2002), pp. 2615–2619 C. Blum and K. Soch, Training feed-forward neural networks with ant colony optimization: An application to pattern classification, Fifth International Conference on Hybrid Intelligent Systems (HIS 2005), Rio de Janeiro, Brazil (2005), pp. 233–238 Y. P. Liu, M. G. Wu, and J. X. Qian, evolving neural networks using the hybrid of ant colony optimization and BP algorithms. In Advances in Neural Networks-ISNN, Springer, Berlin Heidelberg (2006), pp. 714–722 C. Ozturk and D. Karaboga, Hybrid artificial bee colony algorithm for neural network training, IEEE Congress on Evolutionary Computation (CEC) New Orleans, USA (2011), pp. 84–88 Nasib Ridwan Manalu, Pilipus Tarigan, 2016, Perancangan Aplikasi Untuk Pengenalan Karakter Tulis Tangan Menggunakan Metode Nguyen Widrow, Pelita Informatika Budi Darma, Volume : XV, Nomor: 1, ISSN : 2301-9425, 37-40 H. R. Maier and G. C. Dandy, “Neural network based modelling of environmental variables: a systematic approach,” Mathematical and Computer Modelling, vol. 33, no. 6-7, pp. 669–682, 2001 A Turnip and D. Soetraprawata, The Performance of EEG-P300 Classification Using Backpropagation Neural Network, Mechatronics Electrical Power and Vehicular Technology, 04 (2013), 81- 88 Eldon R. Rene, M. Estefanía López, Jung Hoon Kim,and Hung Suck Park, Back Propagation Neural Network Model for Predicting the Performance of Immobilized Cell Biofilters Handling Gas-Phase Hydrogen Sulphide and Ammonia,” BioMed Research International, volume 2013 (2013), Article ID 463401, 9 pages
Acknowledgments This research support by Faculty of Technology and Computer Science, Universitas prima Indonesia.
8